. 2021 Jun 16;11(1):12154.
doi: 10.1038/s41598-021-91599-0.

Primary production ultimately limits fisheries economic performance

Affiliations

Primary production ultimately limits fisheries economic performance

Anthony R Marshak et al. Sci Rep. .

Abstract

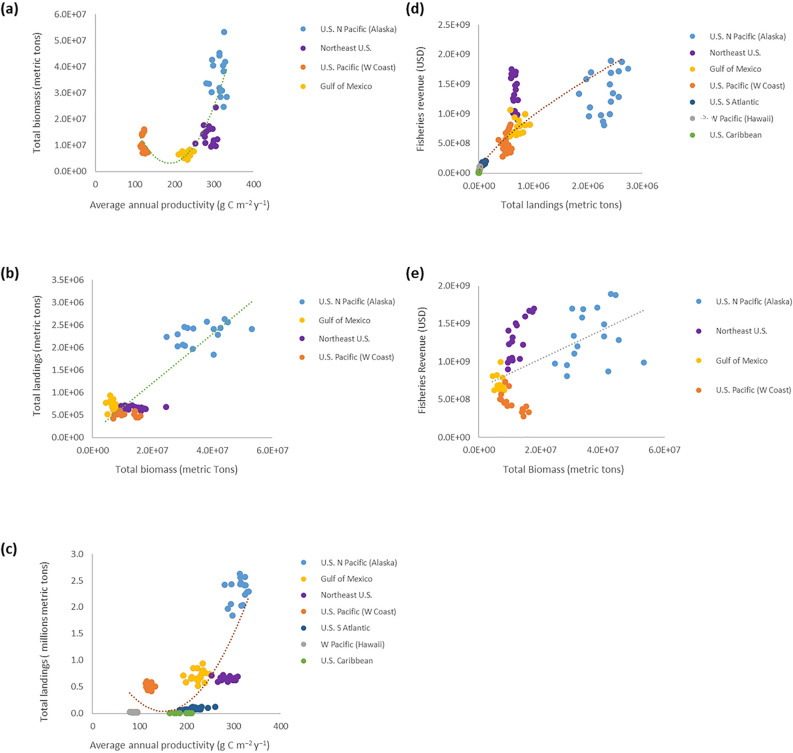
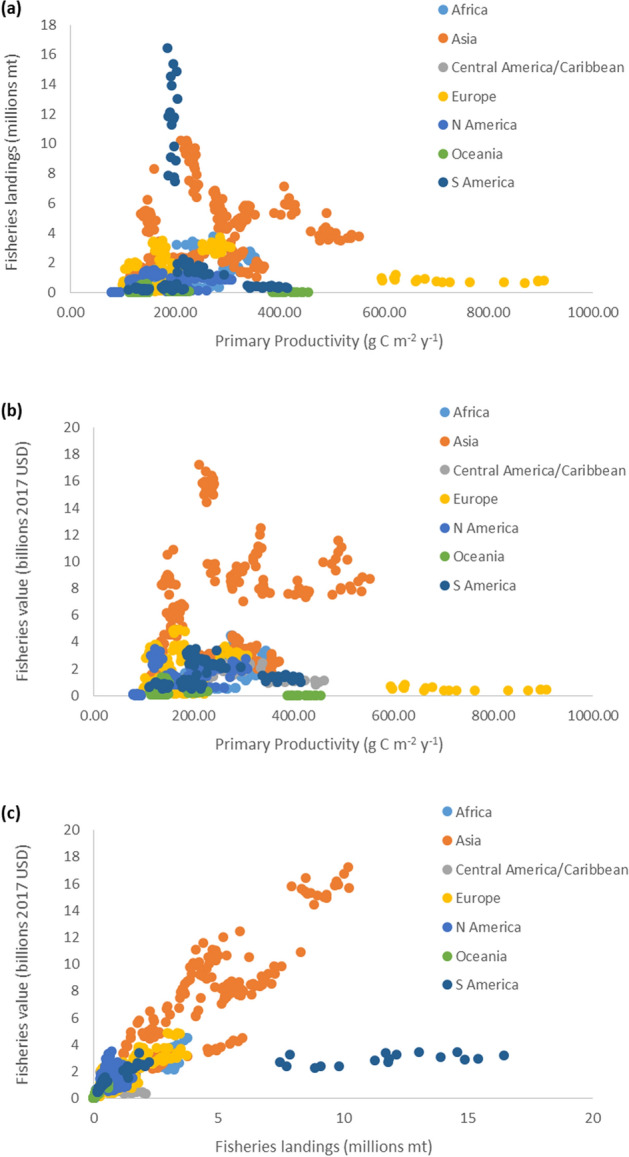
Living marine resources (LMRs) contribute considerably to marine economies. Oceans continue to respond to the effects of global change, with environmental factors anticipated to impact future seafood production and its associated economic performance. Here we document novel relationships between primary productivity and LMR-based economics for US regional marine ecosystems and 64 international large marine ecosystems (LMEs). Intermediate relationships between production, total biomass, fisheries landings, revenue, and LMR-based employment are also elucidated. We found that all these factors were dependent on the amount of basal production in a given system. In addition, factors including human population, exploitation history, and governance interventions significantly influenced these relationships. As system productivity plays a foundational role in determining fisheries-based economics throughout global LMEs, greater accounting for these relationships has significant implications for global seafood sustainability and food security. Quantifying the direct link between primary production and fisheries economic performance serves to better inform ecosystem overfishing thresholds and their economic consequences. Further recognition and understanding of these relationships is key to ensuring that these connections are accounted for more effectively in sustainable management practices.


Conflict of interest statement

The authors declare no competing interests.

Figures

Figure 1
Figure 1
Throughout major US regions, relationships among primary productivity, surveyed biomass, fisheries landings, and total fisheries revenue. (a) Relationship between average annual primary productivity (g C m−2 year−1) and total surveyed fish and invertebrate biomass (metric tons; y = 1742.4x2 − 6.6 × 105x + 6 × 107; r2 = 0.642; p < 0.0001). (b) Relationship between total surveyed fish and invertebrate biomass (metric tons) and total fisheries landings (metric tons; y = 0.0547x + 111,982; r2 = 0.813; p < 0.0001). (c) Relationship between average annual primary productivity (g C m−2 year−1) and total fisheries landings (metric tons; y = 66.092x2 − 20015x + 2 × 106; r2 = 0.667; p < 0.0001). (d) Relationship between total fisheries landings (metric tons) and total fisheries revenue (USD; y = 32187x2 − 8 × 106x + 7 × 108; r2 = 0.600; p < 0.0001). (e) Relationship between total biomass (metric tons) and total fisheries revenue (USD; y = 19.282x + 6 × 108; r2 = 0.293; p < 0.0001). Data cover years 1998–2014.
Figure 2
Figure 2
Relationship between average annual productivity (g C m−2 year−1) and total fisheries revenue (USD) throughout all major US regions. Years 1998–2014. Regression (y = 32187x2 − 8 × 106x + 7 × 108; r2 = 0.600; p < 0.0001).
Figure 3
Figure 3
Throughout all major US regions, relationships between living marine resource (LMR)-based employment and percentage of LMR-based employment within the total regional ocean economy as related to total fisheries landings and primary productivity. (a) Relationship between total fisheries landings (metric tons) and total LMR-based employment (y = 4.6292x0.5776; r2 = 0.771; p = 0.006). (b) Relationship between total fisheries landings (metric tons) and total LMR-based employment (y = 2.206x1.53; r2 = 0.388; p < 0.0001). (c) Relationship between average annual primary productivity (g C m−2 year−1) and percentage of LMR-based employment within the total regional ocean economy (y = 3 × 10−12x2 − 2 × 10−6x + 0.3907; r2 = 0.957; p < 0.0001). (d) Relationship between average annual primary productivity (g C m−2 year−1) and percentage of LMR-based employment within the total regional ocean economy (y = 0.0006x2 − 0.1998x + 14.772; r2 = 0.533; p < 0.0001). Years cover 2005–2014.
Figure 4
Figure 4
For 64 identified international Large Marine Ecosystems (as classified by continent), relationships among primary productivity, fisheries landings, and fisheries value. (a) Relationship between average annual primary productivity (g C m−2 year−1) and total fisheries landings (metric tons, mt). (b) Relationship between average annual primary productivity and fisheries value (2017 USD). (c) Relationship between total fisheries landings and fisheries value. Years cover 1998–2014.

References

    1. Kildow JT, McIlgorm A. The importance of estimating the contribution of the oceans to national economies. Mar. Policy. 2010;34:367–374. doi: 10.1016/j.marpol.2009.08.006. - DOI
    1. Lam VWY, Cheung WWL, Reygondeau G, Sumaila UR. Projected change in global fisheries revenues under climate change. Sci. Rep. 2016;6:32607. doi: 10.1038/srep32607. - DOI - PMC - PubMed
    1. Link JS, Marshak AR. Characterizing and comparing marine fisheries ecosystems in the United States: Determinants of success in moving toward ecosystem-based fisheries management. Rev. Fish Biol. Fish. 2019;29:23–70. doi: 10.1007/s11160-018-9544-z. - DOI
    1. National Marine Fisheries Service. Fisheries Economics of the United States, 2016. US Dept. of Commerce, NOAA Tech. Memo. NMFS-F/SPO-187 (2018).
    1. Jennings S, Lee J, Hiddink JG. Assessing fishery footprints and the trade-offs between landings value, habitat sensitivity, and fishing impacts to inform marine spatial planning and an ecosystem approach. ICES J. Mar. Sci. 2012;69:1053–1063. doi: 10.1093/icesjms/fss050. - DOI