. 2021 Jun 16;11(1):12620.
doi: 10.1038/s41598-021-91670-w.

Copper-binding anticancer peptides from the piscidin family: an expanded mechanism that encompasses physical and chemical bilayer disruption

Affiliations

Copper-binding anticancer peptides from the piscidin family: an expanded mechanism that encompasses physical and chemical bilayer disruption

Fatih Comert et al. Sci Rep. .

Abstract

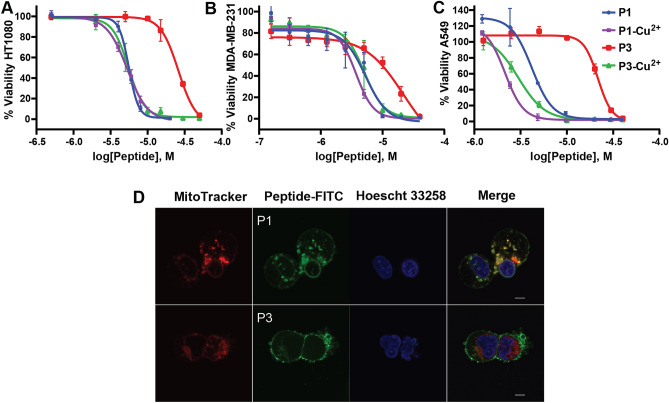
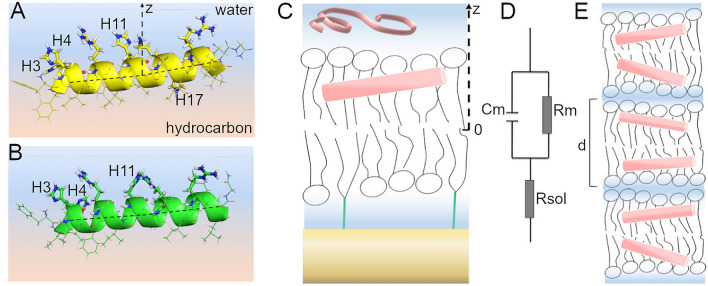
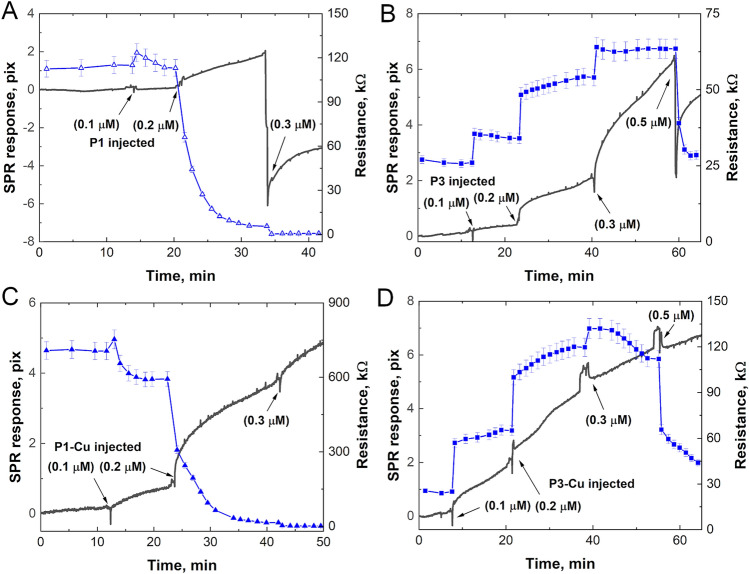
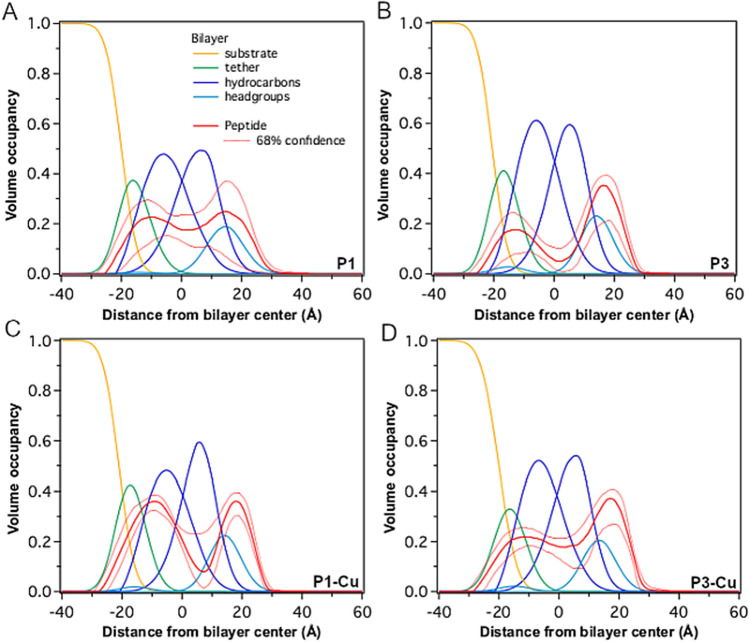
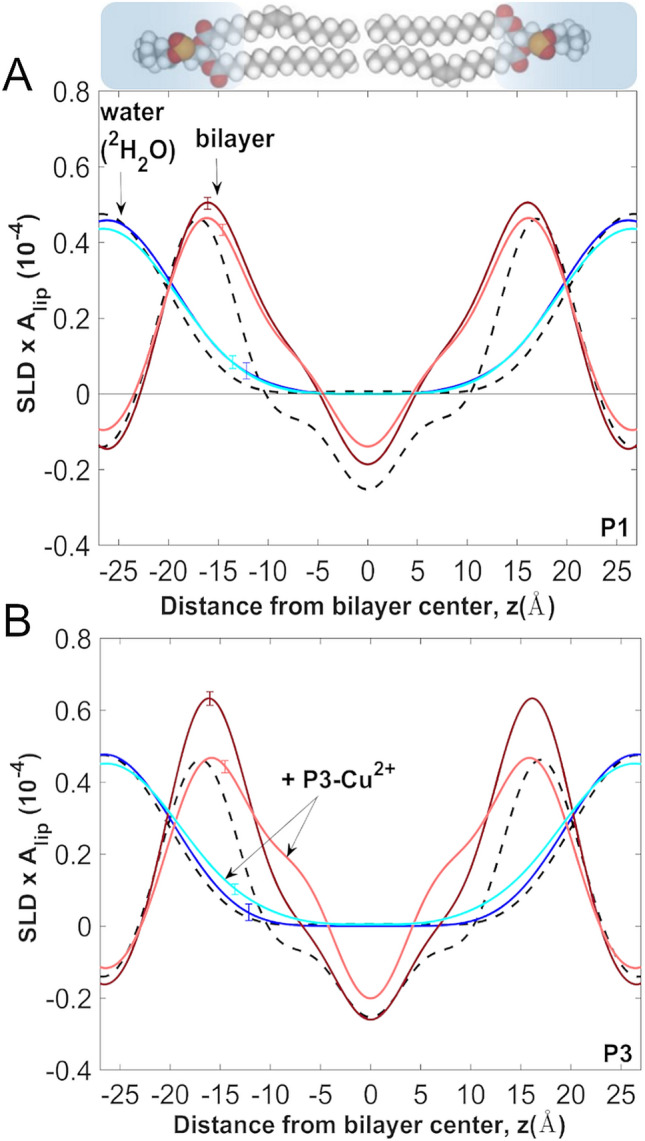
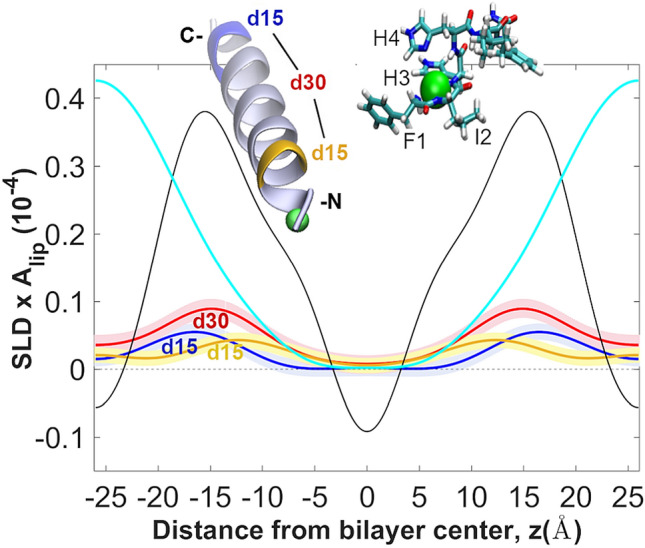
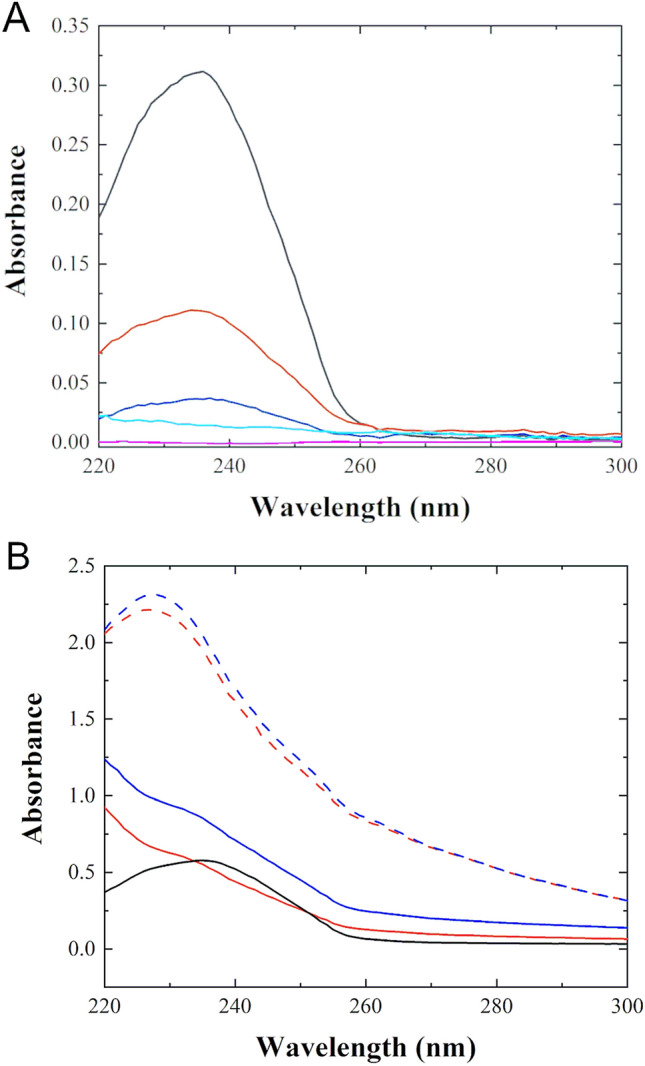
In the search for novel broad-spectrum therapeutics to fight chronic infections, inflammation, and cancer, host defense peptides (HDPs) have garnered increasing interest. Characterizing their biologically-active conformations and minimum motifs for function represents a requisite step to developing them into efficacious and safe therapeutics. Here, we demonstrate that metallating HDPs with Cu2+ is an effective chemical strategy to improve their cytotoxicity on cancer cells. Mechanistically, we find that prepared as Cu2+-complexes, the peptides not only physically but also chemically damage lipid membranes. Our testing ground features piscidins 1 and 3 (P1/3), two amphipathic, histidine-rich, membrane-interacting, and cell-penetrating HDPs that are α-helical bound to membranes. To investigate their membrane location, permeabilization effects, and lipid-oxidation capability, we employ neutron reflectometry, impedance spectroscopy, neutron diffraction, and UV spectroscopy. While P1-apo is more potent than P3-apo, metallation boosts their cytotoxicities by up to two- and seven-fold, respectively. Remarkably, P3-Cu2+ is particularly effective at inserting in bilayers, causing water crevices in the hydrocarbon region and placing Cu2+ near the double bonds of the acyl chains, as needed to oxidize them. This study points at a new paradigm where complexing HDPs with Cu2+ to expand their mechanistic reach could be explored to design more potent peptide-based anticancer therapeutics.


Conflict of interest statement

The authors declare no competing interests.

Figures

Figure 1
Figure 1
Cytotoxicity assays for the apo- and holo-states of P1 and P3 acting on cancer cells. Fibrosarcoma (HT1080), breast (MDA-MB-231), and lung (A549) cancer cell lines (panels A, B, and C, respectively) were used to measure cell viability after 24 h of treatment with different concentrations (M = mol/L) of P1 and P3 in the apo- and Cu2+-bound states. Error bars are standard deviations based on triplicates. The IC50 values are summarized in Table 1. Similar results were obtained after 48 h (Fig. S1). The peptides were metallated using a 1:1 stoichiometric amount of CuCl2. Panel C: MD-MBA-231 cells exposed to 100 nM MitoTracker (red), 5 µg/mL Hoescht 33,258, and 4 µmol/L FITC-labeled P1 or P3 (green) for 20 min. Top row: FITC-P1 stains the cellular membrane and nuclear envelope and co-localizes with MitoTracker. Bottom row: FITC-P3 stains the cellular membrane and there is co-localization with MitoTracker (left cell). Scale bar represents 5 µm.
Figure 2
Figure 2
Techniques for investigating peptide-bilayer structural interactions. (A) High-resolution structure of piscidin P1: FFHHIFRGIVHVGKTIHRLVTG (MW 2571) and (B) Piscidin P3: FIHHIFRGIVHAGRSIGRFLTG (MW 2492). The shown structures were determined by solid state NMR in 4:1 POPC/cholesterol bilayers at P/L = 1:40. The corresponding Protein Data Bank IDs are 6PF0 (P1) and 6PEZ (P3). The α-helices of the peptides lay at the bilayer-water interface, adopting orientations that are almost parallel to the bilayer surface. (C) Cartoon describing the tethered bilayer membrane used for Surface Plasmon Resonance (SPR), Electrical Impedance Spectroscopy (EIS) and neutron reflectometry (NR). The tethered molecules (green) create a 10 Å thick sub-membrane aqueous space. (D) The simplest electric circuit model to describe the surface-supported bilayer, characterized by the membrane capacitance (Cm), resistance (Rm), and solvent resistance (Rsol). (E) Oriented lipid multilayers with peptide incorporated as described in the Methods for the neutron diffraction (ND) experiments. The repeat spacing (d) denotes the dimension of the repeat unit (thickness of the bilayer with its hydration layer).
Figure 3
Figure 3
SPR/EIS of P1 and P3 with or without Cu2+. The black curves are the SPR responses, and the blue curves are the calculated bilayer resistance values from EIS measurements. Peptides were added in small increments on top of a stable POPC tBLM. SPR/EIS signals were collected simultaneously as a function of time: (A) P1, (B) P3, (C) P1-Cu2+, and (D) P3-Cu2+. The peptides were metallated using a 1:1 stoichiometric amount of CuCl2. See also Fig. S3. (µM = µmol/L).
Figure 4
Figure 4
Neutron reflectometry of P1 and P3 in the apo- and holo-states. The time and ensemble average spatial profiles of the various components of the tBLM (Fig. 2A) are shown as projections on the normal to the bilayer surface for (A) P1, (B) P3, (C) P1-Cu2+, and (D) P3-Cu2+. The peptides were metallated using a 1:1 stoichiometric amount of CuCl2. The inner bilayer leaflet is attached to the gold coated substrate (yellow) via molecular tethers (green). The outer leaflet of the bilayer is exposed to the aqueous compartment from which each peptide solution is injected.
Figure 5
Figure 5
Bilayer scattering length density profiles from neutron diffraction on oriented lipid multilayers. (A) The scattering length density (SLD) profiles of the bilayer are shown as projections on the bilayer normal (z-axis) for POPC (black), P1/POPC (dark red), and P1-Cu2+/POPC (pink). The peptides were metallated using a 1:1 stoichiometric amount of CuCl2. The corresponding water profiles, determined from H2O/2H2O contrast are overlaid for POPC (black), P1/POPC (dark blue), and P1-Cu2+/POPC (light blue). Peptides distribute equally on both sides of the bilayer during their incubation with liposomes and deposition on the substrate (see Methods). (B) Same as in (A) but for P3. All oriented samples were prepared in POPC at P/L = 1:25, and measured at 23 °C and 93% relative humidity achieved by using the vapor phase of saturated salt solutions. The small error bars on the curves represent the uncertainty in the profiles, which were calculated using a 95% confidence interval in the Monte-Carlo sampling of the structure factors. Structure factors and standard deviations are given in Table S2. All profiles were determined on a per-lipid scale using structure factors calibrated to reflect the composition of the unit cell and without explicitly determining the area per lipid.
Figure 6
Figure 6
Positioning of P3-Cu2+ in the bilayer with ND and deuterium contrast. The SLD profiles of two groups of specifically deuterated amino acids near the N-terminus (I5d10F6d5; yellow) and C-terminus (F19d5L20d10; blue) of P3 were obtained, as well as their sum (red) (Methods). Each profile represents time and ensemble averages of each of deuterated groups in the thermally disordered bilayer. The overall profiles for the neat POPC bilayer with P3-Cu2+ (black) and the water distribution (blue) are overlaid on those for the deuterated groups. Measurements were done at P/L = 1:25, 23 °C, and 93% relative humidity. Uncertainty bands in the deuterium profiles (colored bands) were determined using a 68% confidence interval in the Monte-Carlo sampling of the measured structure factors. The inset show representative average conformation of the P3 α-helix in the bilayer, using a 3D structure derived from the NMR structure (PDB ID # 6PEZ) and the predicted structure of the Cu2+-bound ATCUN motif based on density functional theory calculations. The orientation of the α-helix in the bilayer is derived from the diffraction SLD profiles. The two deuterated sites are shown with yellow and blue; the Cu2+ ion (green sphere) is shown at a larger than true scale for better visibility.
Figure 7
Figure 7
Absorbance measurements from vesicles containing a polyunsaturated lipid exposed to Cu2+ and piscidin bound to Cu2+. SUVs made of 3:1 DLPC/POPG were prepared and exposed to different forms and amounts of Cu2+ and measured by UV spectrophotometry after 24 h of exposure. (A) Samples containing SUVs at a fixed lipid concentration of 0.50 mg/mL (640 µmol/L) were mixed with various amounts of CuCl2, as follows: Cu2+/L = 1:2 molar ratio (black), Cu2+/L = 1:8 (red), Cu2+/L = 1:32 (blue), BHT/L = 1:100, and Cu2+/L = 1:8 (cyan) and lipid alone (magenta). (B) SUVs at a concentration of 0.20 mg/mL (260 µmol/L) were studied in the presence of the peptides at P/L = 1:10, corresponding to a peptide-Cu2+ complex concentration of 26 µmol/L. P1-Cu2+ (blue, dashed); P3- Cu2+ (red, dashed); P1 (blue); P3 (red); lipid alone (black). The source of free Cu2+ (CuCl2) was the same as that used for metallating P1 and P3. Measurements were taken in triplicates at 24 h after exposure. The spectra were corrected for the background signals from CuCl2 and the lipids at time zero as explained in the Methods. Uncertainties are smaller than the line thicknesses. Strong absorbance at 234 nm after 24 h of exposure points at the formation of lipid oxidation products, a result confirmed by mass spectrometry (Fig. S7).

Similar articles

Cited by

References

    1. Szakács G, Paterson JK, Ludwig JA, Booth-Genthe C, Gottesman MM. Targeting multidrug resistance in cancer. Nat. Rev. Drug Discov. 2006;5:219–234. doi: 10.1038/nrd1984. - DOI - PubMed
    1. Zavascki AP, Goldani LZ, Li J, Nation RL. Polymyxin B for the treatment of multidrug-resistant pathogens: a critical review. J. Antimicrob. Chemother. 2007;60:1206–1215. doi: 10.1093/jac/dkm357. - DOI - PubMed
    1. Yount NY, Yeaman MR. Emerging themes and therapeutic prospects for anti-infective peptides. Annu. Rev. Pharmacol. Toxicol. 2012;52:337–360. doi: 10.1146/annurev-pharmtox-010611-134535. - DOI - PubMed
    1. Baym M, Stone LK, Kishony R. Multidrug evolutionary strategies to reverse antibiotic resistance. Science. 2016;353:1147–1151. doi: 10.1126/science.aag0822. - DOI - PMC - PubMed
    1. Karam G, Chastre J, Wilcox MH, Vincent JL. Antibiotic strategies in the era of multidrug resistance. Crit. Care. 2016;20:136. doi: 10.1186/s13054-016-1320-7. - DOI - PMC - PubMed

Publication types