. 2021 Jul;595(7868):578-584.
doi: 10.1038/s41586-021-03651-8. Epub 2021 Jun 16.

Tissue-resident macrophages provide a pro-tumorigenic niche to early NSCLC cells

Affiliations

Tissue-resident macrophages provide a pro-tumorigenic niche to early NSCLC cells

María Casanova-Acebes et al. Nature. 2021 Jul.

Abstract

Macrophages have a key role in shaping the tumour microenvironment (TME), tumour immunity and response to immunotherapy, which makes them an important target for cancer treatment1,2. However, modulating macrophages has proved extremely difficult, as we still lack a complete understanding of the molecular and functional diversity of the tumour macrophage compartment. Macrophages arise from two distinct lineages. Tissue-resident macrophages self-renew locally, independent of adult haematopoiesis3-5, whereas short-lived monocyte-derived macrophages arise from adult haematopoietic stem cells, and accumulate mostly in inflamed lesions1. How these macrophage lineages contribute to the TME and cancer progression remains unclear. To explore the diversity of the macrophage compartment in human non-small cell lung carcinoma (NSCLC) lesions, here we performed single-cell RNA sequencing of tumour-associated leukocytes. We identified distinct populations of macrophages that were enriched in human and mouse lung tumours. Using lineage tracing, we discovered that these macrophage populations differ in origin and have a distinct temporal and spatial distribution in the TME. Tissue-resident macrophages accumulate close to tumour cells early during tumour formation to promote epithelial-mesenchymal transition and invasiveness in tumour cells, and they also induce a potent regulatory T cell response that protects tumour cells from adaptive immunity. Depletion of tissue-resident macrophages reduced the numbers and altered the phenotype of regulatory T cells, promoted the accumulation of CD8+ T cells and reduced tumour invasiveness and growth. During tumour growth, tissue-resident macrophages became redistributed at the periphery of the TME, which becomes dominated by monocyte-derived macrophages in both mouse and human NSCLC. This study identifies the contribution of tissue-resident macrophages to early lung cancer and establishes them as a target for the prevention and treatment of early lung cancer lesions.


Figures

Extended Data Fig. 1 |
Extended Data Fig. 1 |. Macrophage distribution and profile in NSCLC lesions.
a, Gating strategy for sorting of myeloid cells from naive and KP tumour-bearing lungs of Map17creER/+R26tdTom mice for scRNA-seq analysis. Monocytes and macrophages in the lung were gated as singlets, DAPICD45+Li nCD11b−/+Ly6GCD11clo-int-+SIGLECF+ and Tom or Tom+. b, Confocal imaging of tdTomato+ bone-marrow-derived leukocytes and TRMs (CD206+, yellow). Images are representative of a single experiment and three tumours imaged. c, Gating strategy for sorting of myeloid cells from naive and KP tumour-bearing lungs of Cx3cr1creER/+R26YFP mice. Monocytes and macrophages were gated as in a and further separated based on YFP expression. d, Confocal imaging of YFP+ bone-marrow-derived leukocytes (red) and TRMs (CD206+, yellow). Scale bar, 50 μm. Images are representative of a single experiment and three tumours imaged. e, Spearman correlation of variable gene expression between the human monocyte and macrophage clusters detected in ref. and those in ref. . f, The log2-transformed fold change (FC) between human TRM expression and the maximum cluster expression of non-TRM monocytes and macrophages, determined from data in ref. (x axis) or ref. (y axis). The human alveolar macrophage genes published previously are highlighted in red. g, Spearman correlation of variable gene expression between the mouse monocyte and macrophage clusters detected in the present study and in ref. . h, Average expression of selected mouse genes from scRNA-seq data in cluster groups I to IV (see Supplementary Table 2). i, Average expression of selected human genes from scRNA-seq data (see Supplementary Table 1). j, Confocal imaging of CD169cre/+R26tdTom KP lesions (day 30, KP-GFP, green) with CD206 (yellow). Scale bar, 100 μm. Images are representative of a single experiment and three tumours imaged. k, Gating strategy for the identification of TRMs and MDMs in naive lungs. TRMs were gated as live/deadCD45+Ly6GCD64+ME RTK+CD2+CD169+CD206+SIGLECF+; MDMs were gated as singlets, live/deadCD 45+Ly6GCD64+Mertk+CD2CD11bhiCD169CD206SIGLECF.
Extended Data Fig. 2 |
Extended Data Fig. 2 |. Fate-mapping of macrophages in KP tumours.
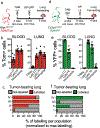
a, Lineage tracing experiment in Map17creER/+R26tdTom mice. b, Fraction of labelled (red, tdTom+) cells in the peripheral blood and lung of non-tumour-bearing Map17creER/+R26tdTom mice 6 months after tamoxifen injection (n = 6 blood, n = 5 lung; two independent experiments). Blood Ly6Chi monocytes were identified as singlets, DAPICD45+CD11b+CD115+Ly6Chi or Ly6Clo monocytes as CD45+CD11b+CD115+Ly6Clo. Lung monocytes were gated as CD45+CD11b+CX3C R1+Ly6Chi or Ly6Clo. Neutrophils in blood and lungs were identified as singlets, DAPICD45+CD11b+Ly6G+. TRMs were identified as singlets, DAPICD45+Ly6GC D11blo/−SIGLECFhiCD11chiCD206hiCD169hi. Data are mean ± s.e.m. c, Frequencies of labelled (red, tdTom+) or not labelled (grey, tdTom) cells within each cluster groups as defined in b in tumour-bearing mice. d, Lineage tracing experiment in Cx3cr1creER/+R26YFP mice. e, Fraction of labelled (green, YFP+) cells in the peripheral blood and lung of non-tumour-bearing mice (n= 8, pool of two independent experiments). Data are mean ± s.e.m. f, Frequency of labelled (green, YFP+) and non-labelled (grey, YFP) cells within each cluster groups as defined in b in KP tumour-bearing mice.
Extended Data Fig. 3 |
Extended Data Fig. 3 |. Longitudinal analysis of TRMs in NSCLC.
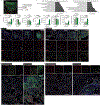
a, TRMs (red, CD206+) distribution in KP-GEMMs (green) 14 weeks (wks) after injection of adenovirus-SPC5Cre in KP mice. White dotted lines delimit the tumour area. Unpaired two-tailed Student’s t-test; *P = 0.020. CD206+ macrophage distribution was analysed in n = 4 tumour-bearing mice from one experiment. Data are mean ± s.e.m. b, Gene Ontology categories for ATAC–seq significant (P < 0.05) open (day 15) and closed (day 30) chromatin regions identified in KP-associated TRMs. c, Longitudinal analysis of CD45+ leukocytes, TRMs and Ly6Chi and Ly6Clo monocytes in naive (n = 5) and in day-15 (n = 5) and day-30 (n = 4) KP-bearing mice. One-way ANOVA with Tukey’s test. Data are mean ± s.e.m. TRMs were gated as singlets, live/deadGFPCD45+Ly6GCD64+M ERTK+CD2+CD169+CD206+Siglecf+; MDMs were gated as singlets, live/deadGFP CD45+Ly6GCD64+MERTK+CD2CD11bhiCD169SIGLECF. Lung monocytes were gated as CD45+CD11b+CX3CR1+Ly6Chi or Ly6Clo. d, Longitudinal imaging analysis of TRMs identified by the co-expression of CD206 (red) and SIGLECF (yellow) in the KP-GFP orthotopic model. KP tumour cells, green. White asterisks indicate CD206+SIGLECF macrophages. Yellow asterisks depict SIGLECF+CD206 leukocytes, which are also found in overt tumours and are most probably SIGLECF+ eosinophils. Scale bars, 50 μm (D5, D10 and D15); 100 μm (D25–30). Images are representative of one experiment; n = 3–5 mice; 2–3 tumours analysed per time point. e, Longitudinal imaging analysis of TRMs in the KP-GEMM model. Tumour cells are identified by positive staining with pan-cytokeratin in green. Images are representative of one experiment; 2–3 tumours analysed per mouse; 3 mice per time point. Scale bars, 50 μm. f, Immunohistochemistry converted to pseudofluorescence image of CD206 (red), CD10 (yellow) and cytokeratin (CK, green) staining in non-involved lung and NSCLC tissue. White asterisks indicate CD206+CD10+ TRMs. Scale bars, 250 μm (bottom images); 250 μm (top images). Images are representative of one experiment. g, Immunohistochemistry converted to pseudofluorescence image of CD206 (red), FABP4 (yellow) and cytokeratin (CK, green) staining in non-involved lung and NSCLC tissue. White asterisks indicate CD206+FABP4+ TRMs. Scale bars, 500 μm (left); 400 μm (right). Dotted lines delineate tumour border. Representative images from two non-involved lung and two NSCLC tumours. Images are representative of one experiment.
Extended Data Fig. 4 |
Extended Data Fig. 4 |. Bulk RNA-seq and ATAC–seq of KP TRMs.
a, Heat map of DEGs of TRMs in naive lungs, day-15 and day-30 KP tumours. Red indicates the most significant upregulated and blue the most significant downregulated gene transcripts (P < 0.05, log2-transformed fold change (log2FC) > 1 and log2FC < 1, respectively). TRMs were sorted as singlets, DAPICD45+Ly6G CD11blo/−CD64+MERTK+CD2+CD169+SIGLECFhiCD206+. b, Gene Ontology analysis of upregulated DEGs between naive and early KP-TRMs (day 15) (P < 0.05 and log2FC > 1). c, Number of peaks and heat map representing average ATAC–seq peaks (pks) unchanged (cluster 1), differentially closed (cluster 2) or opened (cluster 3) in TRMs at different times after KP injection. d, e, Representative tracks of significant TRM DEGs (P < 0.05) showing increased chromatin accessibility (dotted red lines) (d) or lower chromatin accessibility (e) in TRMs. Tracks are representative of three pooled mice examined over one single experiment. Data are mean ± s.e.m.
Extended Data Fig. 5 |
Extended Data Fig. 5 |. TRMs promote EMT and a pro-invasive signature in KP spheroids, whereas MDMs favour growth.
a, Venn diagrams for DEGs upregulated and downregulated in spheroids co-cultured with TRMs or bone marrow monocytes (BMMs). The number of DEGs uniquely controlled by TRMs or BMMs is shown in blue (TRMs) and red (BMMs). b, Gene Ontology (GO) analysis of significant DEGs (P < 0.05) with upregulated signature controlled by TRMs (blue) and by BMMs (red), respectively. c, Gating strategy for BALF (bronchoalveolar fluid) TRMs gated as CD45+CD11bloCD11c+SIGLECF+CD206+ CD169+ and purity quantification in n = 4 mice. BALF routinely showed around 85% pure TRMs among CD45+ leukocytes. d, Confocal representative images and quantification of E-cadherin (red), TWIST1 (white) and β-catenin (red) in KP spheroids cultured alone or with TRMs or BMMs. Scale bars, 5 μm (inset) and 25 μm. One-way ANOVA with Tukey’s test. Data are mean ± s.e.m. Two independent experiments. e, Bar graphs showing the expression (in transcripts per million, TPM) of EMT-signature selected genes in KP-spheroids alone, with TRMs or BMMs. Data are mean ± s.e.m. Results are representative of one experiment. f, Size quantification for KP oncospheres co-cultured with TRMs or BMMs. Data are mean ± s.e.m. Data are representative of two independent experiments. g, Quantification of the number of KP oncospheres in co-cultures with TRMs (blue) or BMMs (red) compared to KP alone in the presence of GM-CSF (light blue) or M-CSF (light red), respectively. Data are mean ± s.e.m. Data are representative of two independent experiments. h, Quantification of KP 3D-matrigel spheroids with invasive protrusions co-cultured with TRMs or BMMs and their respective controls. Data are mean ± s.e.m. Data are representative of two independent experiments. One-way ANOVA with Tukey’s test (fh). i, Bright-field microscopy images of the spheroids quantified in h. Scale bars, 100 μm. j, k, Number (j) and size (k) of KP oncospheres cultured alone or co-cultured with tumour-associated tTRMs or tMDMs. Results are representative of two independent experiments analysed using one-way ANOVA. Data are mean ± s.e.m. *P < 0.05, **P < 0.01, ****P < 0.0001.
Extended Data Fig. 6 |
Extended Data Fig. 6 |. Immune suppression is governed by TRMs in early KP tumours.
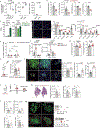
a, Frequency, CTLA-4 and CD73 MFI levels of Treg cells induced by tTRMs and tMDMs with naive CD62L+CD44CD4+ T cells (one-way ANOVA with Tukey’s test and two-tailed unpaired t-test). Two independent experiments. b, Frequency and phenotype of Treg cells in TRM-depleted mice at day 15 after KP injection. n = 5 mice per group. Two-tailed unpaired t-test; **P = 0.003, *P = 0.025; ***P = 0.0003 and ****P < 0.0001, respectively. c, Expression of Ccl17 and Tgfb1 in TRMs from naive mice (grey) and tumour-bearing mice (day 15 light green, day 30 dark green). Data from DEGs (P < 0.05 likelihood ratio test) list in Fig. 2d (see Supplementary Table 3). One experiment, n = 3 naive, n = 2 KP-TRM day 15 and n = 3 KP-TRM day 30 mice. d, Imaging of TRM-sufficient and deficient mice after instillation of diphtheria toxin. SIGLECF, green; CD206, red. Quantification of Ly6Chi/lo monocytes, neutrophils, MDMs and TRMs in wild-type or CD169-DTR lungs one week after the last dose of diphtheria toxin. n = 5 mice per group. Two-tailed unpaired t-test. TRMs were gated as singlets, live/de adCD45+Ly6GCD64+MERTK+CD2+CD169+SIGLECF+CD206+; MDMs as singlets, live/deadCD45+Ly6GCD64+MERTK+CD2CD11bhiCD169SIGLECF; monocytes as CD45+CD11b+CX3CR1+Ly6Chi or Ly6Clo (Ly6Chi and Ly6Clo, respectively); and neutrophils as live/deadCD45+CD11b+Ly6G+. e, Levels of CD169 in Tomato+ monocytes (CD45+CD11b+CX3CR1+) and MDMs (live/deadCD45+Ly6GCD64+MERTK+CD2CD11bhiSIGLECF) in naive and two-week KP lesions from Ms4a3-tdTom reporter mice. n = 3 mice per group. Two-way ANOVA with Tukey’s multiple comparisons test; ns, not significant. f, Frequencies of MDMs in wild-type and CD169-DTR lungs after DT treatment with diphtheria toxin in naive mice and KP lesions (two weeks). n = 5 per genotype for naive mice and n = 3 per genotype for the KP tumour group. Two-way ANOVA with Tukey’s multiple comparisons test. g, Quantification of Treg cells in spleen and lymph nodes of tumour-bearing mice (day 15) in WT + DT (black) and CD169-DTR + DT mice (red). n = 6 mice per group. Unpaired two-tailed t-test. h, Percentage of KP cells from lungs of wild-type or CD169-DTR mice treated with diphtheria toxin, 24 h after KP injection. n = 6 mice per group. Two-tailed unpaired t-test. i, Image analysis of Ki67+ and CC3+ KP cells in day-15 lesions, and p27+ KP cells in day-5 lesions of WT + DT and CD169-DTR + DT mice. Asterisks show positive KP cells. One-tailed unpaired t-test. n = 3 WT + DT and n = 4 CD169-DTR + DT for Ki67 and CC3; n = 3 WT + DT and n = 4 CD169-DTR + DT for p27. Two to three independent experiments. Scale bars, 25 μm (main images); 10 μm (inset). Data are mean ± s.e.m. (ai). j, Diphtheria toxin treatment and KP injections in wild-type or CD169-DTR mice. k, Tumour burden in wild-type or CD169-DTR mice that were TRM-depleted after tumour implantation. l, Quantification of Treg cells, IFNγ+TNF+CD8+ effector cells and ratio of CD8/Treg cells in mice from k. Effector T cells were gated as singlets, DAPICD45+TCR+CD8+; Treg cells as singlets, DAPICD45+TCR+CD4+FOXP3+. n = 5 WT + DT and n = 7 CD169-DTR + DT mice. Three independent experiments. Data are mean ± s.e.m; two-tailed unpaired t-test. (k, l). m, Imaging and quantification of infiltrating FOXP3+ Treg cells (top) and CD3+ T cells (bottom) in WT + DT or CD169-DTR + DT mice at days 12 and 15 after KP injection. Two-tailed unpaired t-test. Data are mean ± s.e.m. Two independent experiments. Scale bar, 100 μm.
Extended Data Fig. 7 |
Extended Data Fig. 7 |. TRMs modulate T cell effector function in an antigen-independent manner.
a, Scheme of OT-I and OT-II adoptive transfer experiments in B16-F10/OVA wild-type and CD169-DTR mice. b, Relative quantification of OT-I T cells in the lungs and tumour-draining lymph nodes (tdLN). OT-I T cells were gated as viable, CD45.1+TCR+CD8+. n = 4—5 mice. Data are representative of two independent experiments. c, Quantification of OT-I cells in the tumours of mice in b. CD45.1+ OT-I T cells were quantified in 7–8 tumours from mice in b. n= 7 WT + DT and N = 8 CD169-DTR + DT from one experiment. Scale bar, 50 μm. d, Quantification of OT-II cells in the tumours of mice in b. OT-II T cells were gated as viable, CD45.1+TCR+CD4+. n = 5–8 mice per group. Data are representative of one experiment. Data are mean ± s.e.m; unpaired two-tailed t-test (bd). e, Scheme of the contribution of the TRM compartment and MDMs to tumour progression. This scheme was created with BioRender.com.
Fig. 1 |
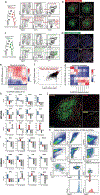
Fig. 1 |. scRNA-seq of lineage-traced blood-derived macrophages reveals two ontogenically distinct populations of macrophages in NSCLC lesions.
a, scRNA-seq data of human macrophage and monocyte clusters from tumour samples and non-involved lung samples from 35 patients with early-stage NSCLC. Group I and group II were annotated as macrophage clusters, group III as CD14+ monocytes and group IV as non-classical monocytes. Heat maps show unique molecular identifier(UMI) counts of selected genes in myeloid clusters after evenly down-sampling to 2,000 UMIs per cell. b, scRNA-seq data of macrophages and monocytes in two pooled naive and two pooled tumour-bearing mice in an orthotopic mouse model of NSCLC in which mice were injected intravenously with KP cells genetically labelled with GFP. Clusters are down-sampled to show a maximum of 200 cells per cluster. c, Orthology signature in human (h) and mouse (m) for NSCLC tumour-associated macrophages and monocytes (groups I–IV).
Fig. 2 |
Fig. 2 |. TRMs localize in close proximity to tumour cells after seeding and enhance their antigen presentation and tissue remodelling programs in response to tumour cues.
a, Frequency of scRNA-seq groups in lungs from naive and tumour-bearing mice (left, n = 4 experiments with two pooled naive and two pooled tumour-bearing mice per experiment) and in human NSCLC tumours and adjacent non-involved lung tissue (right, 19 paired non-involved and tumour). The cell-type frequencies observed in the scRNA-seq mouse samples were proportionally weighted according to the labelling frequencies determined from fluorescence-activated cell sorting (FACS). Unpaired two-tailed t-test. NS, not significant. Data are mean ± s.e.m. b, Longitudinal analysis in an orthotopic mouse model of NSCLC (left). Graph (middle) shows tumour growth over time, and images (right) show tumour foci stained with haematoxylin and eosin (n = 3 day 5; n = 4 day 10; n= 4 day 15; n = 3 day 25; n = 8 day 30). Scale bar, 10 mm. c, Left, confocal imaging of tumour lesions (KP, green) and TRMs (MRC1, red) at different time points after the injection of KP cells. Scale bar, 50 μm (main images, day 5, 10 and 15); 100 μm (main images, days 25 and 30); 10 μm (insets). Right, quantification of the distribution of TRMs in advanced tumour lesions (day 30; n = 4 mice, 10 tumours). Unpaired two-tailed t-test; *P < 0.05. Data are mean ± s.e.m.
Fig. 3 |
Fig. 3 |. TRMs induce NSCLC cells to undergo EMT and promote tumour cell invasiveness.
a, Scheme of KP spheroids co-cultured with TRMs or bone marrow monocytes (BMMs). b, Heat map showing z-scores of uniquely DEGs in KP spheroids with TRMs. Upregulated genes are shown in red (P < 0.05, log2(expression in TRMs/expression in KP spheroids) > 1. KP cells were sorted as singlets, DAPICD45GFP+. c, Heat map showing z-scores of uniquely DEGs in KP spheroids with bone marrow monocytes. d, Left, live spheroid imaging. Right, the GFP signal was quantified over time and the area of dispersed GFP objects (cells) was plotted. One-way ANOVA; **P < 0.01, ****P < 0.0001. Data are mean ± s.e.m. Scale bar, 200 μm. Results are representative of five pooled independent experiments. e, Representative confocal images of E-cadherin (red) and bright-field images (for invasive protrusions) of KP alone or with tumour-associated TRMs (tTRMs) or tumour-associated MDMs (tMDMs). Scale bars, 25 μm (fluorescence images; top); 100 μm (bright-field images; bottom). Images are representative of two independent experiments with similar results. f, Frequency of E-cadherinhi cells per spheroid in KP cells alone or with tTRMs or tMDMs. One-way ANOVA with Tukey’s test for multiple comparisons. Data are mean ± s.e.m. and are representative of two pooled independent experiments. g, Frequency of invasive spheroids in KP cells alone or with tTRMs or tMDMs. One-way ANOVA. Data are mean ± s.e.m. and are representative of two pooled independent experiments. h, Right, representative images of a transwell migration assay of KP cells (green, nuclei in blue (DAPI)) with control conditioned medium (CM), tTRM conditioned medium and tMDM conditioned medium. Scale bar, 100 μm. Left, the number of migrated GFP+DAPI+ cells per field of view (FOV) was quantified after 18 h. One-way ANOVA. Data are mean ± s.e.m. and are representative of two independent experiments. i, Left, confocal imaging of TWIST1 (red) and ZEB1 (red) GFP-expressing KP cells in TRM-sufficient (wild type; WT) and TRM-deficient (CD169-DTR) mice, five days after injection with diphtheria toxin (DT). Orange indicates co-expression of TWIST1 or ZEB1 and GFP. Right, the frequency of TWIST1+ and ZEB1+ KP cells is quantified for WT + DT (black) and CD169-DTR + DT (red). Unpaired one-tailed t-test. Data are mean ± s.e.m. and are representative of two independent experiments.
Fig. 4 |
Fig. 4 |. Depletion of TRMs before tumour engraftment leads to reduced tumour burden and enhances T cell infiltration.
a, Number (left) and frequency (right) of Treg cells in naive and KP lungs (left: n = 4 naive, n = 9 day 15 KP, n = 4 day 30 KP; right (proliferative Treg cells): n = 4 mice per time). Treg cells: DAPICD45+TCR+CD4+FOXP3+; proliferative Treg cells: Ki67+DAPICD45+ TCR+CD4+CD25+. One-way ANOVA with Bonferroni’s test; left, NS, P = 0.472, **P = 0.0037; right, **P = 0.0011, ***P < 0.0001. Data are mean ± s.e.m. b, Temporal location of TRMs (MRC1+, blue) and Treg cells (FOXP3+, magenta). KP cells are shown in green. Scale bar, 30 μm. Images are representative of a single longitudinal experiment. c, Quantification of Treg cells from b. Seven to ten FOVs per time point. One-way ANOVA with Bonferroni’s test; ****P < 0.0001. Data are mean ± s.e.m. d, Mean distance of Treg cells to TRMs (at day 15). Scale bar, 15 μm. e, Depletion of TRMs using intranasal (i.n.) instillation of diptheria toxin (days 0 and 3) and orthotopic intravenous (i.v.) injection of KP cells. f, Tumour burden in wild-type (black) or TRM-depleted (CD169-DTR; red) mice treated with diphtheria toxin (n = 9 WT + DT, n = 10 CD169-DTR + DT. Unpaired two-tailed t-test; **P = 0.0028, *P = 0.0345, NS, P = 0.46. Data are mean ± s.e.m. Scale bar, 2 mm. g, Quantification of TCR+CD4+FOXP3+ Treg cells, TCR+ IFNγ+TNF+CD8+ cells and ratio of CD8+ T cells/Treg cells in tumour-bearing wild-type (black) or TRM-depleted (red) mice. Unpaired two-tailed t-test; *P = 0.041 (percentage TCR+CD4+FOXP3+ Treg cells), *P = 0.016 (TCR+IFNγ+TNF+CD8+ cells), *P = 0.022 (ratio CD8+ T cells/Treg cells). Data are mean ± s.e.m. from two independent experiments. h, Imaging and quantification of tumour-infiltrating Treg cells and CD3+ T cells in TRM-sufficient (black) and TRM-deficient (red) mice (n = 9 mice). White dotted lines mark the tumour area. Unpaired two-tailed t-test; *P = 0.041 (FOXP3+ Treg cells), *P = 0.028 (CD3+ T cells). Data are mean ± s.e.m. Two independent experiments. i, Tumour burden in B16-F10/OVA mice (n = 5 WT + DT (black), n = 7 CD169-DTR + DT (red)). Unpaired two-tailed t-test; ***P = 0.0003. Data are mean ± s.e.m. from two independent experiments. Scale bar, 1 mm. j, Relative frequency of CD4+ cells, mean fluorescent intensity (MFI) of PD-1 in CD4+ and CD8+ T cells, and quantification of TNF+IFNγ+ cells in CD4+and CD8+ T cells in B16-F10-BFP/OVA wild-type (black) and TRM-depleted (red) mice (n = 5 and n = 7, respectively). Unpaired two-tailed t-test; ****P < 0.0001, **P = 0.001, *P = 0.0375. Data are mean ± s.e.m. Two independent experiments. k, Quantification of tumour-infiltrating Treg cells and CD4+ and CD8+ T cells in the B16-OVA model (n = 5 WT + DT, n = 7 CD169-DTR + DT). Unpaired two-tailed t-test; **P = 0.0068, *P = 0.025, NS, P = 0.2887. Data are mean ± s.e.m. Two independent experiments.

Comment in

References

    1. Lavin Y, Mortha A, Rahman A & Merad M Regulation of macrophage development and function in peripheral tissues. Nat. Rev. Immunol. 15, 731–744 (2015). - PMC - PubMed
    1. Mantovani A, Marchesi F, Malesci A, Laghi L & Allavena P Tumour-associated macrophages as treatment targets in oncology. Nat. Rev. Clin. Oncol. 14, 399–416 (2017). - PMC - PubMed
    1. Ginhoux F et al. Fate mapping analysis reveals that adult microglia derive from primitive macrophages. Science 330, 841–845 (2010). - PMC - PubMed
    1. Hashimoto D et al. Tissue-resident macrophages self-maintain locally throughout adult life with minimal contribution from circulating monocytes. Immunity 38, 792–804 (2013). - PMC - PubMed
    1. Schulz C et al. A lineage of myeloid cells independent of Myb and hematopoietic stem cells. Science 336, 86–90 (2012). - PubMed

Publication types