. 2021 May 31:15:622870.
doi: 10.3389/fncel.2021.622870. eCollection 2021.

Towards a Bio-Inspired Real-Time Neuromorphic Cerebellum

Affiliations

Towards a Bio-Inspired Real-Time Neuromorphic Cerebellum

Petruţ A Bogdan et al. Front Cell Neurosci. .

Abstract

This work presents the first simulation of a large-scale, bio-physically constrained cerebellum model performed on neuromorphic hardware. A model containing 97,000 neurons and 4.2 million synapses is simulated on the SpiNNaker neuromorphic system. Results are validated against a baseline simulation of the same model executed with NEST, a popular spiking neural network simulator using generic computational resources and double precision floating point arithmetic. Individual cell and network-level spiking activity is validated in terms of average spike rates, relative lead or lag of spike times, and membrane potential dynamics of individual neurons, and SpiNNaker is shown to produce results in agreement with NEST. Once validated, the model is used to investigate how to accelerate the simulation speed of the network on the SpiNNaker system, with the future goal of creating a real-time neuromorphic cerebellum. Through detailed communication profiling, peak network activity is identified as one of the main challenges for simulation speed-up. Propagation of spiking activity through the network is measured, and will inform the future development of accelerated execution strategies for cerebellum models on neuromorphic hardware. The large ratio of granule cells to other cell types in the model results in high levels of activity converging onto few cells, with those cells having relatively larger time costs associated with the processing of communication. Organizing cells on SpiNNaker in accordance with their spatial position is shown to reduce the peak communication load by 41%. It is hoped that these insights, together with alternative parallelization strategies, will pave the way for real-time execution of large-scale, bio-physically constrained cerebellum models on SpiNNaker. This in turn will enable exploration of cerebellum-inspired controllers for neurorobotic applications, and execution of extended duration simulations over timescales that would currently be prohibitive using conventional computational platforms.

Keywords: SpiNNaker; cerebellum model; communication profiling; large scale simulation; neuromorphic computing; spiking neural network.


Conflict of interest statement

The authors declare that the research was conducted in the absence of any commercial or financial relationships that could be construed as a potential conflict of interest.

Figures

Figure 1
Figure 1
3D model architecture of the cerebellum. Reproduced from Casali et al. (2019) with permission.
Figure 2
Figure 2
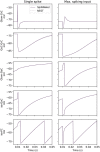
Side-by-side membrane potential traces under two experimental conditions. The experiment tests each cell type under the influence of a single spike from each possible afferent projection, a subset of which is presented here. The effect of the single spike is also scaled by the empirically recorded maximum contribution of each individual projection to single post-synaptic neurons (labeled here as “max. spiking input”).
Figure 3
Figure 3
Single GrC behavior in “low” and “high” input conditions for SpiNNaker (solid) and NEST (dotted) simulations. (Left) Traces extracted from the single cell experiment. (Right) Traces extracted from a single GrC embedded in the large-scale model where the pre-stimulation period corresponds to the “low” activity case, and the stimulation period corresponds to the “high” activity case.
Figure 4
Figure 4
Spike raster and peristimulus time histogram (PSTH) comparison. (Left) SpiNNaker. (Right) NEST. The bin width used for the PSTH is 0.1 ms. The highlighted area corresponds to the stimulation period for each cell type. NID, neuron ID.
Figure 5
Figure 5
(A) Firing rate, (B) inter-spike interval (ISI), (C) coefficient of variation (CV), and (D) correlation coefficient of the spike trains for each population's neurons simulated on SpiNNaker (boxplots on the left) and NEST (boxplots on the right). The correlation coefficient is computed over the stimulation period on binned spike times with a bin width of 5 ms. Deep cerebellar nucleus cell (DCNC) is not included in the (A) excited firing rates and (D) correlation coefficient plots as it does not produce any spikes during the stimulation period, which those plots cover. The (B) ISI and (C) CV cover the entire simulation.
Figure 6
Figure 6
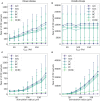
Relationship between input firing rate and maximum number of packets received by each core in a timestep. Input activity is controlled in two ways: a fixed set of Glomeruli is activated at a variety of firing rates (fpeak)—(A,B)—or a variable set of glomeruli (controlled by the size of the stimulus selection radius) is activated at a fixed rate (C,D). Two input stimulus encodings are used: Poisson input (left) and periodic input (right). The first row compares the maximum number of spikes received in a timestep for all other population in the model when varying the input firing for a fixed subset of Gloms, while the second row compares the same metric when the a fixed firing rate is maintained for a variable subset of Gloms.
Figure 7
Figure 7
Population placement and statistics on three-board machines. The Cerebellum model requires ~1,583 cores for the current number of neurons per core (101 chips spread over three boards). For identical partitioning and placements with Poisson (A) and periodic (B) stimuli (red outline delimits the full extent of chips on the three-board system), the figure shows number of packets the routers dropped (C,D), total number of external packets (E,F), total number of local packets (G,H), the maximum number of direct memory accesses (DMAs) in a timestep (I,J), and the maximum number of processing pipeline restarts (K,L). White squares within the 3-machine system used here correspond either to cores not active during the current simulation or cores that are permanently deactivated due to manufacture defects.

References

    1. Abadia I., Naveros F., Garrido J. A., Ros E., Luque N. R. (2019). On robot compliance: a cerebellar control approach. IEEE Trans. Cybern. 51, 2476–2489. 10.1109/TCYB.2019.2945498 - DOI - PubMed
    1. Albada S. J. V., Rowley A. G., Senk J., Hopkins M., Schmidt M., Stokes A. B., et al. . (2018). Performance comparison of the digital neuromorphic hardware SpiNNaker and the neural network simulation software NEST for a full-scale cortical microcircuit model. Front. Neurosci. 12:291. 10.3389/fnins.2018.00291 - DOI - PMC - PubMed
    1. Andersen B. B., Gundersen H. J. G., Pakkenberg B. (2003). Aging of the human cerebellum: a stereological study. J. Compar. Neurol. 466, 356–365. 10.1002/cne.10884 - DOI - PubMed
    1. Antonietti A., Casellato C., D'Angelo E., Pedrocchi A. (2017). Model-driven analysis of eyeblink classical conditioning reveals the underlying structure of cerebellar plasticity and neuronal activity. IEEE Trans. Neural Netw. Learn. Syst. 28, 2748–2762. 10.1109/TNNLS.2016.2598190 - DOI - PubMed
    1. Antonietti A., Martina D., Casellato C., D'Angelo E., Pedrocchi A. (2019). Control of a humanoid NAO robot by an adaptive bioinspired cerebellar module in 3D Motion tasks. Comput. Intell. Neurosci. 2019. 10.1155/2019/4862157 - DOI - PMC - PubMed

LinkOut - more resources