

Extreme prematurity and sepsis strongly influence frequencies and functional characteristics of circulating γδ T and natural killer cells
- PMID: 34136218
- PMCID: PMC8192243
- DOI: 10.1002/cti2.1294
Extreme prematurity and sepsis strongly influence frequencies and functional characteristics of circulating γδ T and natural killer cells
Abstract
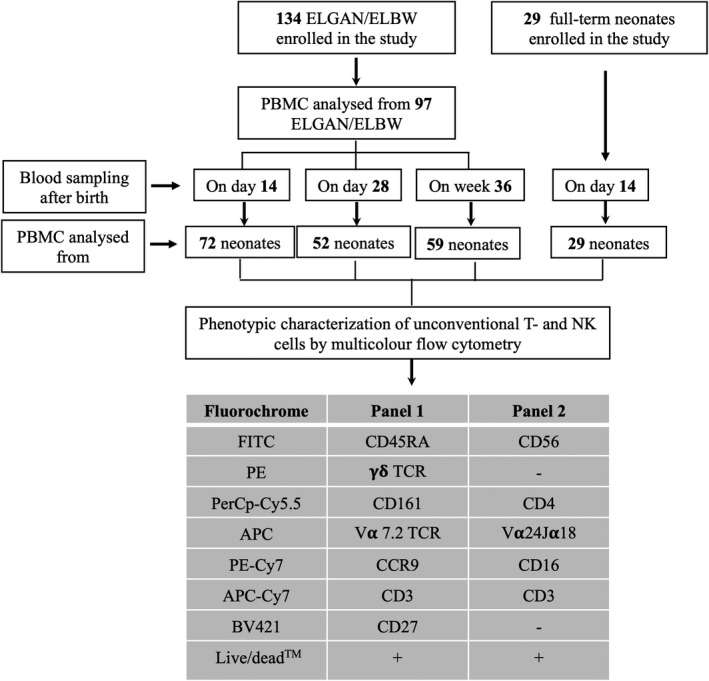
Objectives: Extremely low gestational age neonates with extremely low birthweight (ELGAN/ELBW) are highly susceptible to infection. This is linked to their relatively immature immune system which is not yet fully compatible with an extra-uterine environment. Here, we performed a longitudinal characterisation of unconventional T and natural killer (NK) cells in ELGAN/ELBW during their first months of life.
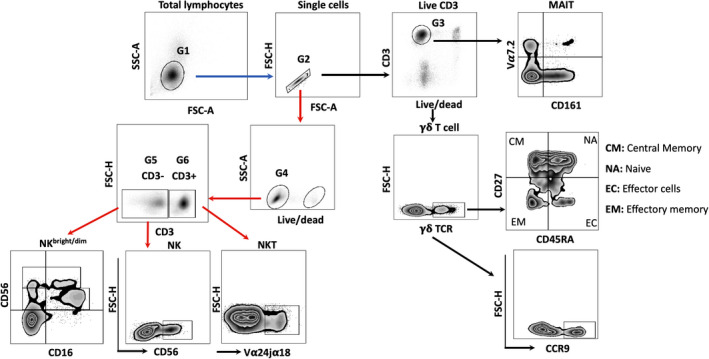
Methods: Peripheral blood mononuclear cells were collected from 97 ELGAN/ELBW at 14 and 28 days of life and at a time point corresponding to postmenstrual week 36 + 0. γδ T-cell, NKT-cell, mucosa-associated invariant T-cell and NK cell frequencies and characteristics were analysed by flow cytometry. As control, cells from 14-day-old full-term (FT) infants were included.
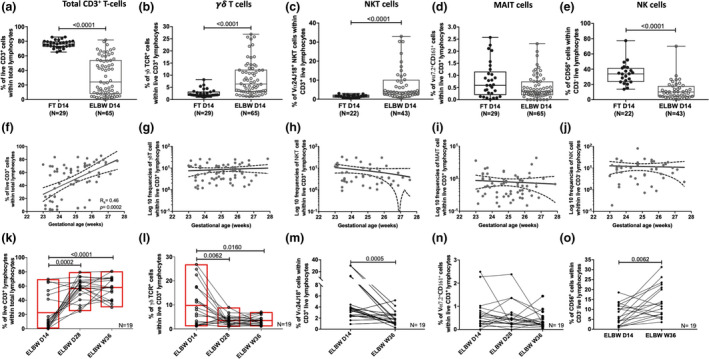
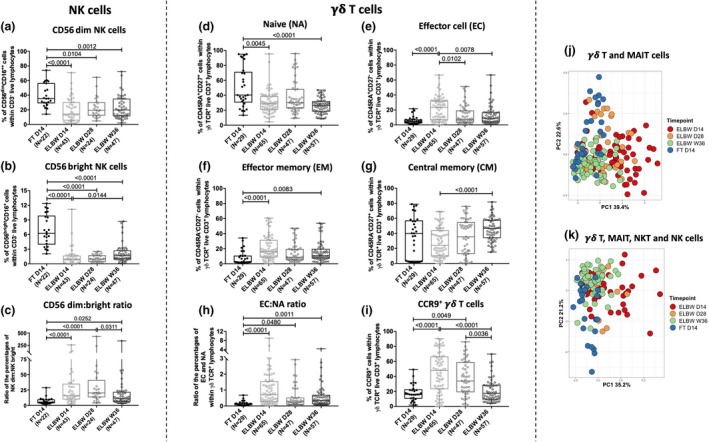
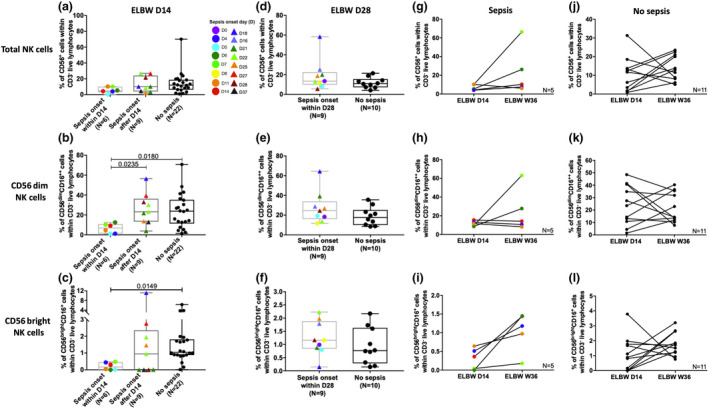
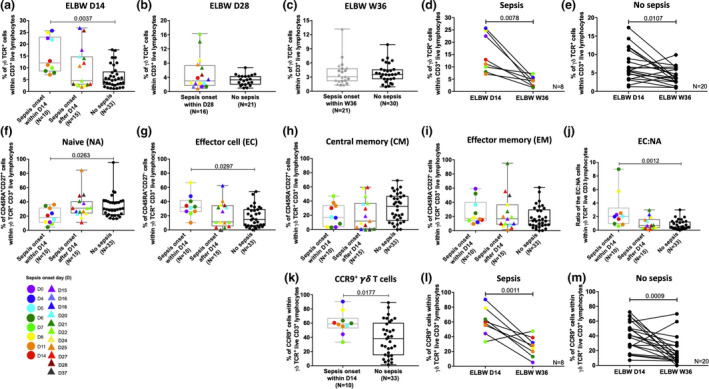
Results: Extreme prematurity had significant bearing on γδ T-cell and NK cell frequencies and characteristics. ELGAN/ELBW had significantly higher proportions of γδ T cells that were skewed towards effector and effector memory phenotypes, characteristics that were maintained throughout the study period. Expression of the gut homing receptor CCR9 was also more common in γδ T cells from ELGAN/ELBW. Conversely, NK cell frequencies were markedly lower and skewed towards a cytotoxic phenotype in the ELGAN/ELBW group at 14 days of age. Culture-proven sepsis with an onset during the first 14 days after birth further manifested these differences in the γδ T- and NK cell populations at 14 days of age.
Conclusion: Prematurity strongly influences the levels of γδ T and NK cells, in particular in cases where sepsis debuts during the first 2 weeks of life.
Keywords: extreme preterm; gestational age; natural killer cells; neonatal immunity; sepsis; unconventional T cells.
© 2021 The Authors. Clinical & Translational Immunology published by John Wiley & Sons Australia, Ltd on behalf of Australian and New Zealand Society for Immunology, Inc.
Conflict of interest statement
Thomas Abrahamsson has received honoraria for lectures and a grant for the present trial from Biogaia AB. Maria C Jenmalm has also received honoraria for lectures from Biogaia AB. Eva Sverremark‐Ekström has received honoraria for lectures and a grant for another research project from BioGaia AB. The other authors have no conflict of interest to declare.
Figures
Similar articles
-
Extremely Preterm Infants Have Significant Alterations in Their Conventional T Cell Compartment during the First Weeks of Life.J Immunol. 2020 Jan 1;204(1):68-77. doi: 10.4049/jimmunol.1900941. Epub 2019 Dec 4. J Immunol. 2020. PMID: 31801814 Free PMC article. Clinical Trial.
-
Characterization of the γδ T-cell compartment during infancy reveals clear differences between the early neonatal period and 2 years of age.Immunol Cell Biol. 2020 Jan;98(1):79-87. doi: 10.1111/imcb.12303. Epub 2019 Dec 1. Immunol Cell Biol. 2020. PMID: 31680329 Free PMC article.
-
High prevalence of abnormal motor repertoire at 3 months corrected age in extremely preterm infants.Eur J Paediatr Neurol. 2016 Mar;20(2):236-242. doi: 10.1016/j.ejpn.2015.12.009. Epub 2015 Dec 30. Eur J Paediatr Neurol. 2016. PMID: 26786751
-
Expression of cytotoxic proteins in peripheral T-cell and natural killer-cell (NK) lymphomas: association with extranodal site, NK or Tgammadelta phenotype, anaplastic morphology and CD30 expression.Leuk Lymphoma. 2000 Jul;38(3-4):317-26. doi: 10.3109/10428190009087022. Leuk Lymphoma. 2000. PMID: 10830738 Review.
-
Positive & Negative Roles of Innate Effector Cells in Controlling Cancer Progression.Front Immunol. 2018 Sep 21;9:1990. doi: 10.3389/fimmu.2018.01990. eCollection 2018. Front Immunol. 2018. PMID: 30298063 Free PMC article. Review.
Cited by
-
Increased Expression of Anaphylatoxin C5a-Receptor-1 in Neutrophils and Natural Killer Cells of Preterm Infants.Int J Mol Sci. 2023 Jun 19;24(12):10321. doi: 10.3390/ijms241210321. Int J Mol Sci. 2023. PMID: 37373467 Free PMC article.
-
Effects of extremely preterm birth on cytokine and chemokine responses induced by T-cell activation during infancy.Clin Transl Immunology. 2024 May 10;13(5):e1510. doi: 10.1002/cti2.1510. eCollection 2024. Clin Transl Immunology. 2024. PMID: 38737447 Free PMC article.
-
Impact of Extreme Prematurity, Chorioamnionitis, and Sepsis on Neonatal Monocyte Characteristics and Functions.J Innate Immun. 2024;16(1):470-488. doi: 10.1159/000541468. Epub 2024 Sep 14. J Innate Immun. 2024. PMID: 39278208 Free PMC article. Clinical Trial.
-
Role of innate T cells in necrotizing enterocolitis.Front Immunol. 2024 Feb 8;15:1357483. doi: 10.3389/fimmu.2024.1357483. eCollection 2024. Front Immunol. 2024. PMID: 38390341 Free PMC article. Review.
-
γδ T cell profiling in a cohort of preterm infants reveals elevated frequencies of CD83+ γδ T cells in sepsis.J Exp Med. 2024 Jul 1;221(7):e20231987. doi: 10.1084/jem.20231987. Epub 2024 May 16. J Exp Med. 2024. PMID: 38753245 Free PMC article.
References
LinkOut - more resources
Full Text Sources
Research Materials