. 2021 May 31:9:657166.
doi: 10.3389/fcell.2021.657166. eCollection 2021.

Bursa-Derived Cells Show a Distinct Mechano-Response to Physiological and Pathological Loading in vitro

Affiliations

Bursa-Derived Cells Show a Distinct Mechano-Response to Physiological and Pathological Loading in vitro

Franka Klatte-Schulz et al. Front Cell Dev Biol. .

Abstract

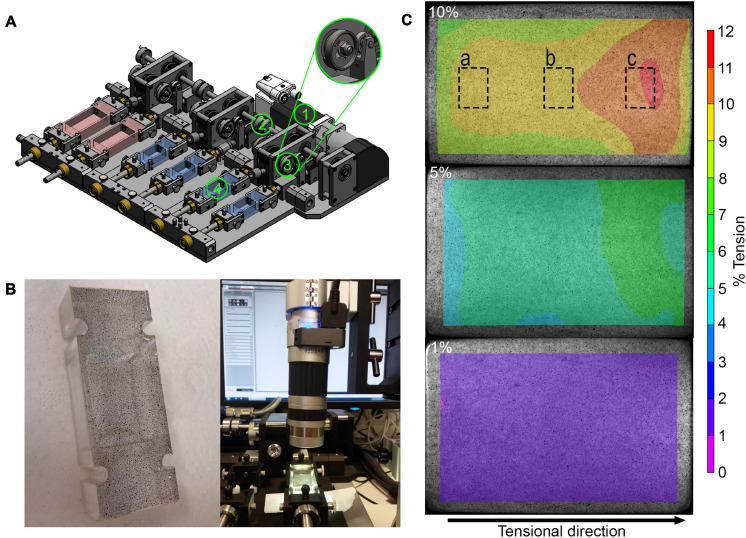
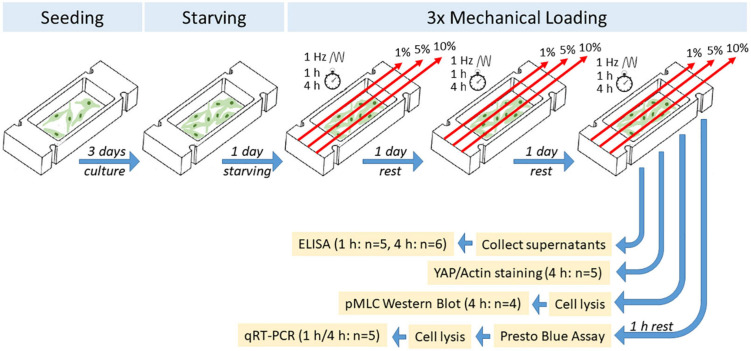
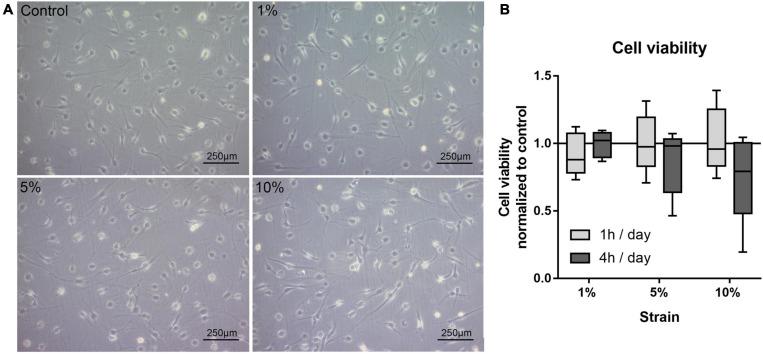
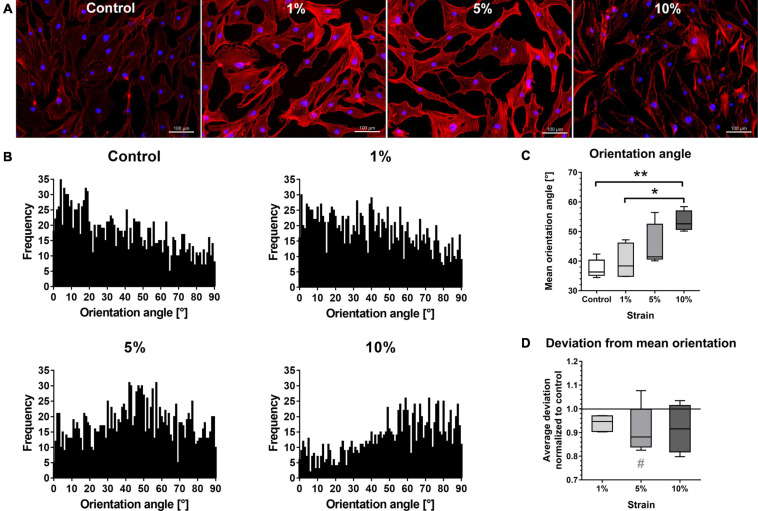
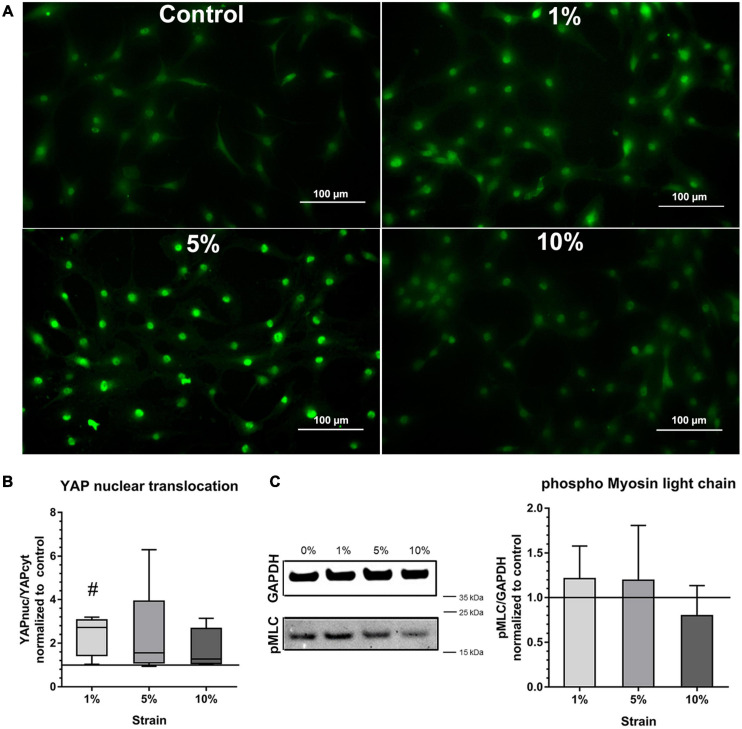
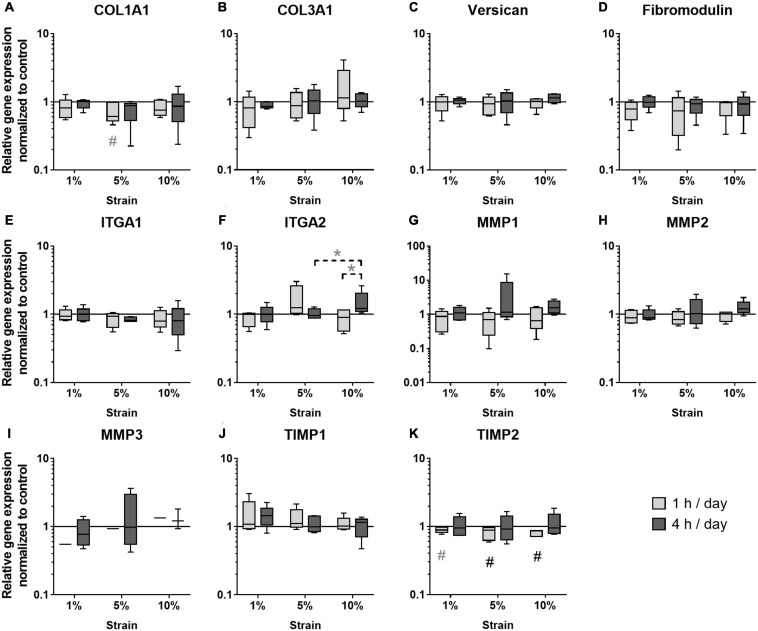
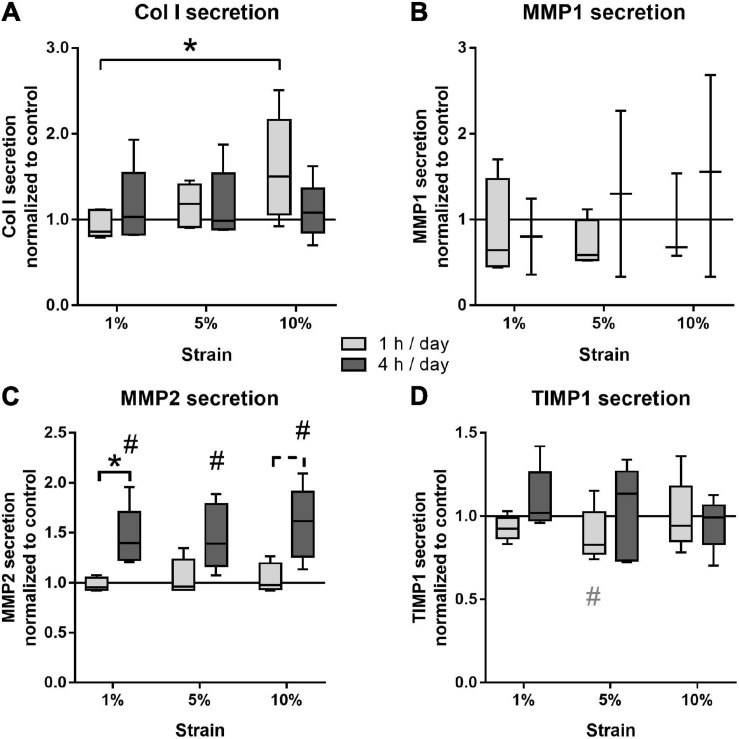
The mechano-response of highly loaded tissues such as bones or tendons is well investigated, but knowledge regarding the mechano-responsiveness of adjacent tissues such as the subacromial bursa is missing. For a better understanding of the physiological role of the bursa as a friction-reducing structure in the joint, the study aimed to analyze whether and how bursa-derived cells respond to physiological and pathological mechanical loading. This might help to overcome some of the controversies in the field regarding the role of the bursa in the development and healing of shoulder pathologies. Cells of six donors seeded on collagen-coated silicon dishes were stimulated over 3 days for 1 or 4 h with 1, 5, or 10% strain. Orientation of the actin cytoskeleton, YAP nuclear translocation, and activation of non-muscle myosin II (NMM-II) were evaluated for 4 h stimulations to get a deeper insight into mechano-transduction processes. To investigate the potential of bursa-derived cells to adapt their matrix formation and remodeling according to mechanical loading, outcome measures included cell viability, gene expression of extracellular matrix and remodeling markers, and protein secretions. The orientation angle of the actin cytoskeleton increased toward a more perpendicular direction with increased loading and lowest variations for the 5% loading group. With 10% tension load, cells were visibly stressed, indicated by loss in actin density and slightly reduced cell viability. A significantly increased YAP nuclear translocation occurred for the 1% loading group with a similar trend for the 5% group. NMM-II activation was weak for all stimulation conditions. On the gene expression level, only the expression of TIMP2 was down-regulated in the 1 h group compared to control. On the protein level, collagen type I and MMP2 increased with higher/longer straining, respectively, whereas TIMP1 secretion was reduced, resulting in an MMP/TIMP imbalance. In conclusion, this study documents for the first time a clear mechano-responsiveness in bursa-derived cells with activation of mechano-transduction pathways and thus hint to a physiological function of mechanical loading in bursa-derived cells. This study represents the basis for further investigations, which might lead to improved treatment options of subacromial bursa-related pathologies in the future.

Keywords: bursa-derived cells; matrix remodeling; mechanical stimulation; mechano-transduction; subacromial bursa.


Conflict of interest statement

The authors declare that the research was conducted in the absence of any commercial or financial relationships that could be construed as a potential conflict of interest.

Figures

FIGURE 1
FIGURE 1
Analyses of mechanical straining in the stretching device: (A) Schematic overview of mechanical stretching device. The motor (1) generates a torque, which is transmitted to the rotation axis (2) and then to the eccentric disk (3), which ensures that the flexible silicone dish (4) is stretched. The stretching device also allows to stretch small and large silicon dishes (red). (B) Speckled base of the silicon dish (left) and light microscopic evaluation of speckled base of silicon dish (right). (C) Exemplary results after speckle analysis of the base at 10, 5, and 1% strain showing strain distribution across the cell dish area. The dashed boxes show the approximate areas where the images were taken for analysis of cell orientation and YAP nuclear translocation.
FIGURE 2
FIGURE 2
Schematic overview of experimental setup of mechanical loading of bursa-derived cells.
FIGURE 3
FIGURE 3
(A) Representative images of bursa-derived cell morphology taken from control cells and mechanically loaded cells from area b (middle) in the silicon dish. Cells were stimulated for 4 h per day at 1, 5, and 10% strain with 1 Hz. Scale bar: 250 μm. (B) Cell viability of bursa-derived cells after 1 and 4 h of mechanical loading per day. The values are given as fold to the unstimulated control. Statistics: Dunn’s multiple comparison test for n = 5 individual donors.
FIGURE 4
FIGURE 4
Morphology and orientation of bursa-derived cells stimulated at 3 days for 4 h per day at 1 Hz with 1, 5, and 10% strain compared to the unstimulated control. (A) Representative z-stack images of Phalloidin and DAPI staining of actin filaments for all loading and control conditions. Representative images derived from area b (middle) in the silicon dish. Left to right = tensional direction. Scale bar: 100 μm. (B) Total frequencies of the orientation angles measured using the FibrilTool macro from images taken at three positions (a, b, c) in the silicon dish from five individual donors (0° = loading direction; 90° = perpendicular to the loading direction). (C) Mean orientation angles of all loading conditions calculated from the mean orientation of each individual image and given as absolute degree values. (D) Average deviation from mean orientation angle calculated from the mean values of each individual image and given as fold to the unstimulated control (line at 1). Statistics: Dunn’s multiple comparison test for n = 5 individual donors. A spanning line with asterix marks significant differences with a p-value of <0.05 and a spanning line with two asterix marks significant difference with a p-value of <0.01. The gray # indicates trend significant differences with a p-value of < 0.1.
FIGURE 5
FIGURE 5
Mechano-transduction pathways in bursa-derived cells stimulated at 3 days for 4 h per day at 1 Hz with 1, 5, and 10% strain compared to the unstimulated control. (A) Exemplary images of YAP fluorescence staining for all loading and control conditions. These exemplary images resulted from bursa-derived cells with highest Yap nuclear translocation in the 1 and 5% group in the study. Exemplary images derived from area b (middle) in the silicon dish. Left to right = tensional direction. Scale: 100 μm. (B) YAP nuclear translocation calculated as the ratio between the YAP-positive nucleus area and the YAP-positive cytoplasm area and given as fold to the unstimulated control (line at 1). Statistics: Dunn’s multiple comparison test for n = 5 individual donors. The # indicates significant differences with a p < 0.05. (C) Representative images of pMLC bands and GAPDH reference bands from Western blot analysis. Images are cropped and original images are provided in Supplementary Materials. Images were taken at a wavelength of 800 nm using the Odyssey V3.0 software with a resolution of 42 μm and an intensity of 4 for GAPDH and 8 for pMLC. The bar graphs show pMLC quantification relative to GAPDH and given as fold to the unstimulated control (line at 1). Statistics: Dunn’s multiple comparison test for n = 4 (n = 3 for 5% group) individual donors.
FIGURE 6
FIGURE 6
Gene expression of ECM markers (A–D), integrins (E,F), MMPs (G–I), and TIMPs (J,K) in bursa-derived cells after 1 h and 4 h of mechanical loading per day for 3 days at 1 Hz. Values are given as normalized expression to the housekeeping gene HPRT and the unstimulated control (line at 1) using an efficiency corrected formula. Statistics: Dunn’s multiple comparison test for n = 5 individual donors. The # marks significant differences to the unstimulated control group with a p < 0.05. A dashed spanning line with gray asterix or a gray # marks differences with a p-value of < 0.1.
FIGURE 7
FIGURE 7
Protein secretion of Col I (A), MMP1 (B), MMP2 (C), and TIMP1 (D) from bursa-derived cells after 1 and 4 h of mechanical loading per day for 3 days at 1 Hz. The values are given as fold to the unstimulated control cells (line at 1). MMP1 secretion was below the detection limit in one or two of five donors for the 1 and 4 h stimulations, respectively. MMP3 secretion was below the detection limit in all samples. Statistics: Dunn’s multiple comparison test for n = 5 individual donors. A spanning line with asterisk or a # marks significant difference with a p-value of < 0.05. A dashed spanning line or a gray # marks differences with a p-value of < 0.1.

References

    1. Arnoczky S. P., Lavagnino M., Egerbacher M. (2007). The mechanobiological aetiopathogenesis of tendinopathy: is it the over-stimulation or the under-stimulation of tendon cells? Int. J. Exp. Pathol. 88 217–226. 10.1111/j.1365-2613.2007.00548.x - DOI - PMC - PubMed
    1. Beard D. J., Rees J. L., Cook J. A., Rombach I., Cooper C., Merritt N., et al. (2017). Arthroscopic subacromial decompression for subacromial shoulder pain (CSAW): a multicentre, pragmatic, parallel group, placebo-controlled, three-group, randomised surgical trial. Lancet 391 329–338. 10.1016/S0140-6736(17)32457-1 - DOI - PMC - PubMed
    1. Benson R. T., McDonnell S. M., Rees J. L., Athanasou N. A., Carr A. J. (2009). The morphological and immunocytochemical features of impingement syndrome and partial-thickness rotator-cuff tear in relation to outcome after subacromial decompression. J. Bone Joint Surg. Br. 91 119–123. 10.1302/0301-620X.91B1.21058 - DOI - PubMed
    1. Bieler F. H., Ott C. E., Thompson M. S., Seidel R., Ahrens S., Epari D. R., et al. (2009). Biaxial cell stimulation: a mechanical validation. J. Biomech. 42 1692–1696. 10.1016/j.jbiomech.2009.04.013 - DOI - PubMed
    1. Birkhold A. I., Razi H., Duda G. N., Checa S., Willie B. M. (2017). Tomography-based quantification of regional differences in cortical bone surface remodeling and mechano-response. Calcif. Tissue Int. 100 255–270. 10.1007/s00223-016-0217-4 - DOI - PubMed