

A low-dimensional structure of neurological impairment in stroke
- PMID: 34136813
- PMCID: PMC8204367
- DOI: 10.1093/braincomms/fcab119
A low-dimensional structure of neurological impairment in stroke
Abstract
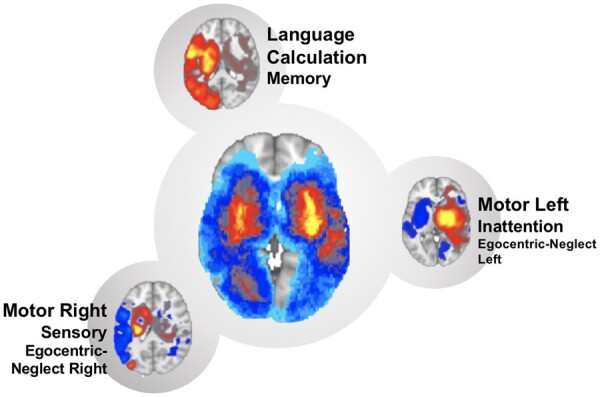
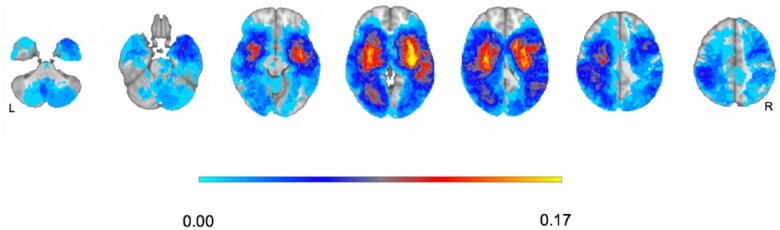
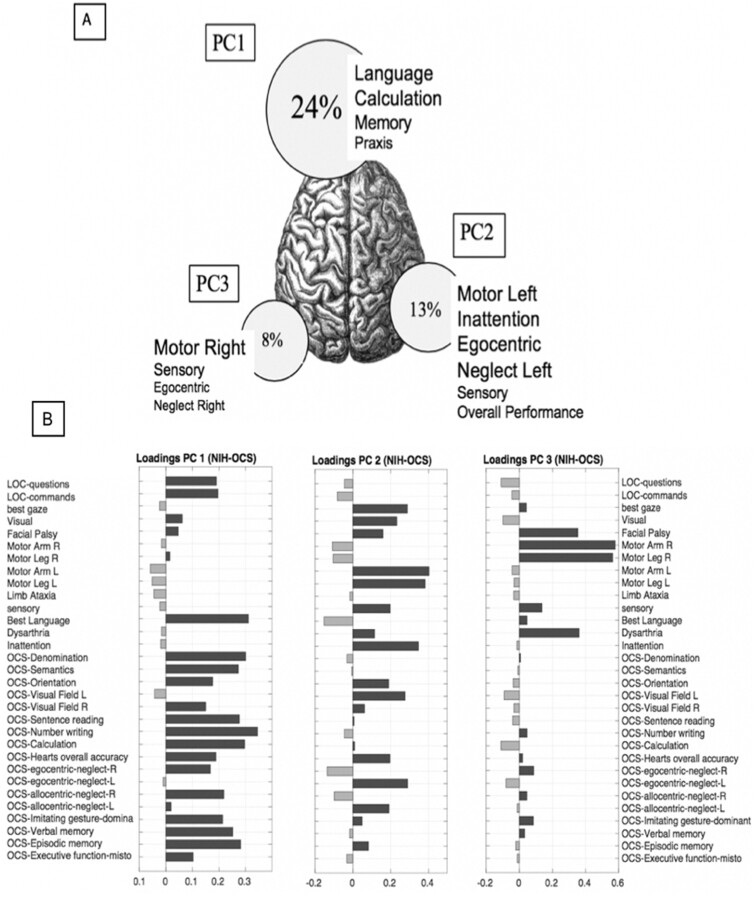
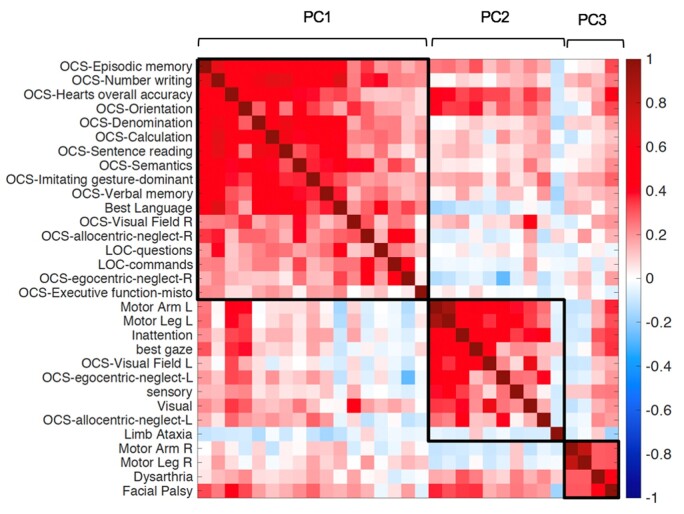
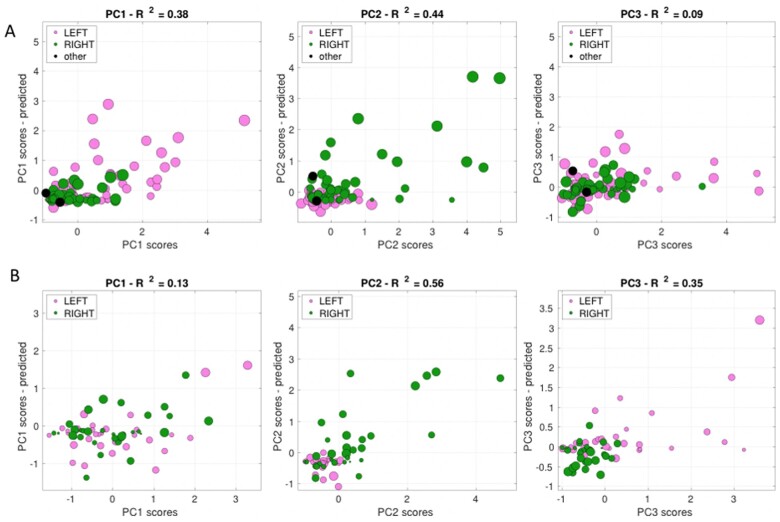
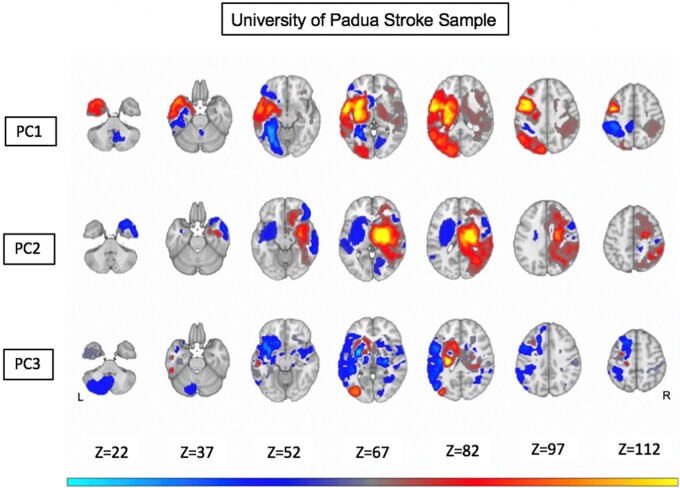
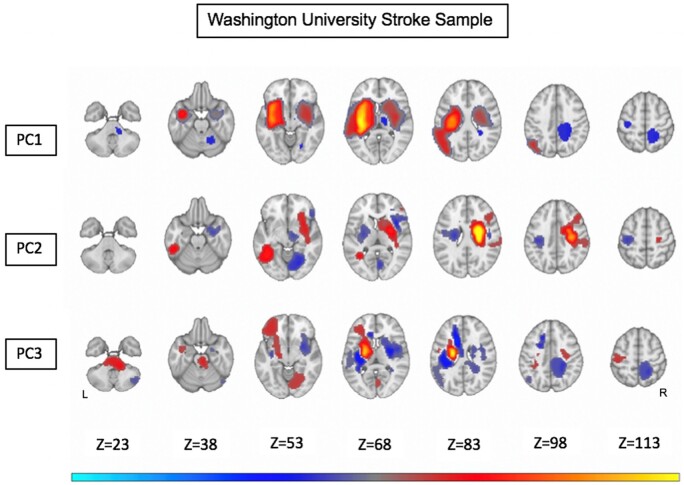
Neurological deficits following stroke are traditionally described as syndromes related to damage of a specific area or vascular territory. Recent studies indicate that, at the population level, post-stroke neurological impairments cluster in three sets of correlated deficits across different behavioural domains. To examine the reproducibility and specificity of this structure, we prospectively studied first-time stroke patients (n = 237) using a bedside, clinically applicable, neuropsychological assessment and compared the behavioural and anatomical results with those obtained from a different prospective cohort studied with an extensive neuropsychological battery. The behavioural assessment at 1-week post-stroke included the Oxford Cognitive Screen and the National Institutes of Health Stroke Scale. A principal component analysis was used to reduce variables and describe behavioural variance across patients. Lesions were manually segmented on structural scans. The relationship between anatomy and behaviour was analysed using multivariate regression models. Three principal components explained ≈50% of the behavioural variance across subjects. PC1 loaded on language, calculation, praxis, right side neglect and memory deficits; PC2 loaded on left motor, visual and spatial neglect deficits; PC3 loaded on right motor deficits. These components matched those obtained with a more extensive battery. The underlying lesion anatomy was also similar. Neurological deficits following stroke are correlated in a low-dimensional structure of impairment, related neither to the damage of a specific area or vascular territory. Rather they reflect widespread network impairment caused by focal lesions. These factors showed consistency across different populations, neurobehavioural batteries and, most importantly, can be described using a combination of clinically applicable batteries (National Institutes of Health Stroke Scale and Oxford Cognitive Screen). They represent robust behavioural biomarkers for future stroke population studies.
Keywords: behavioural; biomarkers; dimensionality; stroke.
© The Author(s) (2021). Published by Oxford University Press on behalf of the Guarantors of Brain.
Figures
References
-
- Fisher C. Clinical syndromes in cerebral artery occlusion. In: Fields WS, (eds.) Pathogenesis and treatment of cerebrovascular disease. Charles C. Thomas; Springfield, III., 1961:pp 151-177. Oxford University Press
-
- Broca P. Remarks on the seat of the faculty of articulated language, following an observation of aphemia (loss of speech). Bull Soc Anat. 1861;6:330–357. http://psychclassics.yorku.ca/Broca/aphemie-e.htm (25 June 2018, date last accessed).
-
- Jackson. Suggestions on studying diseases of the central nervous system on Professor Owen’s Vertebral Theory. Published online by Cambridge University Press: 26 July 2012
-
- Zandieh A, Kahaki ZZ, Sadeghian H, et al.The underlying factor structure of National Institutes of Health Stroke scale: An exploratory factor analysis. Int J Neurosci. 2012;122(3):140–144. - PubMed
-
- Lyden P, Claesson L, Havstad S, Ashwood T, Lu M.. Factor analysis of the National Institutes of Health Stroke scale in patients with large strokes. Arch Neurol. 2004;61(11):1677- - PubMed
LinkOut - more resources
Full Text Sources
Research Materials
Miscellaneous