

In Search of the SARS-CoV-2 Protection Correlate: Head-to-Head Comparison of Two Quantitative S1 Assays in Pre-characterized Oligo-/Asymptomatic Patients
- PMID: 34137000
- PMCID: PMC8208377
- DOI: 10.1007/s40121-021-00475-x
In Search of the SARS-CoV-2 Protection Correlate: Head-to-Head Comparison of Two Quantitative S1 Assays in Pre-characterized Oligo-/Asymptomatic Patients
Abstract
Background: Quantitative serological assays detecting response to SARS-CoV-2 are needed to quantify immunity. This study analyzed the performance and correlation of two quantitative anti-S1 assays in oligo-/asymptomatic individuals from a population-based cohort.
Methods: In total, 362 plasma samples (108 with reverse transcription-polymerase chain reaction [RT-PCR]-positive pharyngeal swabs, 111 negative controls, and 143 with positive serology without confirmation by RT-PCR) were tested with quantitative assays (Euroimmun Anti-SARS-CoV-2 QuantiVac enzyme-linked immunosorbent assay [EI-S1-IgG-quant]) and Roche Elecsys® Anti-SARS-CoV-2 S [Ro-RBD-Ig-quant]), which were compared with each other and confirmatory tests, including wild-type virus micro-neutralization (NT) and GenScript®cPass™. Square roots R of coefficients of determination were calculated for continuous variables and non-parametric tests were used for paired comparisons.
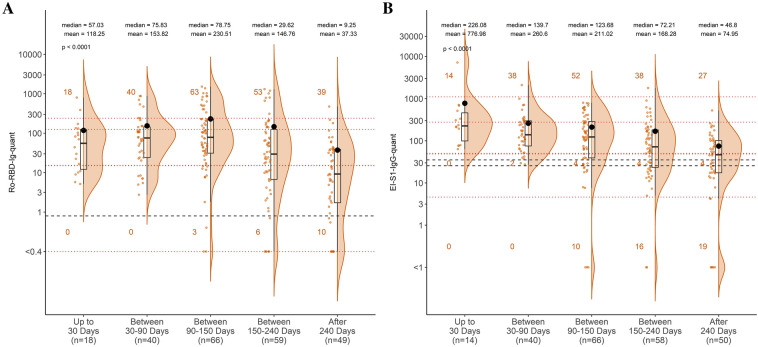
Results: Quantitative anti-S1 serology correlated well with each other (true positives, 96%; true negatives, 97%). Antibody titers decreased over time (< 30 to > 240 days after initial positive RT-PCR). Agreement with GenScript-cPass was 96%/99% for true positives and true negatives, respectively, for Ro-RBD-Ig-quant and 93%/97% for EI-S1-IgG-quant. Ro-RBD-Ig-quant allowed distinct separation between positives and negatives, and less non-specific reactivity versus EI-S1-IgG-quant. Raw values (95% CI) ≥ 28.7 U/mL (22.6-36.4) for Ro-RBD-Ig-quant and ≥ 49.8 U/mL (43.4-57.1) for EI-S1-IgG-quant predicted NT > 1:5 in 95% of cases.
Conclusions: Our findings suggest both quantitative anti-S1 assays (EI-S1-IgG-quant and Ro-RBD-Ig-quant) may replace direct neutralization assays in quantitative measurement of immune protection against SARS-CoV-2 in certain circumstances. However, although the mean antibody titers for both assays tended to decrease over time, a higher proportion of Ro-RBD-Ig-quant values remained positive after 240 days.
Keywords: COVID-19; Direct virus neutralization assay S1; Quantitative serology; SARS-CoV-2.
© 2021. The Author(s).
Figures


References
-
- European Centre for Disease Prevention and Control COVID-19 country overviews. Week. 2020;51:2020.
-
- Carrillo J, Izquierdo-Useros N, Avila-Nieto C, Pradenas E, Clotet B, Blanco J. Humoral immune responses and neutralizing antibodies against SARS-CoV-2; implications in pathogenesis and protective immunity. Biochem Biophys Res Commun. 2020;538:187–191. doi: 10.1016/j.bbrc.2020.10.108. - DOI - PMC - PubMed
LinkOut - more resources
Full Text Sources
Research Materials
Miscellaneous
