. 2021 Jul;194(1):179-190.
doi: 10.1111/bjh.17476. Epub 2021 Jun 16.

Thromboembolic risk in patients with lung cancer receiving systemic therapy

Affiliations

Thromboembolic risk in patients with lung cancer receiving systemic therapy

Cecelia J Madison et al. Br J Haematol. 2021 Jul.

Abstract

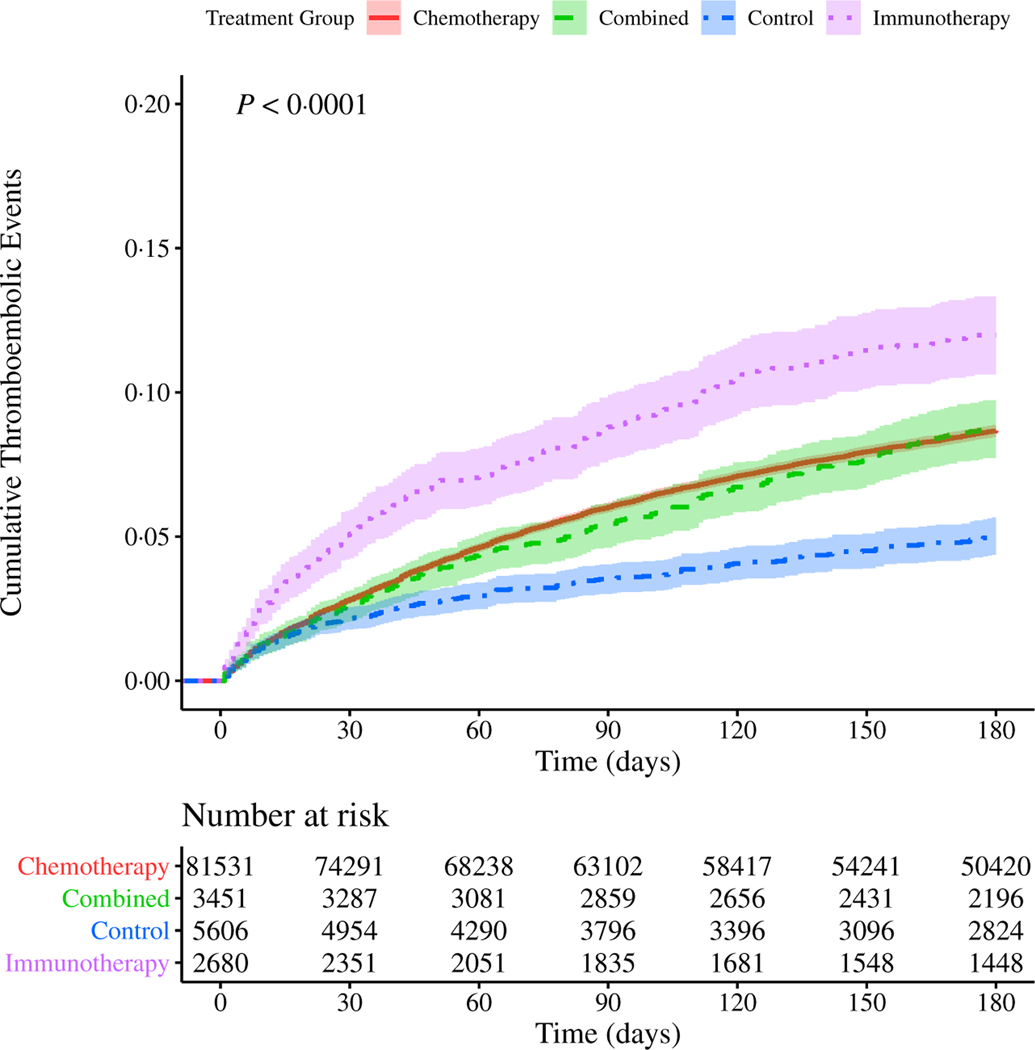
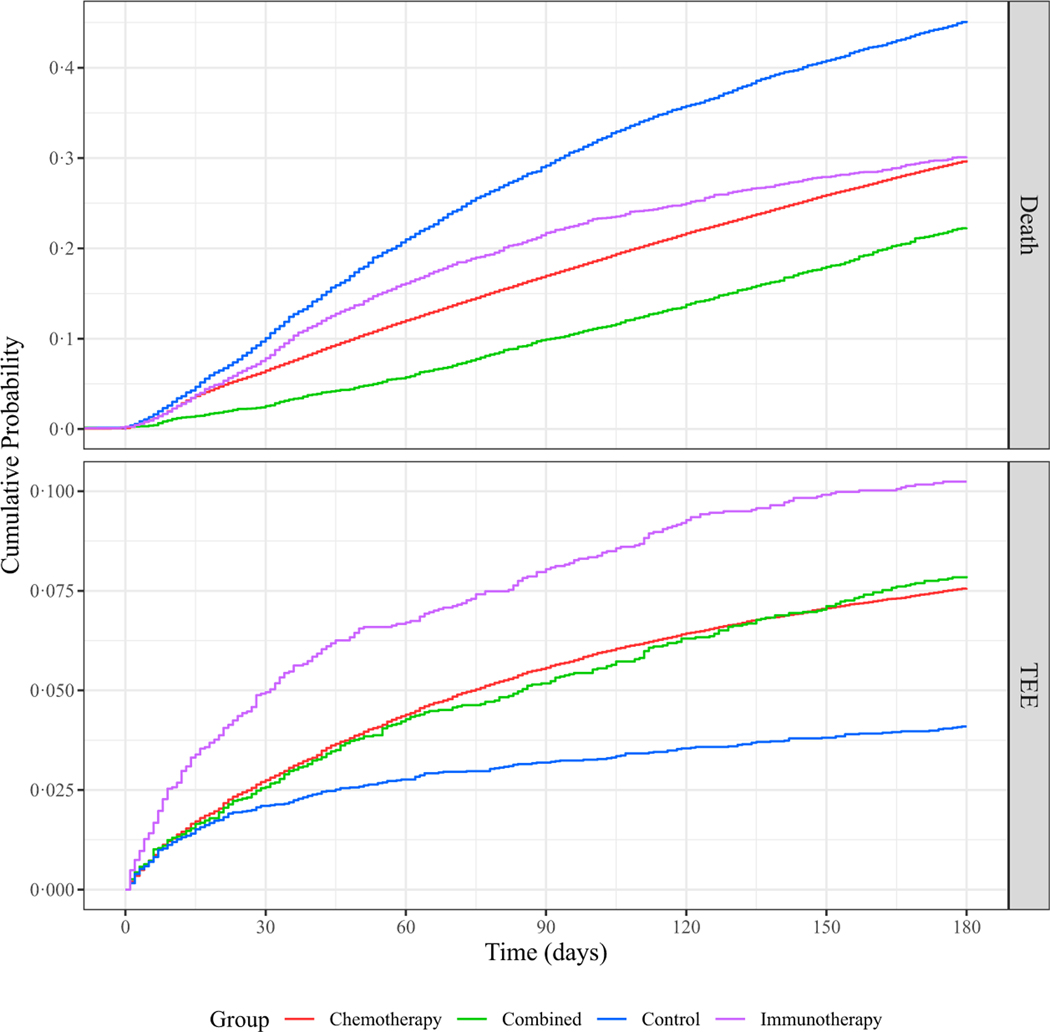
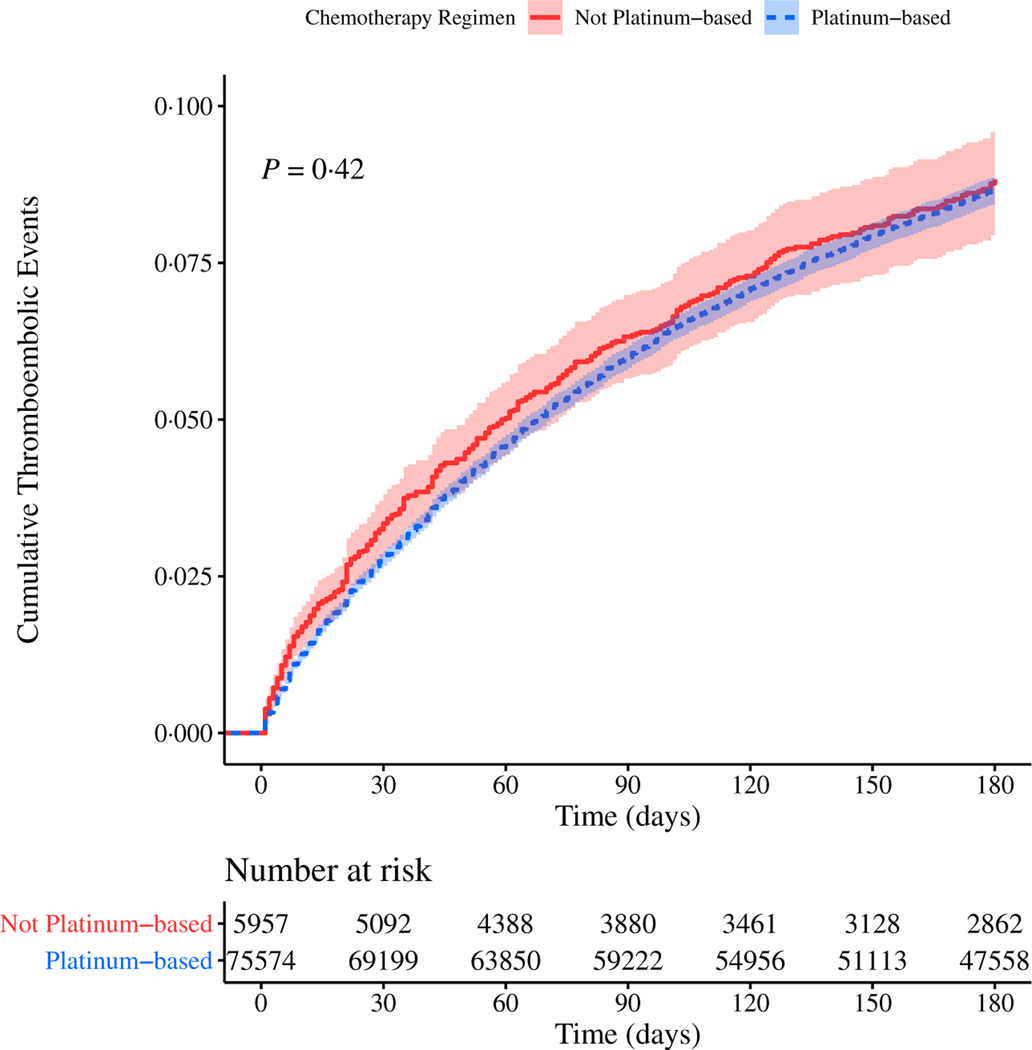
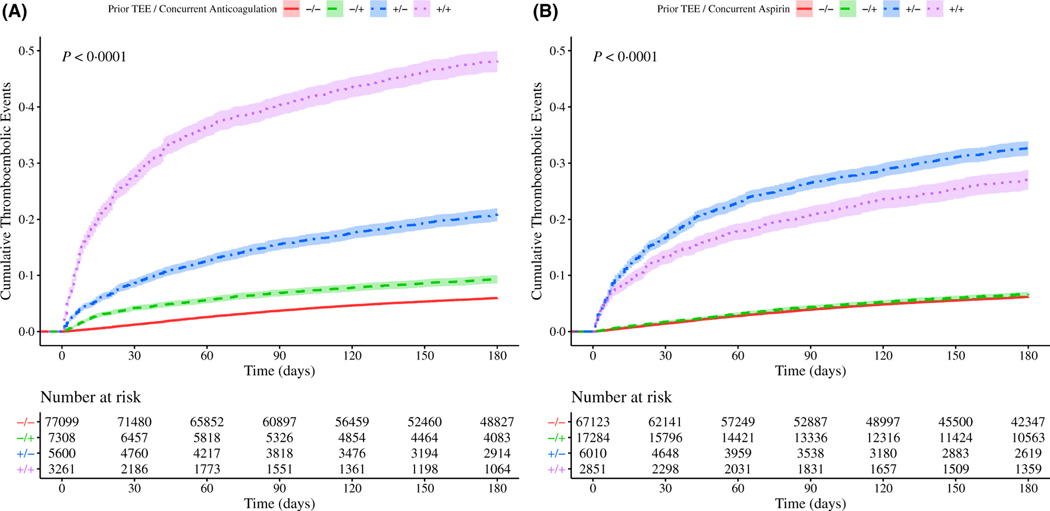
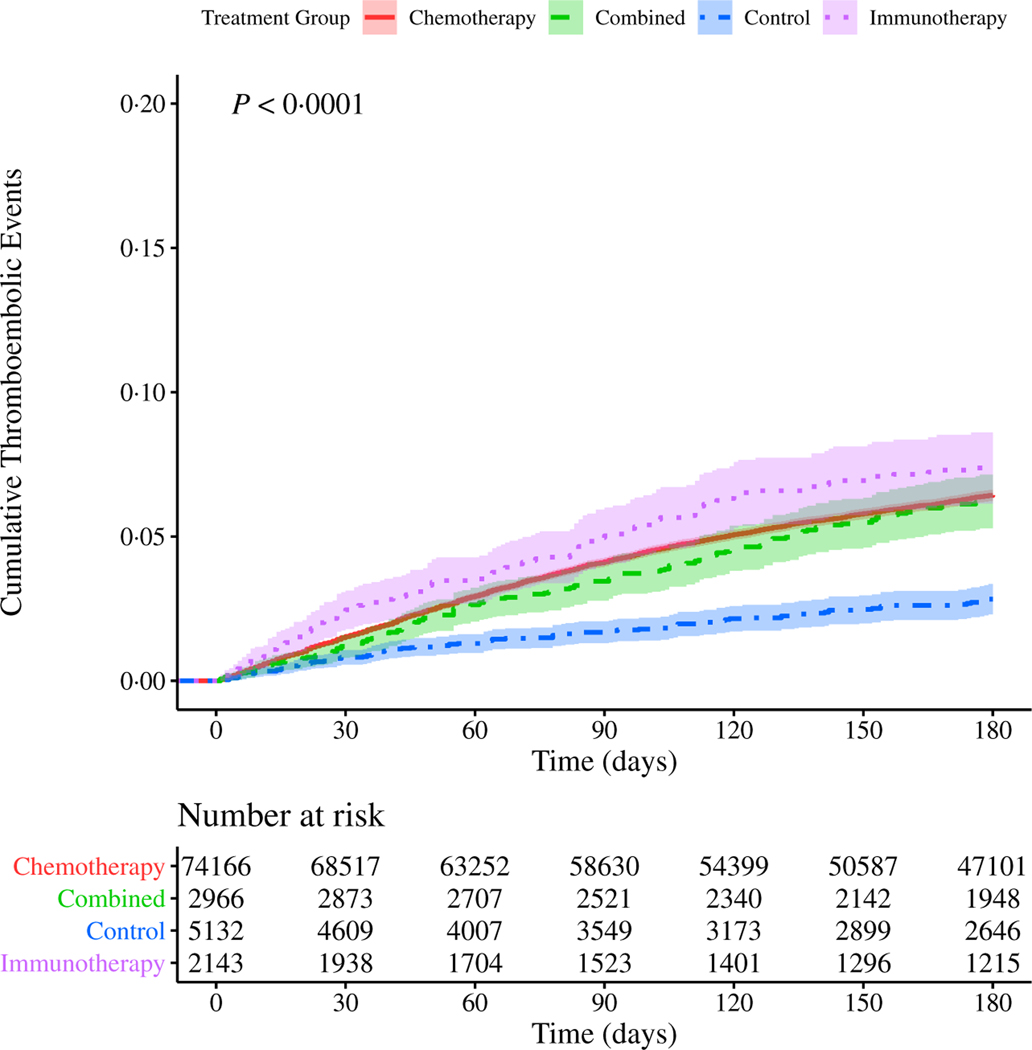
In this retrospective study, we investigated the influence of chemotherapy and immunotherapy on thromboembolic risk among United States Veterans with lung cancer during their first 6 months (180 days) following initiation of systemic therapy. Included patients received treatment with common front-line agents that were divided into four groups: chemotherapy alone, immunotherapy alone, combination of chemo- and immunotherapies, and molecularly targeted therapies (control group). The cohort experienced a 7·4% overall incidence of thrombosis, but the analysis demonstrated significantly different rates among the different groups. We explored models incorporating multiple confounding variables as well as the competing risk of death, and these results indicated that both chemo- and immunotherapies were associated with an increased incidence of thrombosis, either alone or combined, compared with the control group (7·56%, P = 2.2 × 10⁻¹⁶ ; 10·2%, P = 2.2 × 10⁻¹⁶ ; and 7·87%, P = 2.4 × 10⁻¹⁴ respectively vs. 4·10%). The Khorana score was found to be associated with increased risk, as were vascular disease and metastases. We found an association between risk of thrombosis and the use of anticoagulation, accounting for several confounders, including history of thrombosis. Further study is warranted to better determine the drivers of thromboembolic risk and to identify ways to mitigate this risk for patients.

Keywords: anticoagulation; chemotherapy; immunotherapy; lung cancer; thromboembolism.


Figures

Fig 1.
Fig 1.
Cumulative risk of thrombosis in patients with lung cancer stratified by treatment type. Risk of experiencing a thromboembolic event (TEE) during the first 180 days after the start of treatment for patients with lung cancer. The cohort is stratified by treatment group: immunotherapy alone (purple, dotted line), chemotherapy alone (red, solid line), or combination of both chemo- and immunotherapies (green, dashed line), as well as a non-chemo non-immunotherapy control group (blue, dot-dash line). Confidence intervals are represented by the shaded region around each line. Time (in days from start of treatment) is shown along the x-axis, with cumulative risk of TEE along the y-axis. The lower table depicts number of individuals at risk for each 30-day interval. P value reflects a significant difference in cumulative risk of TEE based on type of treatment. Pairwise P values computed by log-rank (Table SVII). [Colour figure can be viewed at wileyonlinelibrary.com]
Fig 2.
Fig 2.
Cumulative risk of thrombosis in patients with lung cancer stratified by treatment type, accounting for competing risk of death. Risk of experiencing death or a thromboembolic event (TEE) during the first 180 days after the start of treatment for patients with lung cancer. The cohort is stratified by treatment group: immunotherapy alone (purple), chemotherapy alone (red), or combination of both chemo- and immunotherapies (green), as well as a non-chemo non-immunotherapy control group (blue). Time (in days from start of treatment) is shown along the x-axis, with cumulative risk of death or TEE along the y-axes. The upper and lower plots depict the incidence of death or TEE respectively. [Colour figure can be viewed at wileyonlinelibrary.com]
Fig 3.
Fig 3.
Cumulative risk of thrombosis in patients with lung cancer stratified by chemotherapy regimen. Risk of experiencing a thromboembolic event (TEE) during the first 180 days after the start of treatment for patients with lung cancer. The cohort is stratified by chemotherapy regimen: not platinum-based agents (red, solid line) or platinum-based agents (blue, dashed line). Confidence intervals are represented by the shaded region around each line. P value computed by log-rank. [Colour figure can be viewed at wileyonlinelibrary.com]
Fig 4.
Fig 4.
Cumulative risk of thrombosis in patients with lung cancer stratified by prior thromboembolic events (TEEs) and anticoagulation or aspirin use. Risk of experiencing a TEE during the first 180 days after the start of treatment patients with for lung cancer. The cohort is stratified by occurrence of prior TEEs and either anticoagulation (panel A) or aspirin (panel B) use concurrently with systemic therapy: the use of anticoagulation or aspirin without a history of TEEs (‘−/+’green, dashed line), neither (‘−/−’ red, solid line), the presence of a prior TEE and anticoagulant or aspirin use (‘+/+’ purple, dotted line), or the presence of a prior TEE without anticoagulant or aspirin use (‘+/−’ blue, dot-dash line). Confidence intervals are represented by the shaded region around each line. Time (in days from start of treatment) is shown along the x-axes, with cumulative risk of TEE along the y-axes. The lower tables depict number of individuals at risk for each 30-day interval. Pairwise P values computed by log-rank (Tables SXVI-SXVII). [Colour figure can be viewed at wileyonlinelibrary.com]
Fig 5.
Fig 5.
Cumulative risk of thrombosis in patients with lung cancer with no prior history of thromboembolic events (TEEs), stratified by treatment type. Risk of experiencing a TEE during the first 180 days after the start of treatment for patients with lung cancer. The cohort is stratified by treatment group: chemotherapy alone (red, solid line), immunotherapy alone (purple, dotted line), or combination of both chemotherapy and immunotherapies (green, dashed line), as well as a non-chemo non-immunotherapy control group (blue, dot-dash line). Confidence intervals are represented by the shaded region around each line. Time (in days from start of treatment) is shown along the x-axis, with cumulative risk of TEE along the y-axis. The lower table depicts number of individuals at risk for each 30-day interval. Pairwise P values computed by log-rank (Table SXIX). [Colour figure can be viewed at wileyonlinelibrary.com]

References

    1. Cronin-Fenton DP, Søndergaard F, Pedersen LA, Fryzek JP, Cetin K, Acquavella J, et al. Hospitalisation for venous thromboembolism in cancer patients and the general population: a population-based cohort study in Denmark, 1997–2006. British Journal of Cancer. 2010;103:947–953. - PMC - PubMed
    1. Ay C, Pabinger I, Cohen AT. Cancer-associated venous thromboembolism: burden, mechanisms, and management. Thromb Haemost. 2017;117:219–30. - PubMed
    1. Di Nisio M, Porreca E, Candeloro M, De Tursi M, Russi I, Rutjes AW. Primary prophylaxis for venous thromboembolism in ambulatory cancer patients receiving chemotherapy. Cochrane Database Syst Rev. 2016;12: CD008500. - PMC - PubMed
    1. Levine MN, Gent M, Hirsh J, Arnold A, Goodyear MD, Hryniuk W, et al. The thrombogenic effect of anticancer drug therapy in women with stage II breast cancer. N Engl J Med. 1988;318:404–7. - PubMed
    1. Saphner T, Tormey DC, Gray R. Venous and arterial thrombosis in patients who received adjuvant therapy for breast cancer. J Clin Oncol. 1991;9:286–94. - PubMed

Publication types

MeSH terms