. 2021 Aug 2;220(8):e202007171.
doi: 10.1083/jcb.202007171. Epub 2021 Jun 17.

WDR62 localizes katanin at spindle poles to ensure synchronous chromosome segregation

Affiliations

WDR62 localizes katanin at spindle poles to ensure synchronous chromosome segregation

Amanda Guerreiro et al. J Cell Biol. .

Abstract

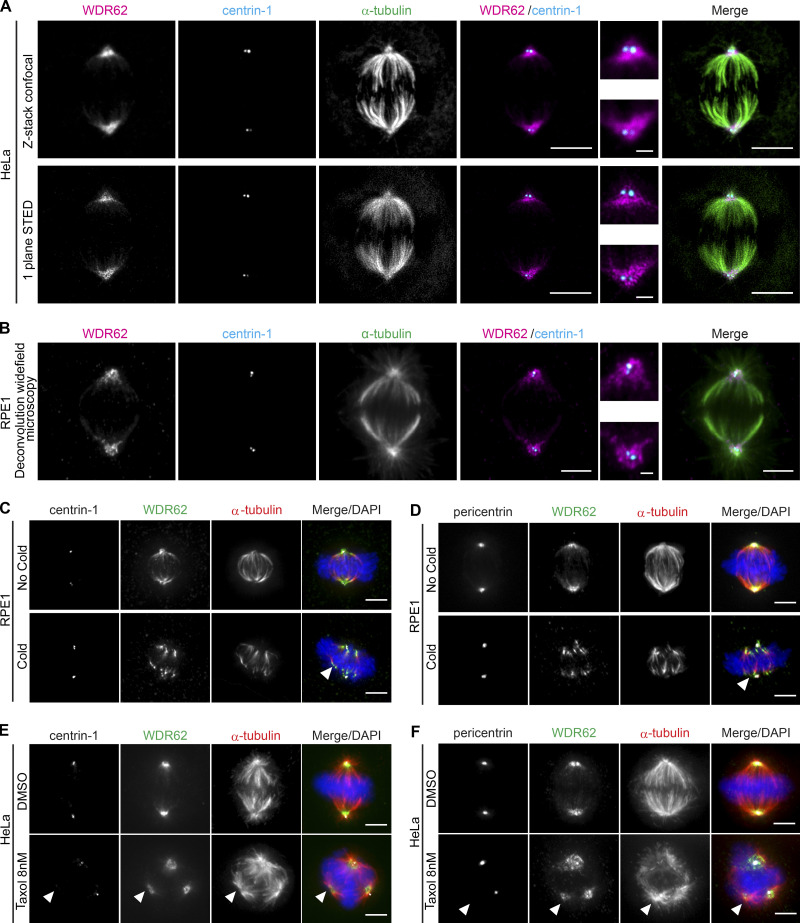
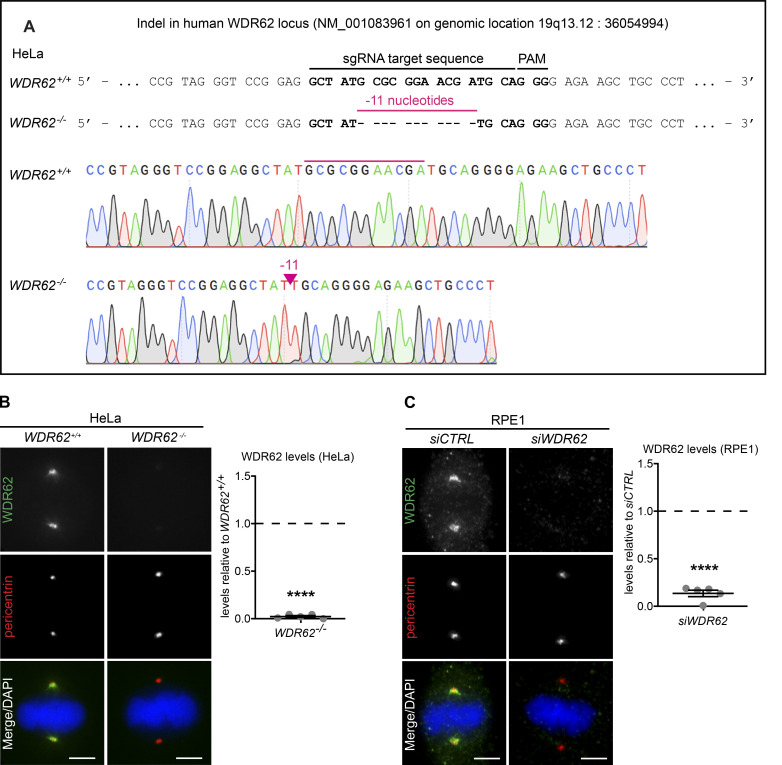
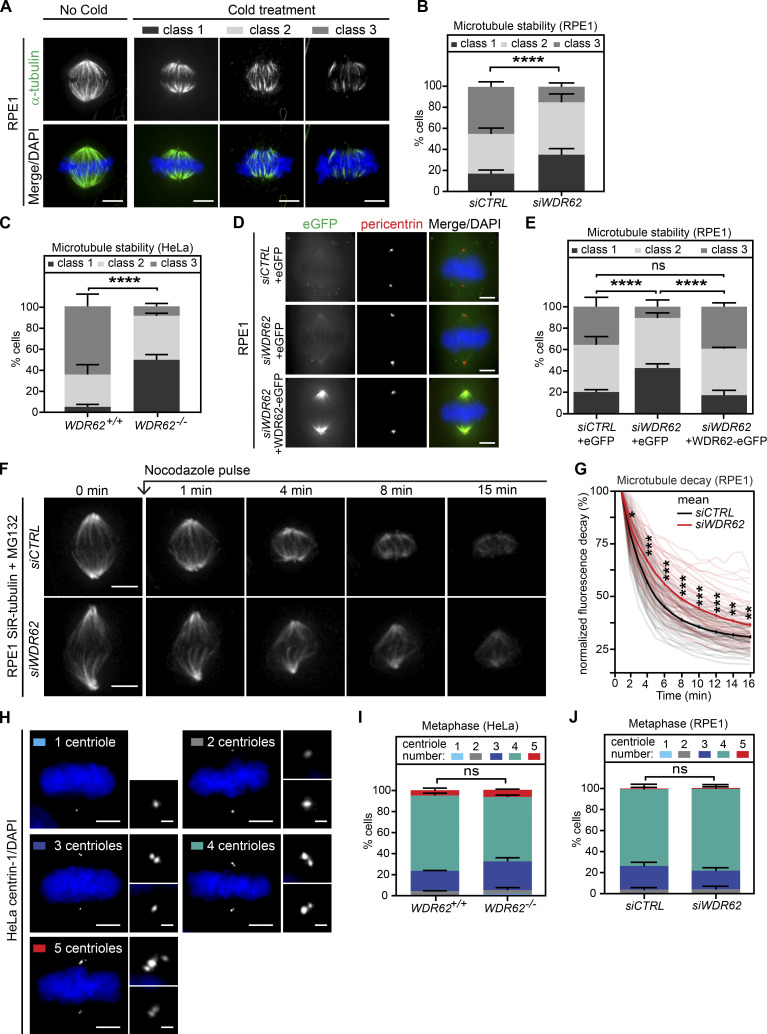
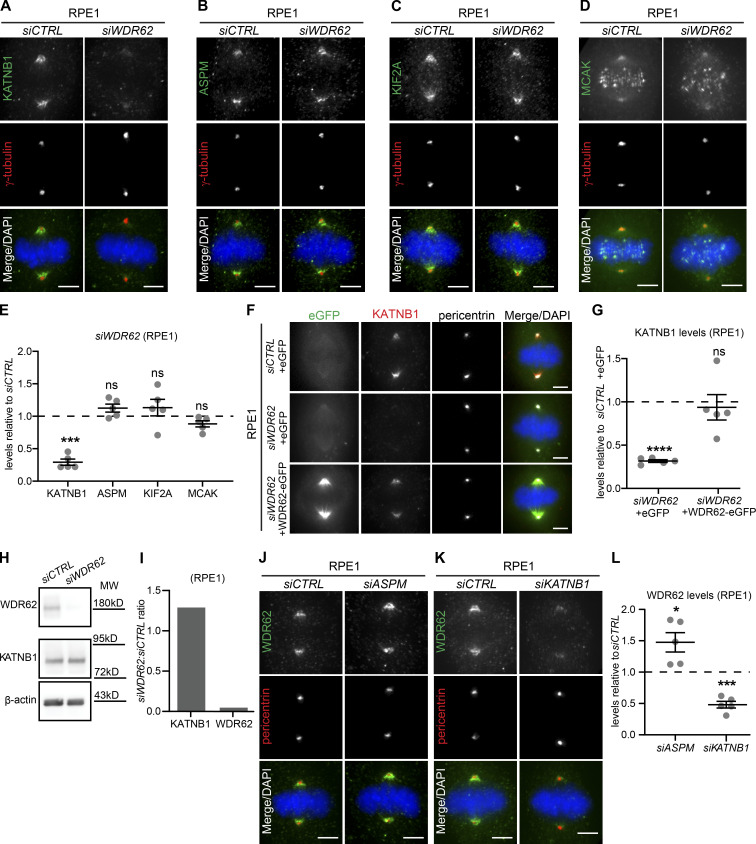
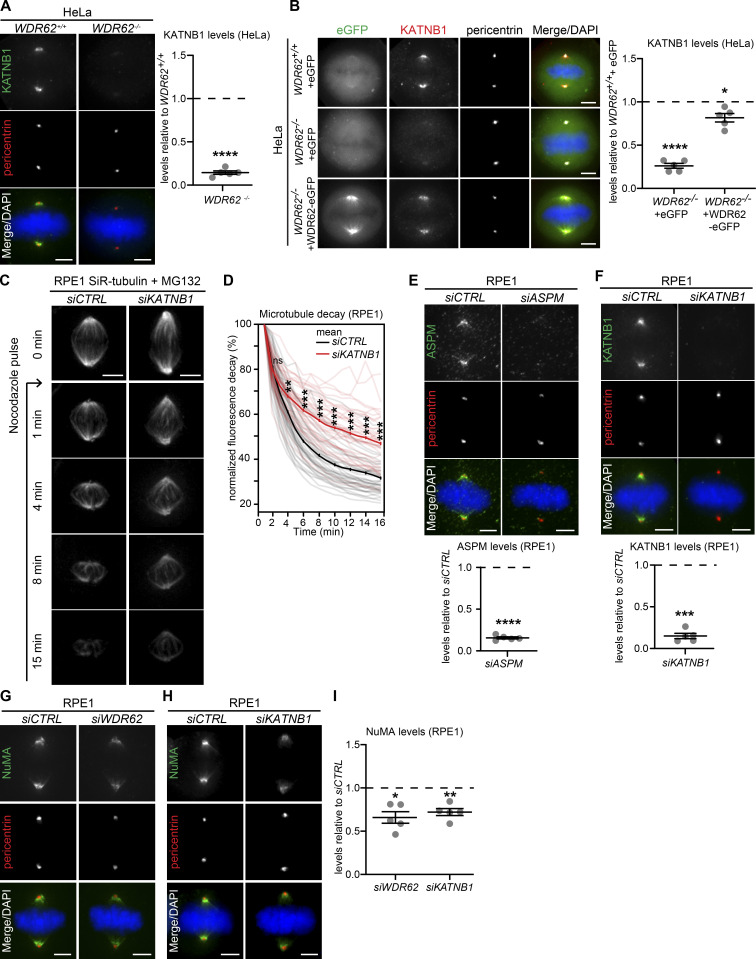
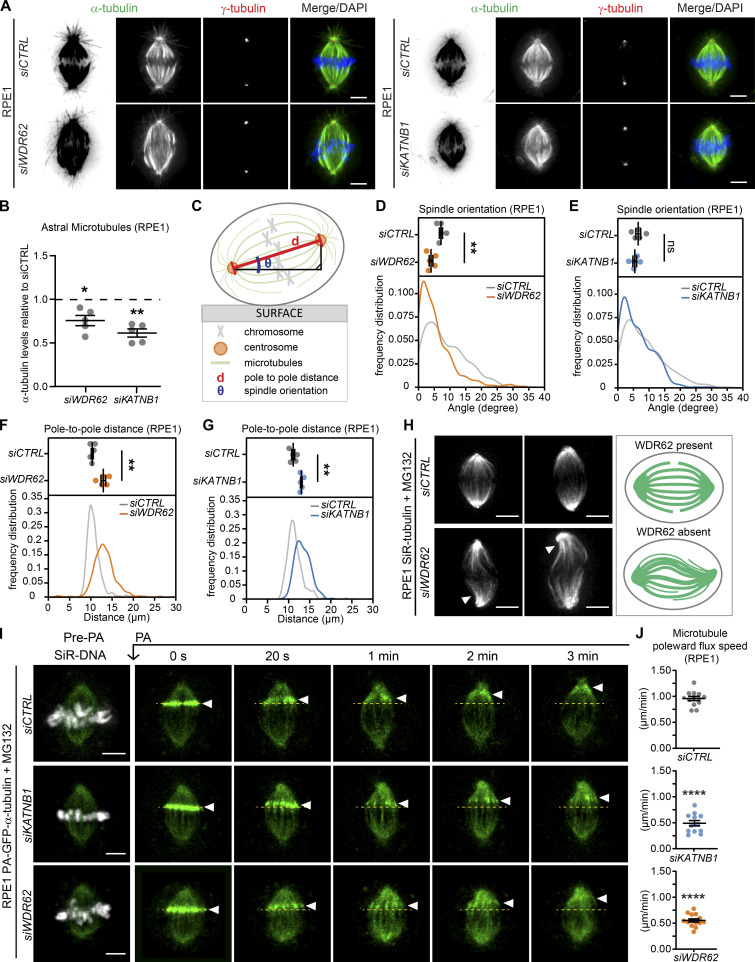
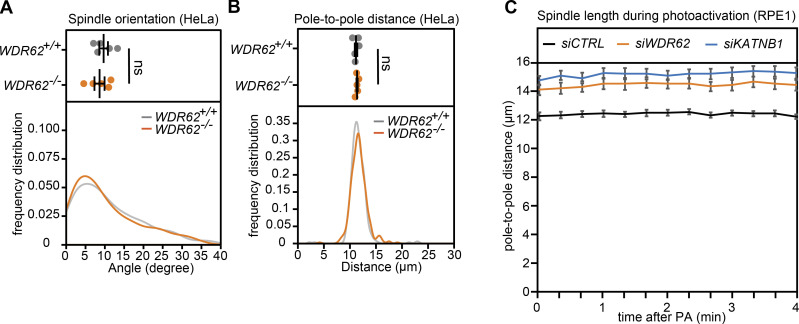
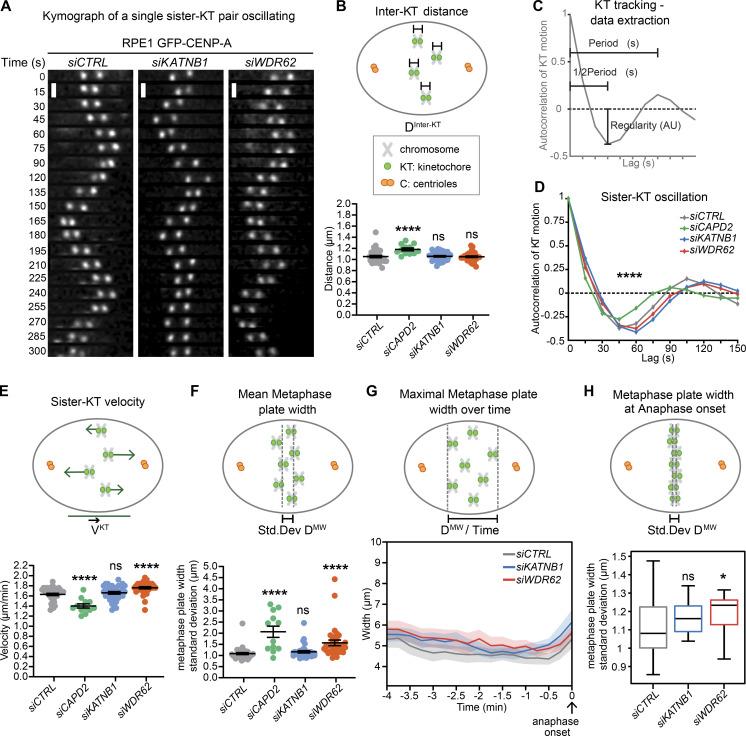
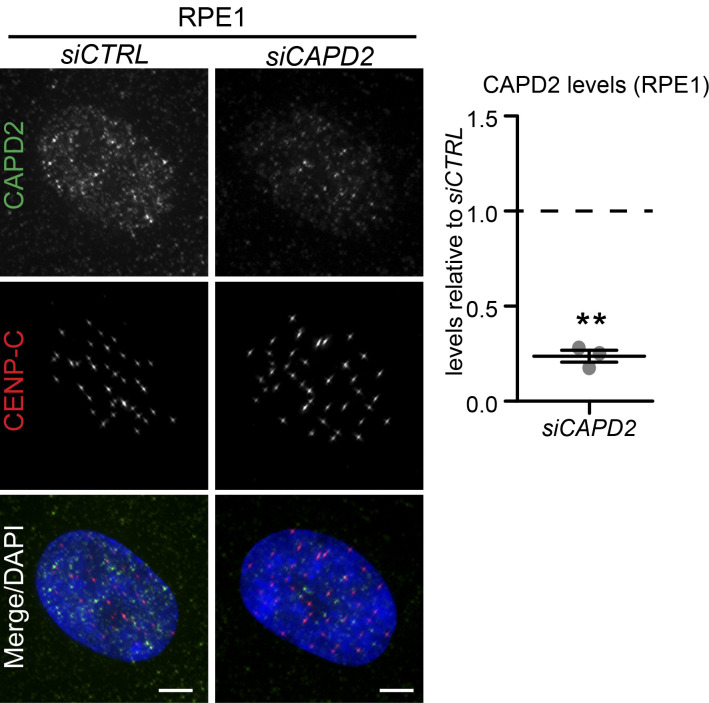
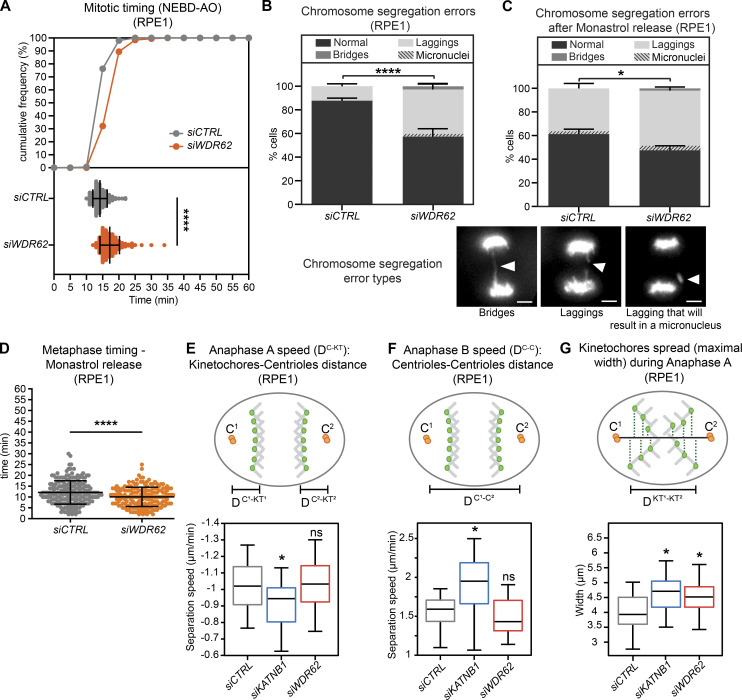
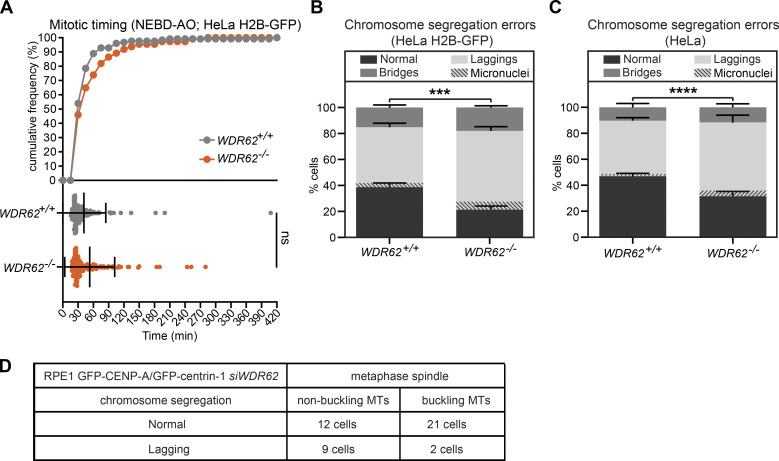
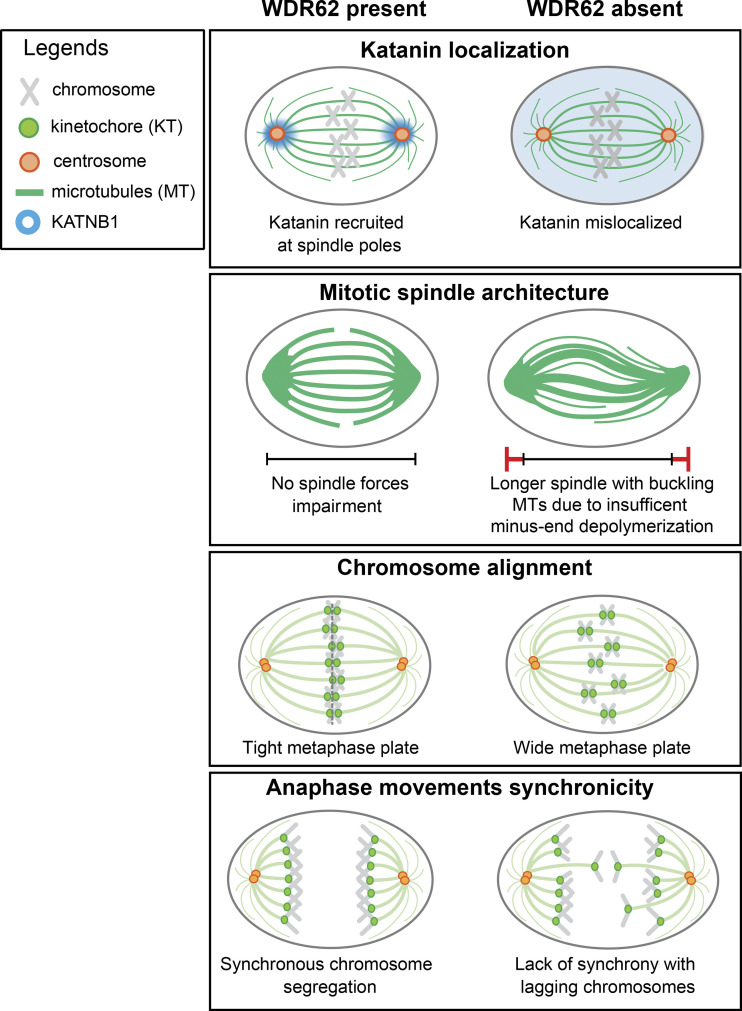
Mutations in the WDR62 gene cause primary microcephaly, a pathological condition often associated with defective cell division that results in severe brain developmental defects. The precise function and localization of WDR62 within the mitotic spindle is, however, still under debate, as it has been proposed to act either at centrosomes or on the mitotic spindle. Here we explored the cellular functions of WDR62 in human epithelial cell lines using both short-term siRNA protein depletions and long-term CRISPR/Cas9 gene knockouts. We demonstrate that WDR62 localizes at spindle poles, promoting the recruitment of the microtubule-severing enzyme katanin. Depletion or loss of WDR62 stabilizes spindle microtubules due to insufficient microtubule minus-end depolymerization but does not affect plus-end microtubule dynamics. During chromosome segregation, WDR62 and katanin promote efficient poleward microtubule flux and favor the synchronicity of poleward movements in anaphase to prevent lagging chromosomes. We speculate that these lagging chromosomes might be linked to developmental defects in primary microcephaly.


Figures

Figure 1.
Figure 1.
WDR62 localizes to microtubules at spindle poles.(A and B) Immunofluorescence images of metaphase. HeLa cells recorded by confocal (z-stack) and STED (one-plane) microscopy (A) or RPE1 cells recorded by deconvolution wide-field microscopy (one plane; B); cells were stained with α-tubulin, centrin-1, and WDR62 antibodies. Insets show spindle poles. (C and D) Immunofluorescence images of metaphase RPE1 cells, treated with or without a cold treatment and stained with DAPI, WDR62 and α-tubulin antibodies, and centrin-1 (C) or pericentrin (D) antibodies. Arrows indicate depolymerized microtubule minus-ends. (E and F) Immunofluorescence images of metaphase HeLa cells treated either with DMSO or 8 nM taxol for 12 h, stained with DAPI, WDR62 and α-tubulin antibodies, and centrin-1 (E) or pericentrin (F) antibodies. Arrowheads indicate centriole- and pericentrin-free spindle poles. Scale bars = 5 µm; 1 µm (inset).
Figure S1.
Figure S1.
WDR62 deletion and depletion efficiency. Related to Fig. 2. (A) Genomic sequence before and after performing CRISPR-Cas9 WDR62 knockout on HeLa H2B-GFP cells. PAM indicates the protospacer adjacent motif GGG. (B) Immunofluorescence images of metaphase WDR62+/+ and WDR62−/− HeLa H2B-GFP cells, stained with WDR62 and pericentrin antibodies and DAPI (left); quantification of WDR62 levels relative to WDR62+/+ (right): N = 5, n = 310 (WDR62+/+) and 322 (WDR62−/−) cells; dot plot represents median per experiment; bars represent mean ± SEM; ****, P < 0.0001, two-tailed unpaired t test. (C) Immunofluorescence images of metaphase RPE1 cells treated with siCTRL and siWDR62, stained with WDR62 and pericentrin antibodies and DAPI (left); quantification of WDR62 levels after siWDR62 treatment relative to siCTRL (right): N = 5, n = 310 cells per conditions; dot plot represents median per experiment; bars represent mean ± SEM; ****, P < 0.0001, two-tailed paired t test. All scale bars = 5 µm.
Figure 2.
Figure 2.
WDR62 loss increases spindle microtubule stability.(A) Immunofluorescence images of cold-treated metaphase RPE1 cells, stained with α-tubulin antibodies and DAPI. Cells were categorized into three representative classes based on k-fiber integrity in 3D. (B and C) Quantification of cold-stable assay in metaphase RPE1 cells treated with siCTRL or siWDR62 (B) or metaphase HeLa WDR62+/+ or WDR62−/− cells (C); stack bars indicate mean percentages of class 1, 2, and 3 spindles as depicted in A: N = 3 independent experiments, n = 184–188 cells per condition (B) or n = 207–215 cells (C); error bars represent mean ± SEM; ****, P < 0.0001, χ2 test. (D) Immunofluorescence images of RPE1 cells expressing eGFP or WDR62-eGFP treated with siCTRL or siWDR62 and stained with pericentrin antibodies and DAPI. (E) Quantification of cold-stable assay in RPE1 eGFP or WDR62-eGFP metaphase cells treated with siCTRL or siWDR62 as in B and C: N = 3, n = 183–206 cells; ****, P < 0.0001, χ2 test. (F) Time-lapse sequences of MG132-arrested RPE1 metaphase cells treated with siCTRL or siWDR62, labeled with SiR-tubulin, and treated with 200 ng/ml nocodazole at t = 0. (G) Quantification of the spindle microtubule decay over time in RPE1 metaphase cells treated with siCTRL or siWDR62: N = 3, n = 55–58 cells; thick lines represent mean; thin lines represent single experiments; *, P < 0.05; **, P < 0.01; ***, P < 0.001, repeated two-tailed paired t test. (H) Immunofluorescence images of metaphase HeLa cells stained with centrin-1 antibodies and DAPI. Cells were categorized according to centriole numbers. (I and J) Quantification of centriole numbers in metaphase WDR62+/+ or WDR62−/− HeLa cells (I) or RPE1 cells treated with siCTRL or siWDR62 (J): stack bars indicate mean percentage of cells with corresponding centrioles numbers; error bars represent mean ± SEM; N = 1, n = 200 cells; χ2 test. Scale bars = 5 µm; 2.5 µm (inset).
Figure 3.
Figure 3.
WDR62 is required for katanin localization at spindle poles.(A–D) Immunofluorescence images of metaphase RPE1 cells treated with siCTRL or siWDR62, stained with DAPI, antibodies against γ-tubulin, and KATNB1 (A), ASPM (B), KIF2A (C), or MCAK (D). (E) Quantification of protein levels at spindle poles in siWDR62 relative to siCTRL: N = 5; n = 286–328 cells; dot plot represents median per experiment; bars represent mean ± SEM; ***, P < 0.001, two-tailed paired t test. (F) Immunofluorescence images of RPE1 eGFP or WDR62-eGFP metaphase cells transfected with indicated siRNA, stained with KATNB1 and pericentrin antibodies, and DAPI. (G) Quantification of KATNB1 levels at spindle poles as shown in F: N = 5, n = 263–279 cells; dot plot represents median per experiment; bars represent mean ± SEM; ****, P < 0.0001, one-way ANOVA. (H) Western blot of asynchronous RPE1 cell lysates treated with siCTRL or siWDR62 and probed against WDR62, KATNB1, and β-actin (loading control). (I) Quantification of immunoblot shown in H of KATNB1/β-actin and WDR62/β-actin ratio signal in siWDR62 relative to siCTRL. N = 1. (J and K) Immunofluorescence images of metaphase RPE1 cells treated with indicated siRNA, stained with WDR62, pericentrin antibodies, and DAPI. (L) Quantifications of WDR62 levels at spindle poles in siASPM and siKATNB1 relative to siCTRL: N = 5; n = 320–339 cells; dot plot represents median per experiment; bars represent mean ± SEM; *, P < 0.05; ***, P < 0.001, two-tailed paired t test. All scale bars = 5 µm.
Figure S2.
Figure S2.
KATNB1 depletion mimics WDR62 depletion. Related to Fig. 3. (A) Immunofluorescence images of metaphase WDR62+/+ and WDR62−/− HeLa cells, stained with KATNB1 and pericentrin antibodies and DAPI (left); quantification of KATNB1 levels in WDR62−/− relative to WDR62+/+(right): N = 5, n = 308 (WDR62+/+) and 292 (WDR62−/−) cells; dot plot represents median per experiments; bars represent mean ± SEM; ****, P < 0.0001, two-tailed unpaired t test. (B) Immunofluorescence images of metaphase WDR62+/+ or WDR62−/− HeLa cells transfected with indicated constructs and stained with KATNB1 and pericentrin antibodies and DAPI (left). Quantification of KATNB1 levels at spindle poles (right) in N = 5, n = 217–228 cells; dot plot represents median per experiment; bars represent mean ± SEM; *, P ≤ 0.05; ****, P < 0.0001, one-way ANOVA. (C) Time-lapse images of MG132-arrested RPE1 cells treated with siCTRL and siKATNB1, labeled with SiR-tubulin, and treated with 200 ng/ml of nocodazole at t = 0. (D) Quantification of the spindle microtubule decay over time in siCTRL- and siWDR62-treated RPE1 metaphase cells: N = 4, n = 50 (siCTRL) and 55 (siKATNB1) cells; thick line represents mean; thin line represents single experiments; *, P < 0.05; **, P < 0.01; ***, P < 0.001, repeated two-tailed paired t test. (E–I) Immunofluorescence of metaphase RPE1 cells treated with indicated siRNAs, stained with DAPI and antibodies against pericentrin and ASPM (E), KATNB1 (F), or NuMA (G and H); all quantifications (E and F below, and I right) represent the levels in the indicated siRNA vs. siCTRL: N = 5, n = 303–323 cells; dot plots represent median per experiments; bars represent mean ± SEM; *, P < 0.05; **, P < 0.01; ***, P < 0.001; ****, P < 0.0001, in two-tailed paired t test. All scale bars = 5 µm.
Figure 4.
Figure 4.
WDR62 loss impairs microtubule minus-end depolymerization.(A) Immunofluorescence images of RPE1 cells treated with indicated siRNAs stained with antibodies against α- and γ-tubulin and DAPI. (B) Quantification of astral microtubules in siWDR62 and siKATNB1 relative to siCTRL; N = 5, n = 244–281 cells; dot plot represents median per experiment; bars represent mean ± SEM; *, P < 0.05; **, P < 0.01, two-tailed paired t test. (C) Scheme representing mitotic spindle orientation as the angle from the surface (θ) and the pole-to-pole distance (d). (D–G) Quantification of spindle orientation (D and E) and pole-to-pole distances (F and G) in siCTRL-, siKATNB1-, and siWDR62-treated RPE1 metaphase cells. Dot plots show medians per experiment; curves the frequency distribution; N = 5; n = 315–323 cells; bars represent mean ± SEM; **, P < 0.01 in two-tailed unpaired t test. (H) Immunofluorescence image of siCTRL- or siWDR62-treated MG132 arrested RPE1 cells labeled with SiR-tubulin, and representative spindle architecture scheme indicating microtubule buckling in the spindle of siWDR62-treated cells. (I) Time-lapse images of RPE1 PA-GFP-α-tubulin cells treated with indicated siRNAs and MG132, labeled with SiR-DNA, and photoactivated (PA) at t = 0. (J) Quantification of the microtubule poleward flux speed (μm/min): N = 3, n = 12–14 cells; dot plots represent each cell; bars represent mean ± SEM; ****, P < 0.0001, two-tailed paired t test. All scale bars = 5 µm. See also Video 1, Video 2, and Video 3.
Figure S3.
Figure S3.
WDR62−/− HeLa cells show no difference in spindle orientation or pole-to-pole distance, and spindle length of MG132-arrested RPE1 cells are constant. Related to Fig. 4. (A and B) Quantification of spindle orientation (A) and pole-to-pole distances (B) in WDR62+/+ and WDR62−/− metaphase HeLa H2B-GFP cells; dot plots represent median per experiments with bars displaying mean ± SEM (top) and frequency distribution (bottom): N = 5, n = 323 (WDR62+/+) and 330 (WDR62−/−) cells; two-tailed unpaired t test. (C) Quantification of spindle length during photoactivation (PA) experiments in indicated siRNA treatments; lines represent mean per condition, with bars displaying SEM. n = 15 cells per condition.
Figure 5.
Figure 5.
WDR62 loss leaves k-fiber plus-end dynamics intact but leads to wider metaphase plates.(A–H) Automated sister-kinetochore tracking of RPE1 GFP-centrin1/GFP-CENPA cells treated with indicated siRNA. Shown are kymographs single, oscillating sister-kinetochores, scale bars = 1 µm (A); quantification of the interkinetochore distances (B); schematic illustrating the parameters of sister-kinetochore oscillation autocorrelation curves (C); autocorrelation curves of sister-kinetochore oscillations along spindle axis (D); sister-kinetochore velocities (E); mean metaphase plate width (F); maximal metaphase plate width over time (G); and mean metaphase plate width at anaphase onset (H). N = 3–5, n = 35 (siCTRL), 12 (siCAPD2), 34 (siKATNB1), and 33 (siWDR62) cells; dot plots represent each cell with bars displaying mean ± SEM; box plot represent mean ± SD; *, P < 0.05; ****, P < 0.0001, one-way ANOVA. AU, arbitrary units.
Figure S4.
Figure S4.
Validation of CAPD2 depletion in RPE1 cells. Related to Fig. 5. Immunofluorescence images of interphase RPE1 cells treated with siCTRL and siCAPD2 and stained with CAPD2 and CENP-C antibodies and DAPI (left); quantification of CAPD2 levels in siCAPD2 relative to siCTRL (right): N = 3, n = 125 cells per condition; dot plot represents median per experiment; bars represent mean ± SEM; **, P < 0.01, two-tailed paired t test. Scale bars = 5 µm.
Figure 6.
Figure 6.
WDR62 is required for synchronous poleward anaphase movements.(A) Mitotic timing from nuclear breakdown (NEBD) until anaphase onset (AO) of RPE1 EB3-GFP/H2B-mCherry cells treated with siCTRL or siWDR62, shown as cumulative frequency diagram or dot plot representing each cell with bars displaying mean ± SEM; N = 3, n = 156–203 cells; ****, P < 0.0001, two-tailed paired t test. (B and C) Percentage of chromosome segregation errors from RPE1 EB3-GFP/H2B-mCherry cells, either unsynchronized (B) or after monastrol release (C). Stack bars represent normal anaphase, anaphase with lagging chromosomes, or anaphase with chromosome bridges as shown on representative images; scale bars = 5 µm; gray stripes represent a cell with a lagging chromosome that will result in micronucleus; error bars represent mean ± SEM; N = 5, n = 125–209 cells for B; N = 3, n = 209–234 cells for C; ****, P < 0.0001; *, P = 0.042 by χ2 test. (D) Timing from monastrol arrest release until anaphase onset from C; dot plot represents each cell; bars represent mean ± SEM; ****, P < 0.0001, two-tailed paired t test. n = 44 cells. (E–G) Automated spindle pole and KT of RPE1 GFP-centrin1/GFP-CENPA cells treated with indicated siRNA. Shown are anaphase A speed, derived from the distance between kinetochores and centrioles (DC-KT) over time (E); anaphase B speed, derived from the intercentrosome distance (DC-C) over time (F); and the maximal spread of kinetochores during their movements toward the poles in anaphase A for each condition (G); N = 3, n = 20 cells; bars represent mean ± SD; *, P < 0.05, one-way ANOVA. See also Video 4, Video 5, Video 6, Video 7, and Video 8.
Figure S5.
Figure S5.
Loss of WDR62 in HeLa cells does not affect mitotic timing but increases the percentage of lagging chromosomes. Related to Fig. 6. (A) Mitotic timing from nuclear breakdown (NEBD) until anaphase onset (AO) of WDR62+/+ and WDR62−/−HeLa H2B-GFP cells: cumulative frequency (top) with dot plot representing each cell (bottom); bars represent mean ± SEM; two-tailed unpaired t test. (B and C) Percentage of chromosome segregation errors from unsynchronized HeLa H2B-GFP (B) or HeLa (C) cells with a WDR62+/+ and WDR62−/− genotype. Stack bars indicate the number of normal anaphases, anaphases with lagging chromosomes, or anaphases with chromosome bridges; gray stripes represent cells with lagging chromosomes resulting in micronuclei; error bars represent mean ± SEM; N = 5, n = 290–367 cells; ***, P = 0.0002; ****, P < 0.0001, χ2 test. (D) Quantification of lagging chromosomes in SiR-tubulin–stained RPE1 GFP-centrin1/GFP-CENPA cells with buckling or nonbuckling microtubules after siWDR62 treatment.
Figure 7.
Figure 7.
WDR62 localizes KATNB1 at spindle poles to ensure synchronous anaphase. Model of how WDR62 ensures efficient minus-end depolymerization by localizing katanin at spindle poles to ensure tight metaphase plates and synchronous anaphase movements.

Similar articles

Cited by

References

    1. Akhmanova, A., and Steinmetz M.O.. 2015. Control of microtubule organization and dynamics: two ends in the limelight. Nat. Rev. Mol. Cell Biol. 16:711–726. 10.1038/nrm4084 - DOI - PubMed
    1. Akhmanova, A., and Steinmetz M.O.. 2019. Microtubule minus-end regulation at a glance. J. Cell Sci. 132:jcs227850. 10.1242/jcs.227850 - DOI - PubMed
    1. Amaro, A.C., Samora C.P., Holtackers R., Wang E., Kingston I.J., Alonso M., Lampson M., McAinsh A.D., and Meraldi P.. 2010. Molecular control of kinetochore-microtubule dynamics and chromosome oscillations. Nat. Cell Biol. 12:319–329. 10.1038/ncb2033 - DOI - PMC - PubMed
    1. Bakhoum, S.F., Genovese G., and Compton D.A.. 2009a. Deviant kinetochore microtubule dynamics underlie chromosomal instability. Curr. Biol. 19:1937–1942. 10.1016/j.cub.2009.09.055 - DOI - PMC - PubMed
    1. Bakhoum, S.F., Thompson S.L., Manning A.L., and Compton D.A.. 2009b. Genome stability is ensured by temporal control of kinetochore-microtubule dynamics. Nat. Cell Biol. 11:27–35. 10.1038/ncb1809 - DOI - PMC - PubMed

Publication types

MeSH terms