Case Reports
. 2021 Aug 2;218(8):e20202592.
doi: 10.1084/jem.20202592. Epub 2021 Jun 17.

Human STAT3 variants underlie autosomal dominant hyper-IgE syndrome by negative dominance

Affiliations
Case Reports

Human STAT3 variants underlie autosomal dominant hyper-IgE syndrome by negative dominance

Takaki Asano et al. J Exp Med. .

Abstract

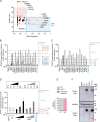
Most patients with autosomal dominant hyper-IgE syndrome (AD-HIES) carry rare heterozygous STAT3 variants. Only six of the 135 in-frame variants reported have been experimentally shown to be dominant negative (DN), and it has been recently suggested that eight out-of-frame variants operate by haploinsufficiency. We experimentally tested these 143 variants, 7 novel out-of-frame variants found in HIES patients, and other STAT3 variants from the general population. Strikingly, all 15 out-of-frame variants were DN via their encoded (1) truncated proteins, (2) neoproteins generated from a translation reinitiation codon, and (3) isoforms from alternative transcripts or a combination thereof. Moreover, 128 of the 135 in-frame variants (95%) were also DN. The patients carrying the seven non-DN STAT3 in-frame variants have not been studied for other genetic etiologies. Finally, none of the variants from the general population tested, including an out-of-frame variant, were DN. Overall, our findings show that heterozygous STAT3 variants, whether in or out of frame, underlie AD-HIES through negative dominance rather than haploinsufficiency.


Conflict of interest statement

Disclosures: The authors declare no competing interests exist.

Figures

None
Graphical abstract
Figure 1.
Figure 1.
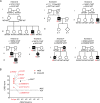
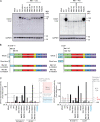
STAT3 nonsense or frameshift variants in HIES. (A) Pedigree of the seven unrelated families showing familial segregation of STAT3 nonsense or frameshift variants in our cohort. M, mutant. Individuals of unknown genotype are labeled “E?”. (B) Graph showing the predicted CADD scores (v1.6; Kircher et al., 2014; Rentzsch et al., 2019) and global allele frequency of the nonsense or frameshift variants found in the patients with HIES (red circles) and nonsense variants of STAT3 (black squares) found in the heterozygous state in the gnomAD database. The CADD-MSC score (99% confidence interval) for STAT3 is indicated by a black dashed line.
Figure 2.
Figure 2.
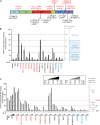
Allele activity and the mechanism of dominance of nonsense or frameshift STAT3 variants. (A) Schematic diagram of nonsense or frameshift STAT3 variants found both in our cohort (labeled in red) and in previous studies (labeled in black). (B and C) Luciferase assay on STAT3−/− A4 cells (B) or HEK293T cells (C) transfected with no vector (mock), EV, WT STAT3 (WT), or STAT3 variants, together with the pGL4.47 luciferase reporter construct and an expression vector for Renilla luciferase. After 24 h, transfected cells were left untreated or treated with 100 ng/ml sIL-6 for 24 h. The y-axis represents STAT3 transcriptional activity normalized against unstimulated activity in EV-transformed cells. The x-axis indicates the alleles used for transfection. R382W, D427ins17, and Y705F, which have been shown to be amorphic and DN, were used as positive controls. In-house variants are shown in red, previously reported variants in black, and positive controls in blue. (B) STAT3 transcriptional activity in STAT3−/− A4 cells transfected with mock, EV, WT, or STAT3 variants (canonical transcripts). STAT3 transcriptional activity in STAT3−/− A4 cells transfected with EV was considered to be 0% (red dashed line) and the level of STAT3 transcriptional activity in STAT3−/− A4 cells transfected with WT was considered to correspond to 100% activity. The variants are classified on the basis of percentage of STAT3 transcriptional activity as follows: <0%, amorphic; between 0% and 25%, severely hypomorphic; between 25% and 75%, mildly hypomorphic; between 75% and 125%, isomorphic; and >125%, hypermorphic. (C) STAT3 transcriptional activity in HEK293T cells expressing endogenous STAT3 transfected with mock, EV, WT STAT3 plasmid or various amounts of the STAT3 variants (described in the upper right box). sIL-6–stimulated EV-transfected HEK293T cells (endogenous STAT3 activity) are indicated by a red dashed line. The black dashed line represents 50% EV activity. The variants are classified on the basis of endogenous STAT3 activity; variants with transcription levels below the endogenous level are considered to be DN (weakly DN if >50% activity and strongly DN if <50%), and those with variants above the endogenous level are considered to be not DN. Each experiment (B and C) was independently performed three times. Error bars represent the means with SEM.
Figure 3.
Figure 3.
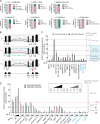
Identification and characterization of abnormal splicing in STAT3 nonsense or frameshift variants in HIES. (A) The ratio of canonical transcripts to alternative transcripts was determined by exon trapping. The percentages of WT (gray) and splice variants (canonical transcript in pink and alternative transcripts in green) of STAT3 transcripts are shown for nonsense or frameshift variants. M, mutant. (B) Deep RNA analysis for the identification of new alternative splicing in HIES patients' primary fibroblasts with STAT3 nonsense variants (P3 and P4). Amplified STAT3 cDNA were analyzed by MiSeq to identify the rare splicing events and shown by Sashimi plot representation using Integrative Genomics Viewer. Pink colored lines and legends represent canonical splicing. Green colored lines and legends represents alternative splicing already detected in the exon-trapping assay. Blue colored lines and legends represent alternative splicing newly identified in this assay. C, healthy control; P3, R518*; P4, W562*. Red arrow represents the position of each variant. (C and D) STAT3 transcriptional activity in STAT3−/− A4 cells (C) or HEK293T cells (D) transfected with mock, EV, WT, or STAT3 variants, including variants generating alternative transcripts, together with the pGL4.47 reporter construct and an expression vector for Renilla luciferase. After 24 h, the transfected cells were left untreated or treated with 100 ng/ml sIL-6 for 24 h. The y-axis represents STAT3 transcriptional activity levels normalized against unstimulated activity in EV-transformed cells. The x-axis indicates the alleles used for transfection. R382W, D427ins17, and Y705F were used as positive controls. The pink bar represents the canonical transcript and the green bar represents the alternative transcript. Stimulated EV-transfected HEK293T cell activity is indicated by a red dashed line. All variants are classified according to the rules described in Fig. 2, B and C. Each luciferase assay (C and D) was independently performed three times. Error bars represent the means with SEM.
Figure S1.
Figure S1.
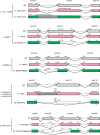
Schematic representation of the exon-trapping assay for nonsense or frameshift variants. Schematic representation of variants with alternative transcripts, based on the results of exon-trapping assays. The WT is shown in gray, and the variants are shown in pink and green (T1 in pink and T2 in green). T1 (pink) is the canonical transcript, and T2 (green) is the alternative transcript.
Figure S2.
Figure S2.
Deep RNA-seq for the identification of novel alternative splicing in HIES patients' cells with STAT3 nonsense variants.(A) RNA-seq results using EBV-B cells derived from HIES patient with STAT3 nonsense or frameshift variants (P3: R518*). P3 is already shown to have alternative splicing in our exon-trapping system. D427ins17 was previously confirmed to create an alternative transcript (Khourieh et al., 2019) and was used as a positive control. Red arrows represent mutated position. (B) RNA-seq result (Sashimi plot) for P3 focusing on the mutated exon. Sashimi plot analysis was demonstrated using Integrative Genomics Viewer. (C) Schematic representation of strategy for deep RNA analysis to detect the rare splicing events.
Figure S3.
Figure S3.
Protein production and STAT3 activity for nonsense or frameshift STAT3 variants, taking into account the alternative transcripts. (A and B) Western blot of extracts from nontransfected STAT3−/− A4 cells (mock), A4 cells transfected with pCMV6 EV, the STAT3 WT allele, or the STAT3 variant alleles of interest. Total extracts from nontransfected or transfected STAT3−/− A4 cells after treatment (+) with 50 ng/ml sIL-6 for 20 min. All extracts probed were with mAbs specific for p-STAT3 or the N-terminal (N-ter) part of the STAT3 protein. (C) Luciferase assay on HEK293T cells, which have endogenous STAT3, cotransfected with the canonical transcript and an alternative transcript, according to the ratio estimated in the exon-trapping assay (98% D371LfsX14 [T1] and 2% D371Lfs*14 due to IVS12 retention [T2]; 80% R518* [T1] and 20% R518Tfs* [T2]; 83% W562* [T1] and 17% E552_W562del [T2]; 92% S701Kfs*17 [T1] and 8% S701-D732delinsN [T2]); 52% S381* [T1] and 48% S381Pfs*2 [T2]; and 81% S381* [T1] and 19% S381Pfs*2 [T2]), together with the pGL4.47 reporter construct and an expression vector for Renilla luciferase. T1 represents the canonical transcript, and T2 represents alternative transcripts. The red dashed line represents activity after stimulation in EV-transformed cells, and the blacked dashed line represents 50% of this activity. Following cotransfection in the ratios found in exon-trapping assays, all the variants were found to be DN. Each experiment (A–C) was independently performed twice. Error bars represent the means with SEM.
Figure 4.
Figure 4.
Analysis of translation reinitiation for the R13Vfs*11 and Q125* variants of STAT3. (A) Western blot of extracts from nontransfected STAT3−/− A4 cells (mock), A4 cells transfected with EV, the STAT3 WT allele, or the STAT3 variant allele of interest. All extracts were probed with an antibody against the C terminus (C-ter) of the STAT3 protein. (Left) Each Met codon after the premature stop codon was mutated to give a Leu codon, at Met28, Met99, Met143, Met162, Met185, and Met200. Variants with such mutations at both Met28 and Met99 were also constructed. R13Vfs*11 and each variant with a mutated Met codon were used to transfect A4 cells, and the STAT3 protein profile was then checked. Right: Using the same procedure as for R13Vfs*11, each Met codon after the premature stop codon was mutated to give an Ala codon at Met143, Met162, Met185, and Met200. A construct with a double Met143Ala and Met162Ala mutation was also constructed. Q125* and each mutated construct was used to transfect STAT3-null A4 cells, and STAT3 protein levels were then checked. MW, molecular weight. (B) A short-form construct with a premature stop codon (R13Vfs*11 and Q125*) and a reinitiation construct (translation starts at Met28, Met99, Met143, and Met162) were designed and constructed from each variant plasmid by mutagenesis. CC, coiled-coil domain; DBD, DNA-binding domain; LD, linker domain; TA, transactivation domain. (C) Luciferase assay on STAT3−/− A4 cells (left figure) or HEK293T cells (right figure) transfected with mock, EV, WT, or STAT3 variants, including variants generating alternative transcripts, together with the pGL4.47 reporter construct and an expression vector for Renilla luciferase. After 24 h, the transfected cells were left untreated or treated with 100 ng/ml sIL-6 for 24 h. The y-axis represents STAT3 transcriptional activity normalized against unstimulated activity in EV-transformed cells. The x-axis shows the alleles used for transfection. R382W was used as a positive control for the DN effect. The black bar represents the results for the R13Vfs*11 variant, and the gray bar represents the results for the Q125* variant. The red dashed line represents activity in stimulated EV-transformed cells. All variants are classified according to the rules described in Fig. 2, B and C. Each experiment (A and C) was independently performed three times. Error bars represent the means with SEM.
Figure S4.
Figure S4.
Summary of 150 reported and new STAT3 variants in HIES. Schematic representation of all 150 previously reported and new STAT3 variants (as of July 1, 2020). Variants in black have been reported before, and those in blue are the new nonsense and frameshift variants identified in our cohorts. The variants in red are the six alleles validated experimentally before this work. Missense variants are described in the upper part of the figure, and nonsense, insertion, deletion, and splicing variants are described in the lower part.
Figure 5.
Figure 5.
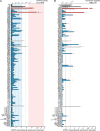
Allele activity and the mechanism of dominance for all reported STAT3 variants in AD-STAT3-HIES. Luciferase assay on STAT3−/− A4 cells (A) or HEK293T cells (B) transfected with mock, EV, WT, or the reported STAT3 variants, together with the pGL4.47 reporter construct and an expression vector for Renilla luciferase. After 24 h, the transfected cells were left untreated or treated with 100 ng/ml sIL-6 for 24 h. In A and B, only STAT3 transcriptional activity following sIL-6 stimulation is shown. All variants are classified according to the rules described in Fig. 2, B and C. (A) The red bar represents hypermorphic variants, the white bar represents isomorphic variants, and the blue bar represents amorphic or hypomorphic variants. (B) The color of the bars corresponds to the description in A. The 20 variants associated with an asterisk were considered to be not DN in this analysis (both not-DN and weak-DN variants were assigned to this category here). All variants are classified according to the rules described in Fig. 2, B and C. Each experiment (A and B) was independently performed twice. Error bars represent the means with SEM.
Figure S5.
Figure S5.
Analysis for 20 STAT3 variants identified as not DN in the first luciferase assay. (A) Dose-dependent mechanism of dominance for 20 STAT3 variants. Luciferase assay on HEK293T cells, which have endogenous STAT3, transfected with various amounts of WT plasmid or one of the 20 STAT3 variant plasmids corresponding to variants identified as not DN in Fig. 5 B (both not-DN and weak-DN variants were assigned to this category here). The red dashed line represents stimulated activity in EV-transformed cells, and the black dashed line represents 50% this level of activity. Five variants displayed dose-dependent negative dominance, with a strong or weak DN effect (F384C, D369_L370delinsE, R423Q, N472D, and K642E). The remaining 15 variants (in red) had no DN effect. (B and C) 13 of the 15 variants tested generated alternative transcripts (Table S5). Luciferase assay on STAT3−/− A4 cells (B) or HEK293T cells (C) transfected with the canonical transcript (pink bar) or alternative transcripts (green bar) were performed to measure STAT3 transcriptional activity. Each experiment (A–C) was independently performed twice. Error bars represent the means with SEM.
Figure 6.
Figure 6.
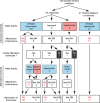
Schematic summary of the analysis for all reported in-frame STAT3 variants in AD-STAT3-HIES. Schematic representation of the results (allele activity and mechanism of dominance) for the 135 in-frame STAT3 variants analyzed.
Figure 7.
Figure 7.
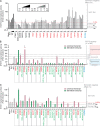
Allele activity and the mechanism of dominance for STAT3 variants found in the general population. (A) Graph showing the predicted CADD scores and global allele frequencies of nonsynonymous coding STAT3 variants found in gnomAD (v2.1). 14 variants, including a nonsense variant, were selected and analyzed (shown in red). The CADD-MSC score (99% confidence interval) for STAT3 is indicated by a red dashed line. (B and C) Luciferase assay on STAT3−/− A4 cells (B) or HEK293T cells (C) transfected with mock, EV, WT, or STAT3 variants from gnomAD, together with the pGL4.47 reporter construct and an expression vector for Renilla luciferase. After 24 h, the transfected cells were left untreated or treated with 100 ng/ml sIL-6 for 24 h. The y-axis represents STAT3 transcriptional activity normalized against unstimulated activity in EV-transformed cells. The x-paraxis represents the alleles used for transfection. R382W was used as a positive control, as its functional impact has already been determined. (D) Luciferase assay on HEK293T cells, which have endogenous STAT3, with various amounts of WT or Q247*. (E) Schematic representation of the ratio of canonical to alternative transcripts, according to an exon-trapping assay on the Q247* variant. Exon-trapping analysis revealed that all the transcripts were canonical (represented in pink), with none resulting in alternative transcripts, for the Q247* variant. (F) Western blot of extracts from nontransfected STAT3−/− A4 cells (mock), A4 cells transfected with pCMV6 EV, the STAT3 WT allele, or the STAT3 variant alleles (Q247*). All extracts were probed with mAbs specific for the C-terminal part of STAT3 or the N-terminal part of the STAT3 protein. No protein was detected with an antibody recognizing the C terminus, whereas a faint band at ∼25 kD (red arrow) was detected with an antibody recognizing the N terminus, suggesting that the N-terminal part (1–246) of STAT3 is weakly expressed. Each experiment (B, C, D, and F) was independently performed twice. Error bars represent the means with SEM.
Figure 8.
Figure 8.
Population and evolutionary genetics for human STAT3. (A) Diagram showing the correlation between predicted CADD scores and percentage of STAT3 transcriptional activity for all 150 STAT3 variants (canonical transcripts; red circles, left figure) and 14 gnomAD variants (black circles, right figure) analyzed here. The y-axis represents the CADD score, and the x-axis represents the percentage of STAT3 transcriptional activity. The STAT3 transcriptional activity of all variants was normalized against WT STAT3 transcriptional activity. The CADD-MSC score (99% confidence interval) for STAT3 is indicated by a red solid line. The gray dashed line is the regression line (R2). The blue rectangle represents the FN area, and the yellow rectangle represents the FP area. The white rectangle represents the true-positive (TP) area. (B) We used six programs other than CADD (Condel, FATHMM, Mutation Assessor, Polyphen2 [PPH2], Provean, and Sift) to predict the impact of the STAT3 variants (canonical transcripts), and we compared the scores obtained with transcription levels. In each diagram, the red solid line represents the mutational cutoff value. The blue rectangle represents the FN area, and the pale orange rectangle represents the FP area. The gray dashed line is the regression line (R2). (C) CoNeS analysis. CoNeS is our custom-built score integrating known negative selection scores through a principal-component projection. The mean value is 0, and low values (negative values) correspond to strong negative selection.

References

    1. Abolhassani, H., Chou J., Bainter W., Platt C.D., Tavassoli M., Momen T., Tavakol M., Eslamian M.H., Gharagozlou M., Movahedi M., et al. . 2018. Clinical, immunologic, and genetic spectrum of 696 patients with combined immunodeficiency. J. Allergy Clin. Immunol. 141:1450–1458. 10.1016/j.jaci.2017.06.049 - DOI - PubMed
    1. Adzhubei, I.A., Schmidt S., Peshkin L., Ramensky V.E., Gerasimova A., Bork P., Kondrashov A.S., and Sunyaev S.R.. 2010. A method and server for predicting damaging missense mutations. Nat. Methods. 7:248–249. 10.1038/nmeth0410-248 - DOI - PMC - PubMed
    1. Al Khatib, S., Keles S., Garcia-Lloret M., Karakoc-Aydiner E., Reisli I., Artac H., Camcioglu Y., Cokugras H., Somer A., Kutukculer N., et al. . 2009. Defects along the T(H)17 differentiation pathway underlie genetically distinct forms of the hyper IgE syndrome. J. Allergy Clin. Immunol. 124:342–348: 348.e1–348.e5. 10.1016/j.jaci.2009.05.004 - DOI - PMC - PubMed
    1. Alcántara-Montiel, J.C., Staines-Boone T., López-Herrera G., Espinosa-Rosales F., Espinosa-Padilla S.E., Hernández-Rivas R., and Santos-Argumedo L.. 2016. Functional characterization of two new STAT3 mutations associated with hyper-IgE syndrome in a Mexican cohort. Clin. Genet. 89:217–221. 10.1111/cge.12658 - DOI - PubMed
    1. Anders, S., Pyl P.T., and Huber W.. 2015. HTSeq--a Python framework to work with high-throughput sequencing data. Bioinformatics. 31:166–169. 10.1093/bioinformatics/btu638 - DOI - PMC - PubMed

Publication types

MeSH terms