Review
. 2019 Jul 8;11(1):54.
doi: 10.1007/s40820-019-0286-9.

Hierarchical Metal-Organic Frameworks with Macroporosity: Synthesis, Achievements, and Challenges

Affiliations
Review

Hierarchical Metal-Organic Frameworks with Macroporosity: Synthesis, Achievements, and Challenges

Huan V Doan et al. Nanomicro Lett. .

Abstract

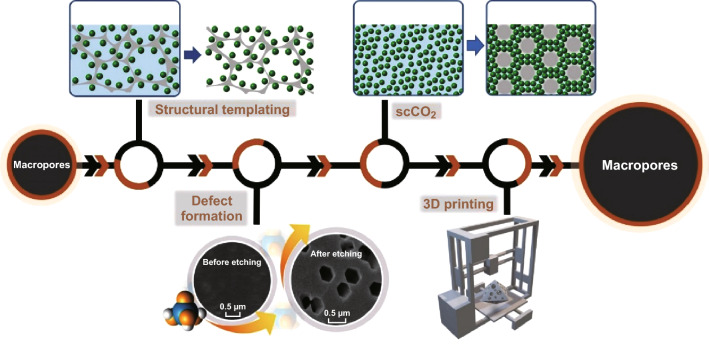
Introduction of multiple pore size regimes into metal-organic frameworks (MOFs) to form hierarchical porous structures can lead to improved performance of the material in various applications. In many cases, where interactions with bulky molecules are involved, enlarging the pore size of typically microporous MOF adsorbents or MOF catalysts is crucial for enhancing both mass transfer and molecular accessibility. In this review, we examine the range of synthetic strategies which have been reported thus far to prepare hierarchical MOFs or MOF composites with added macroporosity. These fabrication techniques can be either pre- or post-synthetic and include using hard or soft structural template agents, defect formation, routes involving supercritical CO2, and 3D printing. We also discuss potential applications and some of the challenges involved with current techniques, which must be addressed if any of these approaches are to be taken forward for industrial applications.

Keywords: Composites; Hierarchical; Macroporous; Metal–organic frameworks.


Figures

Fig. 1
Fig. 1
Schematic representation of synthetic methods for hierarchical MOFs with macroporosity
Fig. 2
Fig. 2
SEM images of HKUST-1/3D-KSCs800 at different magnifications, showing the growth of microporous HKUST-1 crystals on the 3D-KSCs800 macroporous template. Reprinted with permission from Ref. [62]. Copyright 2018 Elsevier B.V
Fig. 3
Fig. 3
SEM images of HKUST-1 coatings on ob-SiC and Al2O3 ceramic foams a, c without and b, d with preliminary alumina sol coating. The HKUST-1 coating layers on the ob-SiC composites are thicker than those on Al2O3 composites. Reprinted with permission from Ref. [63]. Copyright 2016 Elsevier Inc
Fig. 4
Fig. 4
a PXRD patterns of Ni foam-immobilised MIL-101(Cr) (blue) showing the presence of peaks which correspond to both Ni foam (black) and MIL-101(Cr) nanocrystals (red). b SEM images of Ni foam-immobilised MIL-101(Cr) showing the presence of multi-layered MIL-101(Cr) nanocrystals on the macroporous Ni foam. Reprinted with permission from Ref. [60]. Copyright 2015 Elsevier B.V. (Color figure online)
Fig. 5
Fig. 5
Schematic illustrations showing the preparation of ZIF-8@CA and the resulting SEM images. Reprinted with permission from Ref. [74]. Copyright 2018 Elsevier Inc
Fig. 6
Fig. 6
SEM images of a ZIF-9@CA and pure ZIF-9 inset, and b ZIF-12@CA and pure ZIF-12 inset. Reprinted with permission from Ref. [75]. Copyright 2018 Elsevier B.V
Fig. 7
Fig. 7
a Procedure for the preparation of PCN-224 decorated melamine foam composites. b FESEM images of PCN-224(Fe)/MF composite depicting the melamine foam network homogeneously decorated with PCN-224(Fe) microcrystals. c The high similarities between the PXRD patterns of PCN-224(Fe) (grey), PCN-224(Fe)50%/MF (purple), PCN-224(Fe)100%/MF (green), PCN-224(Fe)150%/MF (blue), PCN-224(Fe)200%/MF (red), and PCN-224(Fe)325%/MF (black) indicating the structural stability of the MOF composites. d N2 sorption isotherms of PCN-224(Fe)50%/MF (purple), PCN-224(Fe)100%/MF (green), PCN-224(Fe)150%/MF (blue), PCN-224(Fe)200%/MF (red), and PCN-224(Fe)325%/MF (black). The BET surface areas increased with the increasing loading amount of PCN-224(Fe) in the composites. Reprinted with permission from Ref. [78]. Copyright 2018 Wiley-VCH Verlag GmbH & Co. KGaA, Weinheim. (Color figure online)
Fig. 8
Fig. 8
a SEM images of the conversion of Cu-06 to HKUST-1 with 1-min time intervals, showing the growth of polyhedral crystallites with the preservation of the co-continuous macroporous gel structure. All the images are in the identical magnification. b N2 sorption isotherms and c BJH pore size distributions with respect to increased immersion times. The BET surface areas and pore sizes increased with immersion times. Reprinted with permission from Ref. [79]. Copyright 2015 Royal Society of Chemistry
Fig. 9
Fig. 9
a Schematic diagram of SOM-ZIF-8 synthesis. SEM images of b SOM-ZIF-8 and c an isolated crystal of SOM-ZIF-8 showing the tetrakaidecahedron morphology. Reprinted with permission from Ref. [69]. Copyright 2018 The Authors, some rights reserved
Fig. 10
Fig. 10
Schematic illustrations showing the preparation of ZIF–sponge, showing a surfactant-assisted dip-coating self-assembling process and b surface modification of the sponge skeleton first with a surfactant and then ZIF-67. c, d SEM images of ZIF–sponge prepared with the assistance of SDBS under different magnifications (the scale bar is 2 µm), showing ZIF nanocrystals were dip-coated on the surface of melamine sponge. Reprinted with permission from Ref. [71]. Copyright 2015 Royal Society of Chemistry
Scheme 1
Scheme 1
Schematic illustration of the synthesis of HP-MOFs with adjustable porosity using UiO-66 as an example. Reprinted with permission from Ref. [93]. Copyright 2017 Wiley-VCH Verlag GmbH & Co. KGaA, Weinheim
Fig. 11
Fig. 11
a Schematic representation for the preparation of HKUST-1 particles and the subsequent modification to produce macroporous HKUST-1 particles. b SEM image of HKUST-1 microparticles prepared by solvothermal synthesis with water–ethanol (1:1 v/v). c SEM image of modified HKUST-1 particle with hydroquinone at 150 °C for 16 h, showing the macroporous microparticles. d Macropore size distribution as measured by Hg intrusion porosimetry, with an intrusion pore volume 2.65 cm3 g−1, for the modified HKUST-1 particles. Reprinted with permission from Ref. [95]. Copyright 2014 Royal Society of Chemistry
Fig. 12
Fig. 12
SEM images of HKUST-1 particles modified by different reagents other than hydroquinone. a in 50 µL boric acid aqueous solution at 150 °C for 16 h and b in 50 µL NaCl aqueous solution at 150 °C for 16 h, showing some large etched holes were formed from the centre of the particles. Reprinted with permission from Ref. [95]. Copyright 2014 Royal Society of Chemistry
Fig. 13
Fig. 13
a, b Schematic representation of the etching process for HKUST-1 using phosphoric acid, showing phosphoric acid diffusing into HKUST-1 to form a hierarchical porous structure (a) and the disassembly of a cluster and 4 linkers (b). c–e SEM images of HKUST-1 etching in phosphoric acid using DMSO and MeOH as dilute solvents at pH 2.8 (c) and pH 2.6 (d, e), showing interconnected geometrical macropores after etching. Reprinted with permission from Ref. [96]
Fig. 14
Fig. 14
a Diagram illustrating the MOF-stabilised HIPE and derivation of MOA from HIPE. b–d Photographs of the emulsions stabilised by Cu3(BTC)2 with the initial diethyl ether volume fractions of 0.57, 0.43, and 0.29, respectively, demonstrating ability to tune pore size in HIPEs. eg The corresponding confocal laser scanning microscopy images of the above HIPEs (HIPE-1, HIPE-2, and HIPE-3, respectively). Scale bars, 20 µm. Reprinted with permission from Zhang et al. [109]. Copyright CC BY-NC-SA 4.0
Fig. 15
Fig. 15
a Schematic illustration for the formation of hollow Zn–BTC tetrahedroids via a CO2–IL interfacial templating route. b SEM and c TEM images of the hollow tetrahedron-like Zn–BTC microparticles. The N-EtFOSA concentration is 2.0 wt% based on IL and the CO2 pressure is 6.3 MPa. Reprinted with permission from Ref. [113]. Copyright 2014 Elsevier Inc
Fig. 16
Fig. 16
af SEM images of HKUST-1 synthesised in CO2-expanded DMF. a, b 2.0; c, d 4.5; e, f 6.6 MPa. Scale bars, 150, 50, 500, 150, 500, and 150 nm for af, respectively. g The mesopore size distribution curves for the Cu3(BTC)2 synthesised in CO2-expanded DMF at 2.0 MPa (blue curves), 4.5 MPa (red curves) and 6.6 MPa (green curves). Reprinted with permission from Peng et al. [114]. Copyright CC BY-NC-SA 4.0. (Color figure online)
Fig. 17
Fig. 17
a Schematic illustration for the formation of the mesoporous Co-MOF in an IL/SC CO2/surfactant emulsion system. b TEM images of the Co-MOF synthesised in an IL/SC CO2/surfactant emulsion system at 16 MPa and 80 °C for 48 h. Reprinted with permission from Ref. [115]. Copyright 2015 Royal Society of Chemistry
Fig. 18
Fig. 18
Schematic illustration for a HKUST-1 crystallisation and b meso/macropore formation in the CO2-expanded solvent. c SEM images (top) and TEM images (bottom) of HKUST-1 synthesised using scCO2 at 75 bar, 40 °C for more than 24 h, showing introduction of interconnected macropores. Reprinted with permission from Doan et al. [120]. Copyright CC BY-NC-SA 4.0
Fig. 19
Fig. 19
a Schematic of the 3D-printed MOF monolith preparation procedure. b SEM images of 3D-printed MOF-74 (Ni) (b1 and b2) and 3D-printed UTSA-16 (Co) (b3 and b4), showing uniform distribution of MOF crystals and with large voids. c PXRD patterns of 3D-printed MOF-74 (Ni) (c1) and 3D-printed UTSA-16 (Co) (c2) with their powder counterparts, showing crystallinity retained for both MOF-74 (Ni) and UTSA-16 (Co) MOFs after they were extruded into the monolith form. Reprinted with permission from Ref. [146]. Copyright 2017 American Chemical Society
Fig. 20
Fig. 20
3D printed scaffolds: a 4CelloZIF8 and b 4CelloZIF8-Cur. Insets are images representing the pores, with the scale bar representing 0.5 mm. SEM images of c scaffold 4CelloZIF8 and d scaffold 4CelloZIF8-Cur. Scale bar = 1 µm. e PXRD patterns of CelloZIF8 hybrids using different ZIF-8 and f different ZIF-8 loadings while keeping Hmim:Zn to 35:1 and curcumin to 30 mg, showing that the crystallinity and the framework are maintained with different curcumin and Zn loadings. Reprinted with permission from Ref. [149]. Copyright 2019 Wiley-VCH Verlag GmbH & Co. KGaA, Weinheim

References

    1. Nugent P, Giannopoulou EG, Burd SD, Elemento O, Giannopoulou EG, et al. Porous materials with optimal adsorption thermodynamics and kinetics for CO2 separation. Nature. 2013;495:80–84. doi: 10.1038/nature11893. - DOI - PubMed
    1. Jiang DE, Cooper VR, Dai S. Porous graphene as the ultimate membrane for gas separation. Nano Lett. 2009;9:4019–4024. doi: 10.1021/nl9021946. - DOI - PubMed
    1. Steel KM, Koros WJ. Investigation of porosity of carbon materials and related effects on gas separation properties. Carbon. 2003;41:253–266. doi: 10.1016/S0008-6223(02)00309-3. - DOI
    1. Wang QM, Shen D, Bülow M, Lau ML, Deng S, Fitch FR, Lemcoff NO, Semanscin J. Metallo-organic molecular sieve for gas separation and purification. Microporous Mesoporous Mater. 2002;55:217–230. doi: 10.1016/S1387-1811(02)00405-5. - DOI
    1. Rashidi S, Esfahani JA, Karimi N. Porous materials in building energy technologies—a review of the applications, modelling and experiments. Renew. Sustain. Energy Rev. 2018;91:229–247. doi: 10.1016/j.rser.2018.03.092. - DOI

LinkOut - more resources