Review
. 2019 Jun 3;11(1):47.
doi: 10.1007/s40820-019-0277-x.

In Situ X-ray Absorption Spectroscopy Studies of Nanoscale Electrocatalysts

Affiliations
Review

In Situ X-ray Absorption Spectroscopy Studies of Nanoscale Electrocatalysts

Maoyu Wang et al. Nanomicro Lett. .

Abstract

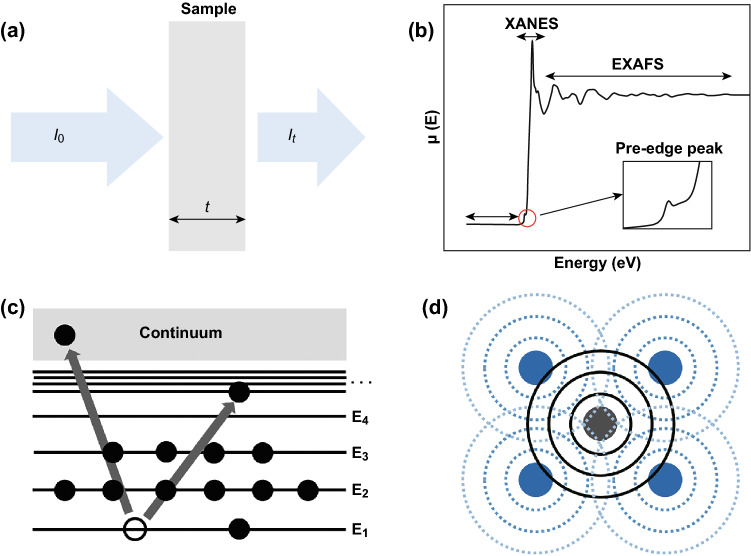
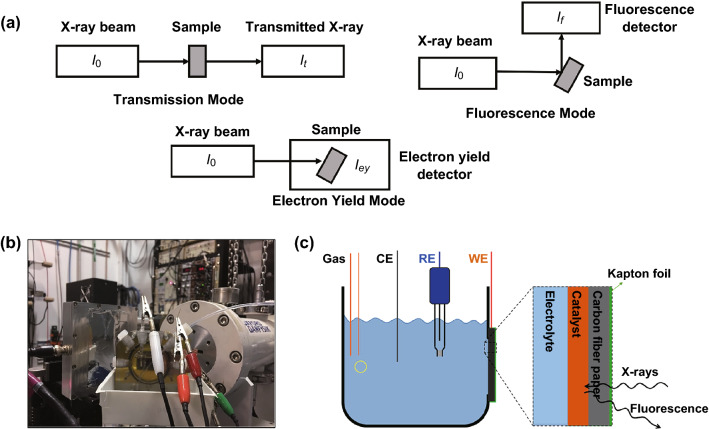
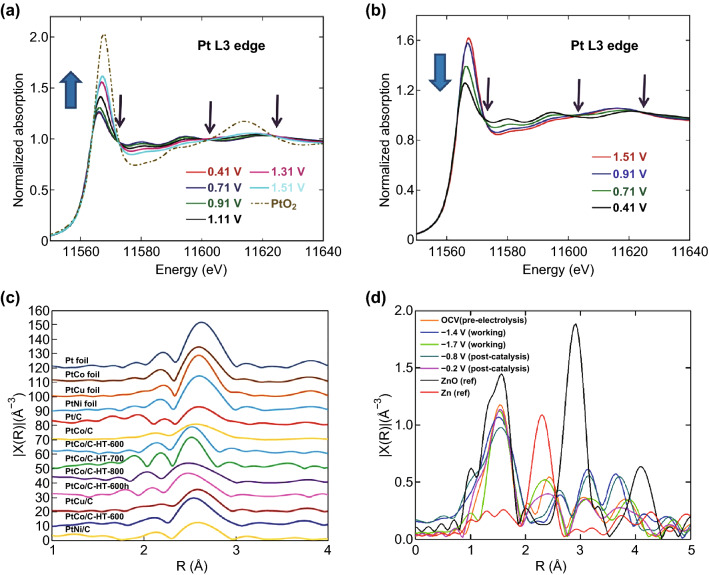
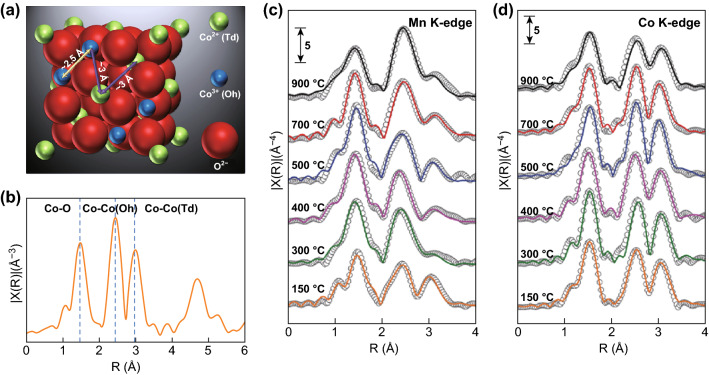
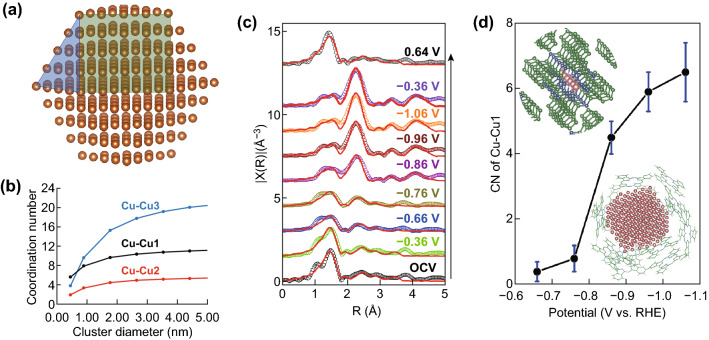
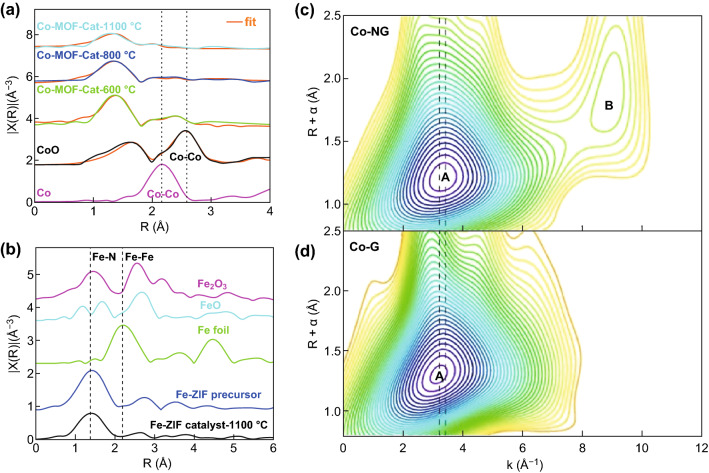
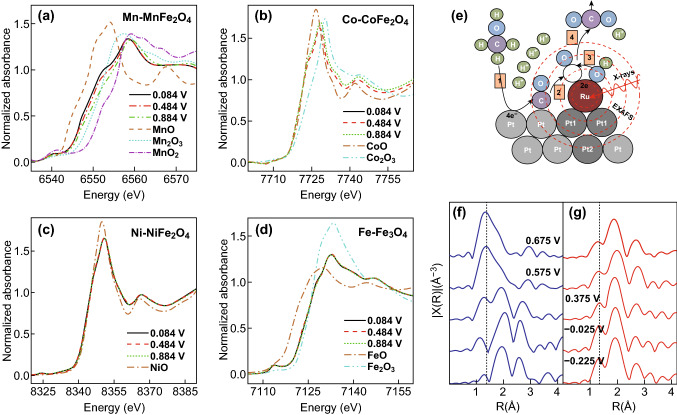
Nanoscale electrocatalysts have exhibited promising activity and stability, improving the kinetics of numerous electrochemical reactions in renewable energy systems such as electrolyzers, fuel cells, and metal-air batteries. Due to the size effect, nano particles with extreme small size have high surface areas, complicated morphology, and various surface terminations, which make them different from their bulk phases and often undergo restructuring during the reactions. These restructured materials are hard to probe by conventional ex-situ characterizations, thus leaving the true reaction centers and/or active sites difficult to determine. Nowadays, in situ techniques, particularly X-ray absorption spectroscopy (XAS), have become an important tool to obtain oxidation states, electronic structure, and local bonding environments, which are critical to investigate the electrocatalysts under real reaction conditions. In this review, we go over the basic principles of XAS and highlight recent applications of in situ XAS in studies of nanoscale electrocatalysts.

Keywords: Electrocatalyst; In situ experiments; Nanoscale; X-ray absorption spectroscopy.


Figures

Fig. 1
Fig. 1
a Schematic of incident and transmitted X-ray beam. b Schematic of XAS including the pre-edge, XANES, and EXAFS regions. c Schematic of the X-ray absorption process and electron excited process, the black circle is electrons. d Schematic of interference pattern creating by the outgoing (solid black lines) and reflected (dashed blue lines) photoelectron waves between absorbing atom (gray) and its nearest atoms (purple). (Color figure online)
Fig. 2
Fig. 2
a Schematic of the experiment setup for three different XAS detection modes: transmission, fluorescence, and electron yield mode. b Photo of a real electrochemical cell for in situ XAS experiment setup. c Schematic structure of the electrochemical cell for in situ XAS setup experiments. Reprinted with permission from Ref. [21]
Fig. 3
Fig. 3
In situ XANES for Pt L3 edge of carbon-supported Pt nanoparticles at potentials a ascending from 0.41 to 1.51 V and b descending from 1.51 to 0.41 V in 1 M HClO4. Also shown (yellowish green dashed line) is ex situ XANES from commercial PtO2. Three distinct isosbestic points are observed at 11.573, 11.603, and 11.624 keV as designated by arrows. Reprinted with permission from Ref. [35]. c Fourier transform of k3-weighted Pt-LIII edge EXAFS oscillation of Pt foil, PtCo, PtCu, PtNi alloy foils, Pt/C, PtCo/C, PtCo/C-HTs, PtCu/C, PtCu/C-HT, and PtNi/C at 0.4 V versus RHE. Reprinted with permission from Ref. [38]. d Fourier transforms of Zn K-edge EXAFS spectra of the PorZn catalyst electrode at different potentials (V vs. SHE). ZnO and Zn are used as references. Reprinted with permission from Ref. [9]
Fig. 4
Fig. 4
Comparison of experimental and simulated C K-edge NEXAFS spectra for 2-H porphine adsorbed on Ag(111) and Cu(111). Reprinted with permission from Ref. [61]
Fig. 5
Fig. 5
a The relation of interatomic distance between atom (Oh) and atom (Td) in spinel structure. b Co K-edge EXAFS spectra for Co3O4, the interatomic distances are shorter than the actual values owing to the fact that Fourier transform (FT) spectra were not phase-corrected. Reprinted with permission from Ref. [63]. EXAFS k3χ(R) spectra (gray circles) and fitting results (solid lines) of MnCo2O4 at c Mn and d Co K-edge. Reprinted with permission from Ref. [3]
Fig. 6
Fig. 6
Cu nanocrystal model and its size-dependent Cu–Cu CNs for the first three shells of nearest neighbors. a A five-shell cuboctahedral Cu nanocrystal model. b Size-dependent Cu–Cu CNs for the first three shells of nearest neighbors for a cuboctahedral Cu nanocrystal. c Fitting results of the EXAFS spectra of the CuPc catalyst at different potentials in CO2-saturated 0.5 M aqueous KHCO3. Fitted R-space. d First-shell Cu–Cu CNs of the CuPc catalyst at different potentials. The upper left inset shows the CuPc crystal structure, and the lower right inset illustrates a possible configuration of the Cu nano-clusters generated under the electrocatalytic conditions. Color key: green-C; blue-N; pink-Cu. Error bars represent the uncertainty of CN determination from the EXAFS analysis. Reprinted with permission from Ref. [21]. (Color figure online)
Fig. 7
Fig. 7
a Co K-edge EXAFS data and fits (orange). Reprinted with permission from Ref. [73]. b Fe K-edge EXAFS spectra for chemically Fe-doped ZIF before and after thermal activation. Reprinted with permission from Ref. [74]. Wavelet transforms for the c Co–NG and d Co–G. The location of the maximum A shifts from 3.2 Å−1 for Co–G to 3.4 Å−1 for Co–NG, indicating the presence of Co–N bonding in Co–NG. The vertical dashed lines are provided to guide the eye. Reprinted with permission from Ref. [77]
Fig. 8
Fig. 8
K-edge XANES spectra of a Mn in MnFe2O4, b Co in CoFe2O4, c Ni in NiFe2O4, and d Fe in Fe3O4 under various applied potentials. Reprinted with permission from Ref. [37]. e Schematic of the surface reaction of the Ru atoms. R-space graphs as a function of applied potential f without (blue) and g with (red) CH3OH. Dotted line placed at ca. 1.4 Å signifying a reference point for the oxygen peaks. Reprinted with permission from Ref. [82]. (Color figure online)

References

    1. Nie Y, Li L, Wei ZD. Recent advancements in Pt and Pt-free catalysts for oxygen reduction reaction. Chem. Soc. Rev. 2015;44(8):2168–2201. doi: 10.1039/c4cs00484a. - DOI - PubMed
    1. Xia W, Mahmood A, Liang ZB, Zou RQ, Guo SJ. Earth-abundant nanomaterials for oxygen reduction. Angew. Chem. Int. Ed. 2016;55(8):2650–2676. doi: 10.1002/anie.201504830. - DOI - PubMed
    1. Wei C, Feng ZX, Scherer GG, Barber J, Shao-Horn Y, Xu ZCJ. Cations in octahedral sites: a descriptor for oxygen electrocatalysis on transition-metal spinels. Adv. Mater. 2017;29(23):1606800. doi: 10.1002/adma.201606800. - DOI - PubMed
    1. Wang ZL, Xu D, Xu JJ, Zhang XB. Oxygen electrocatalysts in metal-air batteries: from aqueous to nonaqueous electrolytes. Chem. Soc. Rev. 2014;43(22):7746–7786. doi: 10.1039/c3cs60248f. - DOI - PubMed
    1. Yuan CZ, Wu HB, Xie Y, Lou XW. Mixed transition-metal oxides: design, synthesis, and energy-related applications. Angew. Chem. Int. Ed. 2014;53(6):1488–1504. doi: 10.1002/anie.201303971. - DOI - PubMed

LinkOut - more resources