. 2020 Jul 13;12(1):147.
doi: 10.1007/s40820-020-00474-6.

Molecular Design of Conjugated Small Molecule Nanoparticles for Synergistically Enhanced PTT/PDT

Affiliations

Molecular Design of Conjugated Small Molecule Nanoparticles for Synergistically Enhanced PTT/PDT

Wei Shao et al. Nanomicro Lett. .

Abstract

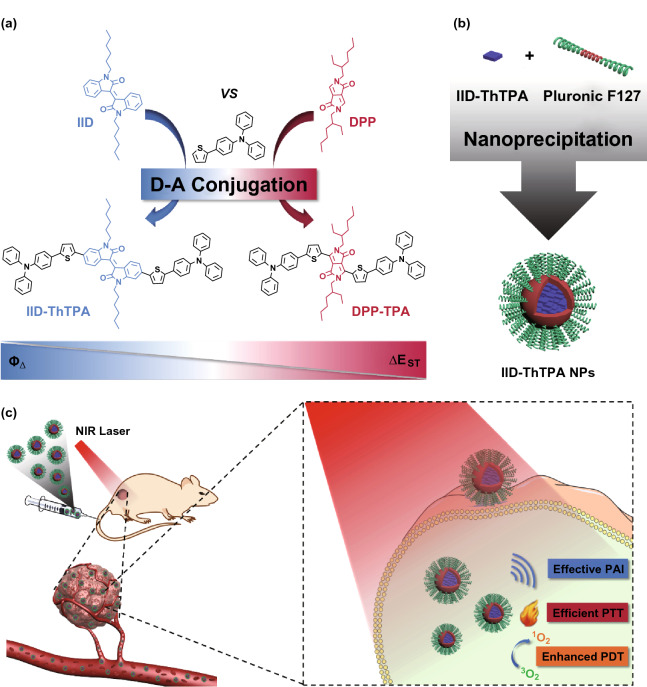
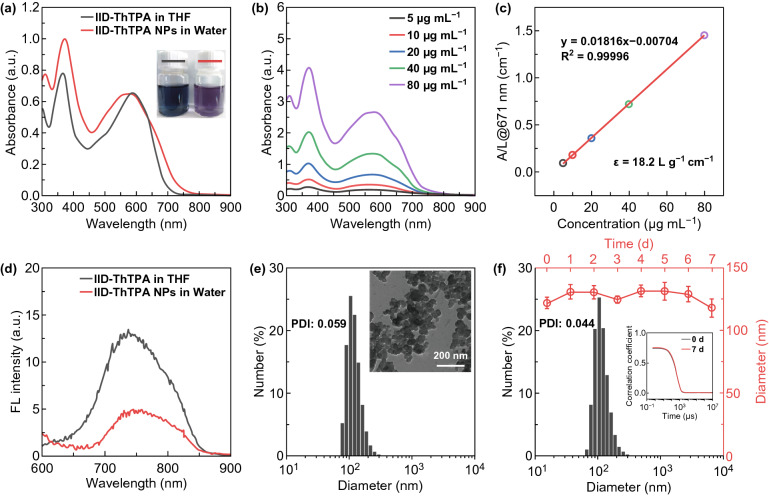
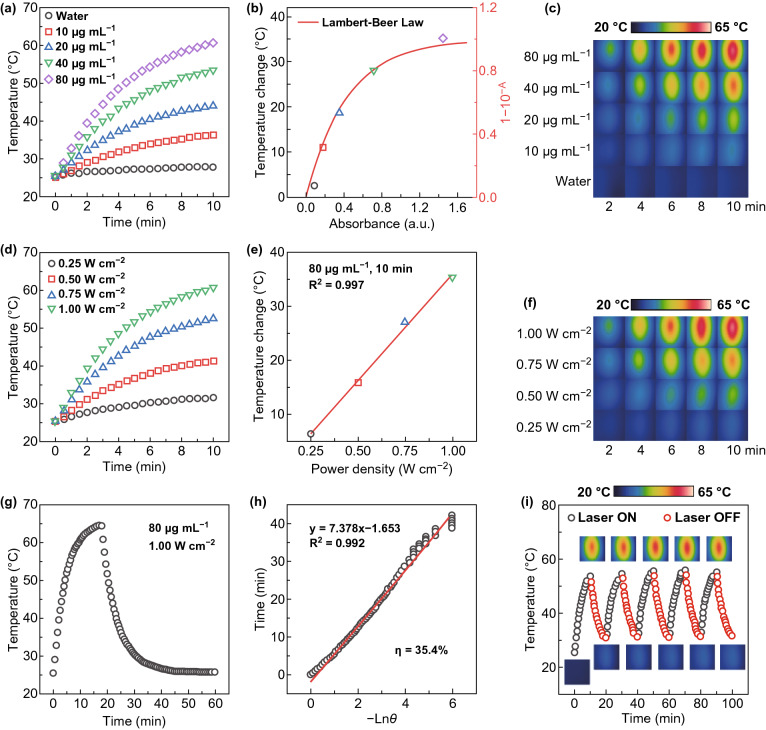
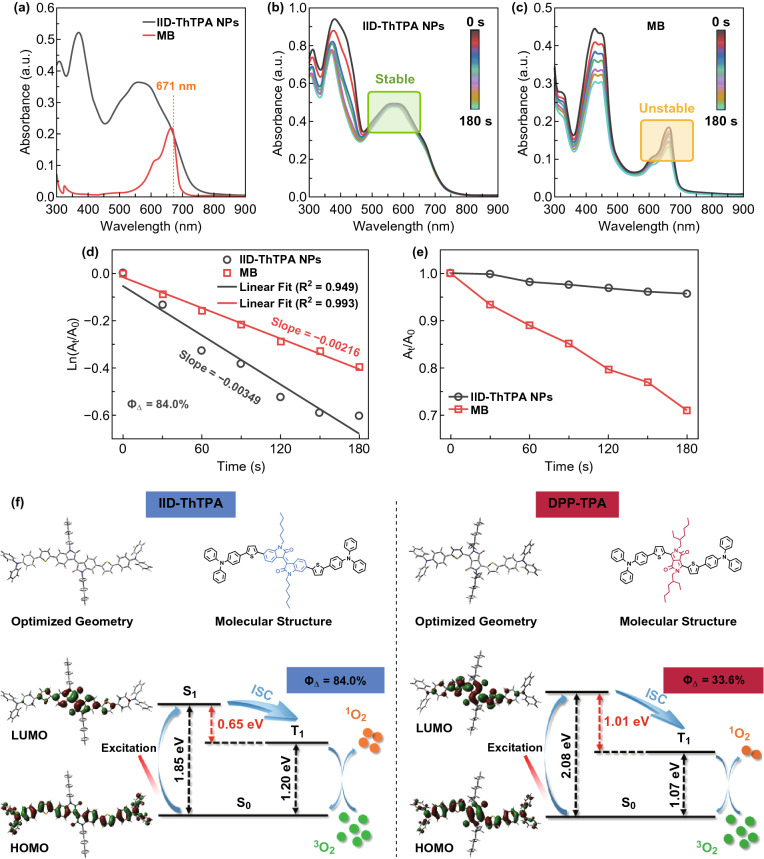
Simultaneous photothermal therapy (PTT) and photodynamic therapy (PDT) is beneficial for enhanced cancer therapy due to the synergistic effect. Conventional materials developed for synergistic PTT/PDT are generally multicomponent agents that need complicated preparation procedures and be activated by multiple laser sources. The emerging monocomponent diketopyrrolopyrrole (DPP)-based conjugated small molecular agents enable dual PTT/PDT under a single laser irradiation, but suffer from low singlet oxygen quantum yield, which severely restricts the therapeutic efficacy. Herein, we report acceptor-oriented molecular design of a donor-acceptor-donor (D-A-D) conjugated small molecule (IID-ThTPA)-based phototheranostic agent, with isoindigo (IID) as selective acceptor and triphenylamine (TPA) as donor. The strong D-A strength and narrow singlet-triplet energy gap endow IID-ThTPA nanoparticles (IID-ThTPA NPs) high mass extinction coefficient (18.2 L g-1 cm-1), competitive photothermal conversion efficiency (35.4%), and a dramatically enhanced singlet oxygen quantum yield (84.0%) comparing with previously reported monocomponent PTT/PDT agents. Such a high PTT/PDT performance of IID-ThTPA NPs achieved superior tumor cooperative eradicating capability in vitro and in vivo.

Keywords: Conjugated small molecule nanoparticles; Isoindigo; Molecular design; Singlet–triplet energy gap; Synergistic PTT/PDT.


Figures

Scheme 1
Scheme 1
Illustration of molecular design of IID-ThTPA, preparation of IID-ThTPA NPs, and biomedical application of IID-ThTPA NPs. a Acceptor-oriented molecular design of IID-ThTPA with narrow singlet–triplet energy gap. b IID-ThTPA NPs prepared by a nanoprecipitation method. c PAI-guided synergistically enhanced PTT/PDT under a single NIR laser irradiation enabled by IID-ThTPA NPs
Fig. 1
Fig. 1
Basic properties of IID-ThTPA and IID-ThTPA NPs. a UV–Vis–NIR absorption spectra of IID-ThTPA in THF and IID-ThTPA NPs in water (20 μg mL−1) (insets are the digital photographs of IID-ThTPA in THF and IID-ThTPA NPs in water). b UV–Vis–NIR absorption spectra of IID-ThTPA NPs with different concentrations. c Mass extinction coefficient of IID-ThTPA NPs at 671 nm. Normalized absorbance intensity at 671 nm divided by the characteristic length of the cell (A/L) at different concentrations (mass extinction coefficient is calculated by the Lambert–Beer law: A/L = εc (L = 1 cm)). d Fluorescence spectra of IID-ThTPA in THF and IID-ThTPA NPs in water (20 μg mL−1) (excitation wavelength: 550 nm). e DLS profile of freshly prepared IID-ThTPA NPs (inset shows the TEM image of IID-ThTPA NPs). f DLS profile of IID-ThTPA NPs after one week’s storage at room temperature and the size change of IID-ThTPA NPs during one week’s storage at room temperature (inset is the autocorrelation functions of IID-ThTPA NPs at 0 and 7 days, respectively)
Fig. 2
Fig. 2
Photothermal effect of IID-ThTPA NPs. a Photothermal heating curves of IID-ThTPA NPs with different concentrations (671 nm, 1.00 W cm−2). b Plot of the temperature changes of IID-ThTPA NPs versus the absorbance at different concentrations with a fitted curve derived from Lambert–Beer law. c Infrared thermographs of IID-ThTPA NPs with different concentrations under laser irradiation at various time points (671 nm, 1.00 W cm−2). d Photothermal heating curves of IID-ThTPA NPs (80 μg mL−1) under 671-nm laser irradiation with different power densities. e Plot of the temperature changes of IID-ThTPA NPs versus the laser power densities with a linearly fitted line. f Infrared thermographs of IID-ThTPA NPs (80 μg mL−1) under 671-nm laser irradiation with different power densities at various time points. g Photothermal heating curve to calculate the photothermal conversion efficiency. IID-ThTPA NPs (80 μg mL−1) were irradiated by a 671-nm laser with a power density of 1.00 W cm−2 to reach a temperature plateau; then, the laser was shut off and the temperature was allowed to cool to room temperature naturally. h Plot of linear time data from the cooling period of IID-ThTPA NPs versus negative natural logarithm of the driving force temperature (θ). i Photothermal heating curve of IID-ThTPA NPs (40 μg mL−1) for five laser on/off cycles under irradiation (671 nm, 1.00 W cm−2) (insets are the infrared thermographs of IID-ThTPA NPs at different time points during the laser on/off cycles)
Fig. 3
Fig. 3
Singlet oxygen-generating capability of IID-ThTPA NPs. a UV–Vis–NIR absorption spectra of IID-ThTPA NPs and a standard reference MB in water. Degradation of DPBF in the presence of b IID-ThTPA NPs and c MB under laser irradiation. Degradation kinetics of DPBF in the presence of IID-ThTPA NPs and MB under laser irradiation, where d A0 and At are the characteristic absorbance of DPBF at 410 nm before and after laser irradiation, respectively; e A0 and At are the absorbance at 580 nm (IID-ThTPA NPs) or 665 nm (MB) before and after laser irradiation, respectively. f DFT-calculated optimized geometries, HOMOs, LUMOs, S1, and T1 energy levels of IID-ThTPA and a previously reported conjugated small molecule DPP-TPA to depict the ultrahigh singlet oxygen quantum yield of IID-ThTPA NPs
Fig. 4
Fig. 4
In vitro phototherapy of IID-ThTPA NPs. a CLSM images of 4T1 cells after incubating with IID-ThTPA-RITC NPs for different times (1, 2, 4, and 6 h). b Quantitative analysis of RITC fluorescence intensity in a. c Cell viability of 4T1 cells incubating with IID-ThTPA NPs (0, 5, 10, 20, 40, and 80 μg mL−1) under different experimental conditions (dark, PTT, PDT, and PTT + PDT) (the results are presented as mean ± SD, n = 6). d Intracellular ROS level of 4T1 cells under different treatments (control, IID-ThTPA NPs, laser, and IID-ThTPA NPs + laser). e Quantitative analysis of DCF fluorescence intensity in d
Fig. 5
Fig. 5
In vivo PAI-guided phototherapy enabled by IID-ThTPA NPs. a PA images of the tumor sites at 680 nm at different time points post-injection (0, 2, 4, 6, 12, and 24 h). b Infrared thermographs of the mice under laser irradiation (671 nm, 1.00 W cm−2) in laser and IID-ThTPA NPs + laser groups. c Tumor temperature elevation curves of the mice under laser irradiation (671 nm, 1.00 W cm−2) in laser and IID-ThTPA NPs + laser groups. d Tumor volume variation curves of the mice in control, IID-ThTPA NPs, laser, IID-ThTPA NPs + Vc + laser (PTT), and IID-ThTPA NPs + laser (PTT + PDT) groups during the treatment period (the results are presented as mean ± SD, **P < 0.01 by two-tailed unpaired Student’s t tests, n = 5). e Digital photographs of the tumors dissected from the mice in control, IID-ThTPA NPs, laser, IID-ThTPA NPs + Vc + laser (PTT), and IID-ThTPA NPs + laser (PTT + PDT) groups at the end of treatment. f Tumor weights of the mice in control, IID-ThTPA NPs, laser, IID-ThTPA NPs + Vc + laser (PTT), and IID-ThTPA NPs + laser (PTT + PDT) groups at the end of treatment (the results are presented as mean ± SD, **P < 0.01 by two-tailed unpaired Student’s t tests, n = 5). g H&E, Ki-67, and TUNEL staining of tumors of the mice after different treatments. h H&E staining of the major organs (heart, liver, spleen, lung, and kidney) of the mice after different treatments
Fig. 6
Fig. 6
In vivo toxicity evaluation. a Hematological index (WBC, RBC, HGB, HCT, MCH, MCHC, MCV, and PLT) of the mice in control, 7 d post-injection, and 14 d post-injection groups. b Biochemical blood analysis (ALT, AST, BUN, CREA, and TBIL) of the mice in control, 7 d post-injection, and 14 d post-injection groups (the results are presented as mean ± SD, n = 3)

References

    1. Ferrari M. Cancer nanotechnology: opportunities and challenges. Nat. Rev. Cancer. 2005;5:161–171. doi: 10.1038/nrc1566. - DOI - PubMed
    1. Cai Y, Si W, Huang W, Chen P, Shao J, Dong X. Organic dye based nanoparticles for cancer phototheranostics. Small. 2018;14:1704247. doi: 10.1002/smll.201704247. - DOI - PubMed
    1. Cheng L, Wang C, Feng L, Yang K, Liu Z. Functional nanomaterials for phototherapies of cancer. Chem. Rev. 2014;114:10869–10939. doi: 10.1021/cr400532z. - DOI - PubMed
    1. Gai S, Yang G, Yang P, He F, Lin J, Jin D, Xing B. Recent advances in functional nanomaterials for light–triggered cancer therapy. Nano Today. 2018;19:146–187. doi: 10.1016/j.nantod.2018.02.010. - DOI
    1. Peer D, Karp JM, Hong S, Farokhzad OC, Margalit R, Langer R. Nanocarriers as an emerging platform for cancer therapy. Nat. Nanotechnol. 2007;2:751–760. doi: 10.1038/nnano.2007.387. - DOI - PubMed

LinkOut - more resources