Review
. 2021 Mar 3;13(1):82.
doi: 10.1007/s40820-021-00603-9.

2D Nanomaterials for Effective Energy Scavenging

Affiliations
Review

2D Nanomaterials for Effective Energy Scavenging

Md Al Mahadi Hasan et al. Nanomicro Lett. .

Abstract

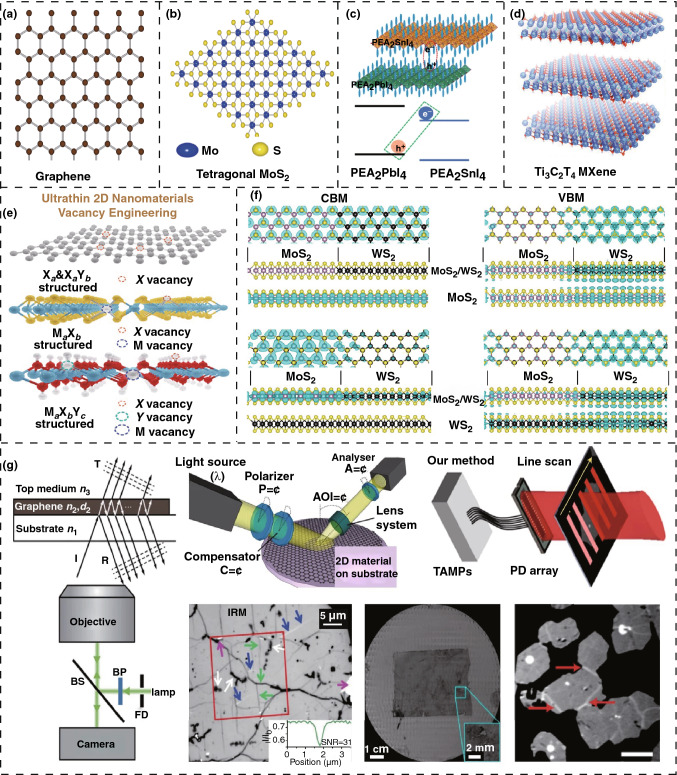
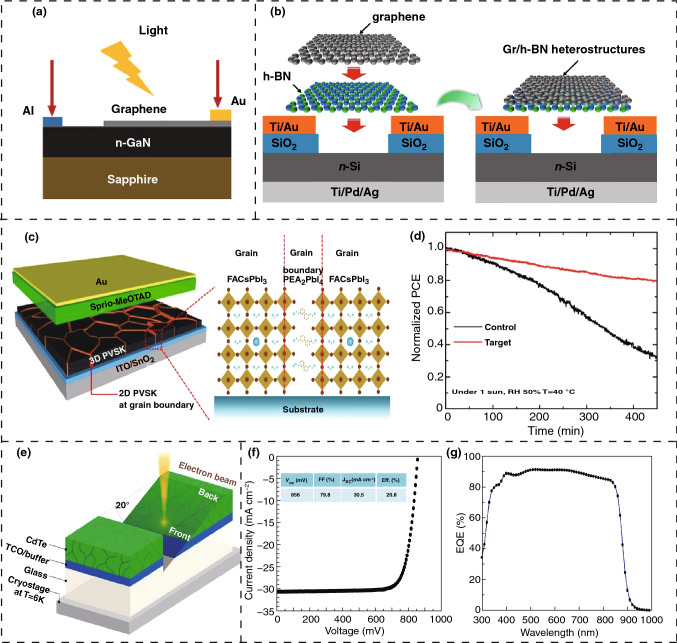
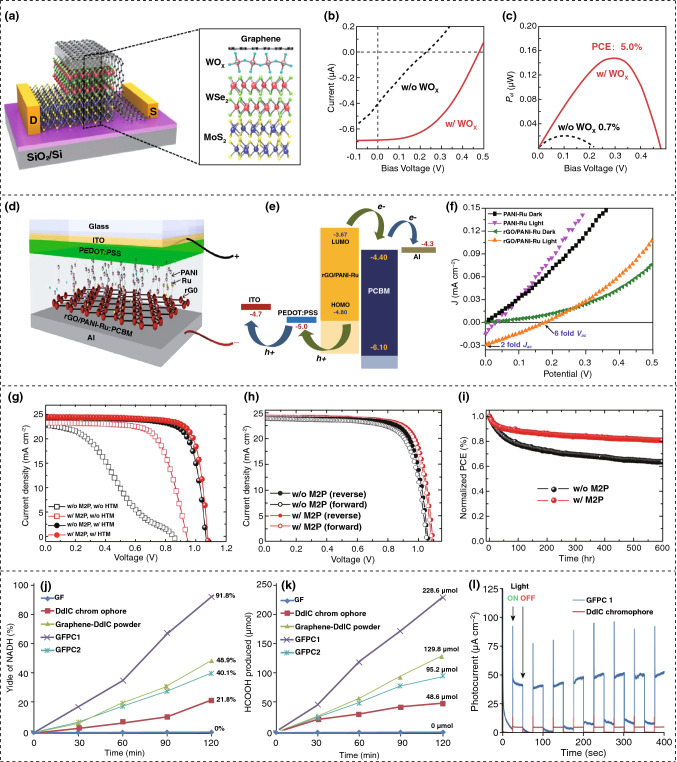
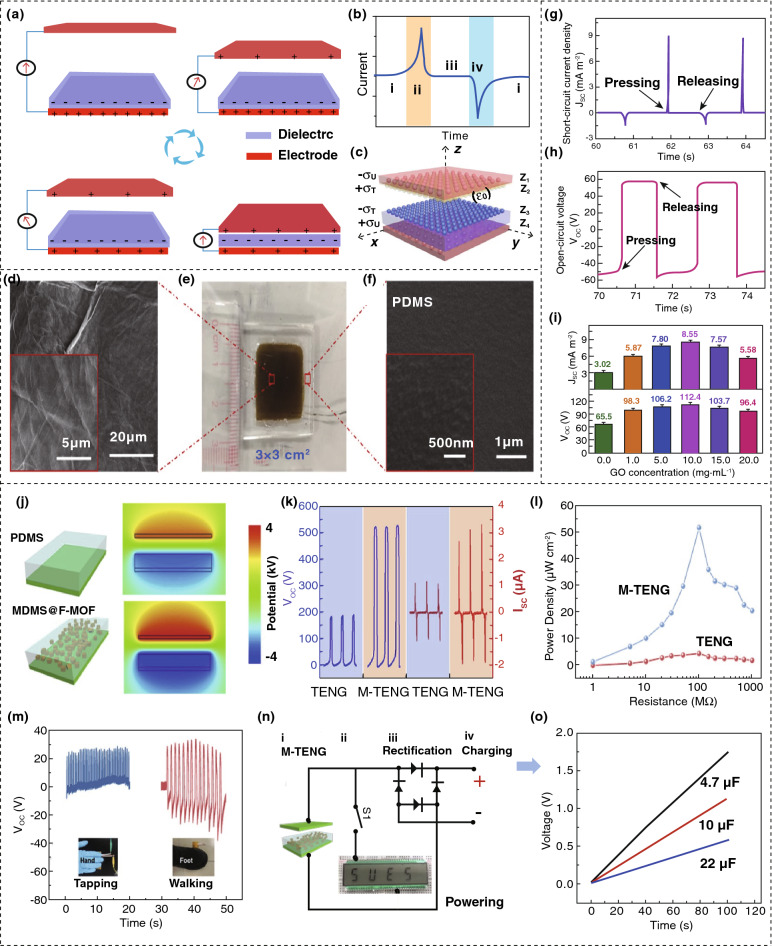
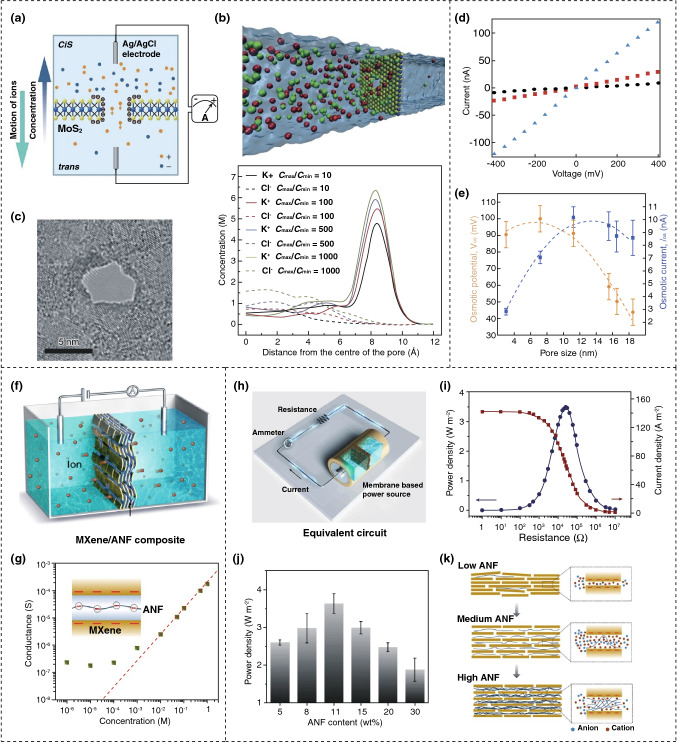
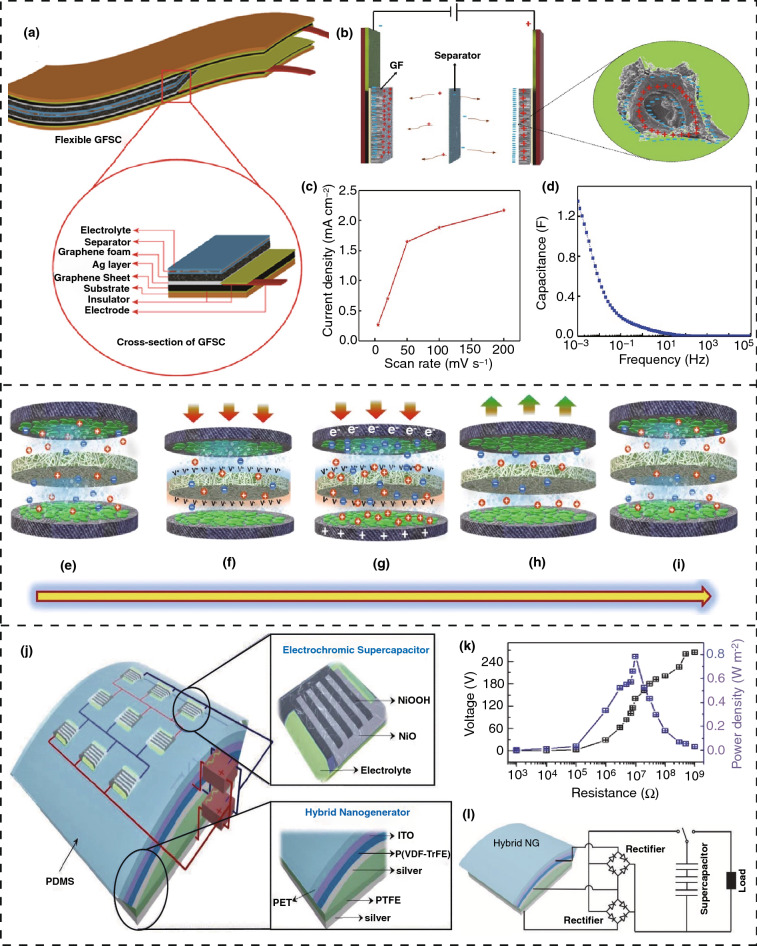
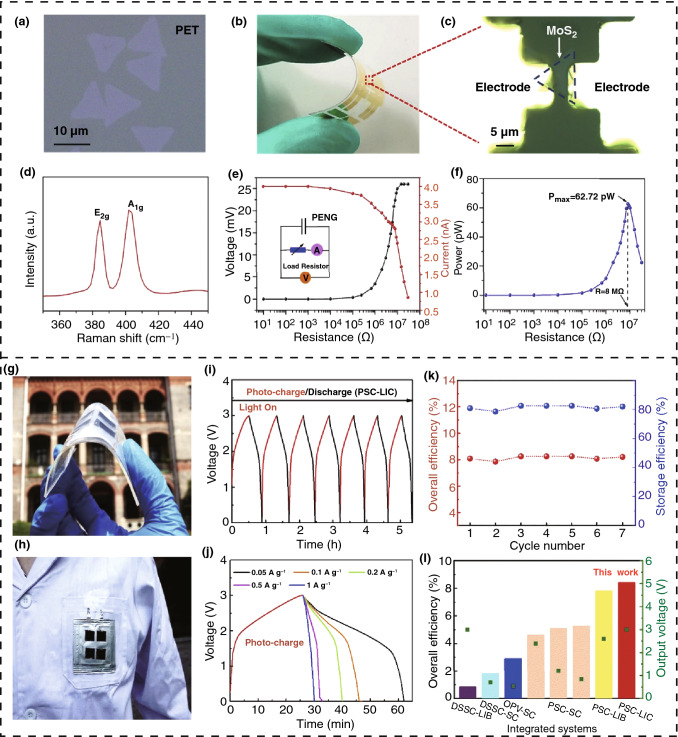
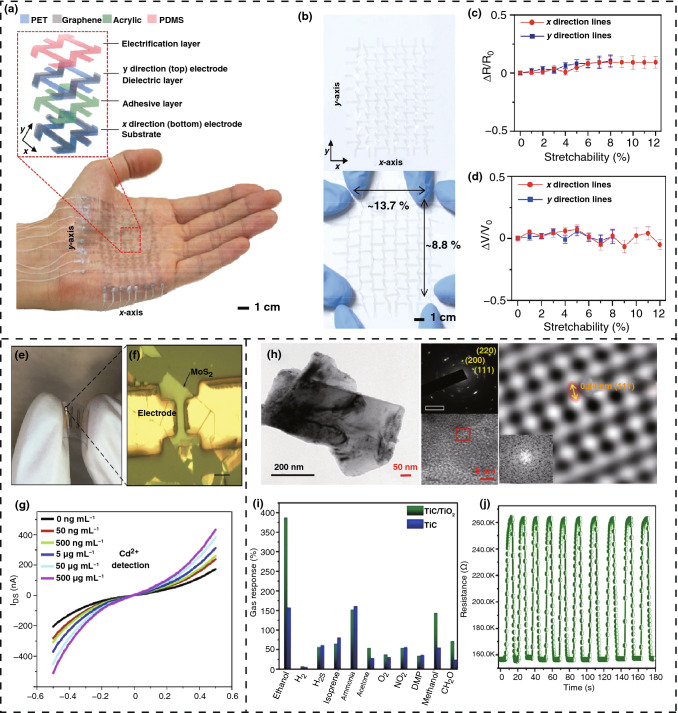
The development of a nation is deeply related to its energy consumption. 2D nanomaterials have become a spotlight for energy harvesting applications from the small-scale of low-power electronics to a large-scale for industry-level applications, such as self-powered sensor devices, environmental monitoring, and large-scale power generation. Scientists from around the world are working to utilize their engrossing properties to overcome the challenges in material selection and fabrication technologies for compact energy scavenging devices to replace batteries and traditional power sources. In this review, the variety of techniques for scavenging energies from sustainable sources such as solar, air, waste heat, and surrounding mechanical forces are discussed that exploit the fascinating properties of 2D nanomaterials. In addition, practical applications of these fabricated power generating devices and their performance as an alternative to conventional power supplies are discussed with the future pertinence to solve the energy problems in various fields and applications.

Keywords: 2D nanomaterials; Osmotic power generation; Self-powered sensor; Solar energy; Tribo-/piezo-/thermo-/pyro-electricity.


Figures

Fig. 1
Fig. 1
Introduction of some nanomaterials and some modifications. a A single-layer graphene sheet. b Transition metal dichalcogenide. c Heterostructure of 2D perovskite. d Ti3C2Tx MXene. e Diagram of 2D nanomaterial structure and type of vacancy(s). f CBM and VBM’s charge density in lateral heterostructure of MoS2/WS2. g Characterization techniques to detect abnormalities using optical methods. Figures reprinted with permission from: a Ref. [23], © 2014 American Institute of Physics; b Ref. [30] © 2016 Elsevier; c Ref. [37], © 2020 Nature; d Ref. [38], © 2019 Wiley; e Ref. [54], © 2020 Wiley; f Ref. [56], © 2015 American Chemical Society; g Ref. [28], © 2019 Nature
Fig. 2
Fig. 2
Mechanism of solar energy scavenging through solar cells. a Diagram of nanodevice based on heterojunction of Graphene/n-GaN. b Schematic of solar cell fabricated through one- and two-step method. c Two-dimensional perovskite at grain boundary of device d Tracking of highest powerpoint of the device with no encapsulation under normal condition. e Sample excitation with electron beam. f Current density–voltage curve for the device with As doping without any Cu addition. g Relative EQE values with wavelengths. Figures reprinted with permission from: a Ref. [62], © 2017 American Institute of Physics; b Ref. [63], © 2016 Elsevier; c, d Ref. [66], © 2018 Nature; e, f, g Ref. [64], © 2019 Nature
Fig. 3
Fig. 3
Solar energy harvesting mechanism and performances of the 2D nanomaterial-based scavenging devices. a Schematic of device with WOx layer. b Photovoltaic properties without (black) and with (red) WOx being excited by laser ray. c Electrical power plot with extended photoconversion efficiency to 5%. d Schematic of the fabrication of perovskite solar cell having an electron donor of rGO/PANI-Ru, e PSC’s energy-generating curve. f Electrical characteristics of device. g Current density voltage characteristics under both M2P and OMeTAD condition. h Plot of current density and voltage with spiro-OMeTAD along with M2P condition. i Stable performance of device under inert surroundings. j NADH regeneration. k Formic acid generation from CO2. l Photocurrent characteristics by applying simulated 1 sun illumination. Figures reprinted with permission from: a, b, c Ref. [67], © 2020 American Chemical Society; d, e, f Ref. [68], © 2017 Nature; g, h, i Ref. [69], © 2020 Wiley; j, k, l Ref. [77], © 2018 Nature. (Color figure online)
Fig. 4
Fig. 4
Mechanism of triboelectric power generation and device performances. a Basic operating principle of CS-TENG on applying an external force. b Generated current of device in a complete cycle. c 3D model of CS-TENG for analyzing output performances. d Schematic of GO by scanning electron microscope. e Image of GO LS-TENG. f, PDMS film imaged via SEM. g Output current when the circuit is shorted. h Output voltage when the circuit is open. i Concentration effect of GO on output current and voltage. j Distribution of electric fields generated by TENG and M-TENG using finite element simulation. k Electrical outputs from TENG and mTENG. l Output power according to load resistances. m Resulting voltage from human motion. n Required circuit diagram for supplying power to LCD and charging capacitors through rectification. o Powering curves for capacitors up to 100 s. Figures reprinted with permission from: a, b, c Ref. [80], © 2020 Elsevier; d, e, f, g, h, i Ref. [82], © 2019 Elsevier; j, k, l, m, n, o Ref. [83], © 2020 Elsevier
Fig. 5
Fig. 5
Schematics of structure and output performances of triboelectric nanogenerators. a Image of the adjacent MoS2 crystal divided into three grains from atomic force microscope and their current distribution in the three regions. b Cross-sectional current lines in the grains. c Spectrum of current–voltage characteristics of the grains 2. d Schematic of the triboelectric nanogenerator. e Rectified output voltage from the device. f Schematic of triboelectric nanogenerator with a single electrode based on reduced graphene oxide nanoribbons/ polyvinylidene fluoride. g Generated charges of Al foil, which decreases with the increasing gap between the film and foil. h Stable operation of triboelectric nanogenerator for 500 cycles. i Comparison of triboelectric generator voltage while fabricated by porous and solid nanocomposites. j Output voltage, current, and power. k Performance in powering a lithium coin cell. Figures reprinted with permission from: a, b, c Ref. [84], © 2018 Nature; d, e Ref. [85], © 2020, Elsevier; g, h, i Ref. [71], © 2016 Nature; j, k, l Ref. [72], © 2018 Nature
Fig. 6
Fig. 6
Device structure, working mechanism, and performance of piezoelectric energy generation. a A two-dimensional ZnO-based nanogenerator fabricated nano-clay-layered heterojunction and its working principle for energy scavenging. b A typical flexible nanogenerator based on single-layered MoS2 nanoflake, including device image in inset. c Operating mechanism of the piezoelectric. d Resulting voltage and current according to the external vertical. e Plot of load–displacement of nanorods and nanosheets derived from ZnO. f Relation between the piezoelectric response and applied external strain. g Three-dimensional structure of ZnO nanosheet-based piezoelectric nanogenerator. h Effect of applied force on voltage and current. i Piezoelectric current along with power densities of the device with an external circuit resistance. Figures reprinted with permission from: a, d, e Ref. [93], © 2013 Nature; b, c, f Ref. [94], © 2020 Elsevier; g, h, i Ref. [95], © 2014 Nature
Fig. 7
Fig. 7
Thermoelectric device structure, the working principle, and output performances of thermoelectric devices. a Mechanism of thermoelectric power generation due to Seebeck effect. b Device architecture for thermoelectric measurement. c Curve of Seebeck coefficient versus temperature. d Peak value of Seebeck coefficient according to temperature. e Thermoelectric nanogenerator based on p–n junction. f WS2 planar film as n-leg, while depositing in the fabrication process. g Current density–voltage characteristics of MoS2. h Current density–voltage characteristics of WS2. i Power factor of the MoS2 device. j Roll-to-roll arrangement for deposition on substrate. k Output voltage vs. temperature plots. l Plot of resistance and output power with changing temperature. Figures reprinted with permission from: a Ref. [101], © 2017, Royal Society of Chemistry; b, c, d Ref. [102], © 2019 Nature; e, f, g, h, i Ref. [103], © 2020 Nature; j, k, l Ref. [87], © 2019 Nature
Fig. 8
Fig. 8
Device fabrication and output performances of pyroelectric nanogenerators. a Illustration of device structure. b Power density. c Scaled efficiency of the device. d Comparison of this work with other reports. e Application of Ericsson cycle with varying temperature (blue line) and electric field (red line). f Implementing a periodic current across the relaxor. g Output current and resulting polarization in response to varying temperatures. h Schematic of device with a graphene channel and floating gate. i Device circuit diagram. j Accumulated pyroelectric charge according to pad area. k Schematic structural diagram. l Device responsivity with detectivity. m Responding period of the pyro and photoelectric effect. Figures reprinted with permission from: a, b, c, d, e, f, g Ref. [112], © 2018 Nature; h, i, j Ref. [113], © 2017 Nature; k, l, m Ref. [114], © 2020 Wiley. (Color figure online)
Fig. 9
Fig. 9
Working mechanism of osmotic power generation. a Arrangement of module by membrane separating the solutions with different density. b A simulated distribution of ions in solution. c MoS2 nanopore membrane, drilled with transmission electron microscope with 5 nm diameter. d Output current, and voltage according to the pore size. e Osmotic voltage and current according to pore size. f Schematic of the device arrangement. g Calculation of conduction with the varying concentrations. h Setup for transporting generated power to external load circuit. i Generated power density by the membrane. j Effect of aramid nano-fiber concentration on output power. k Illustration of aramid nano-fiber fraction on overall energy conversion. Figures reprinted with permission from: a, b, c, d, e Ref. [122], © 2016 Nature; f, g, h, i, j, k Ref. [13], © 2019 Nature
Fig. 10
Fig. 10
Self-charging mechanism and supercapacitor performances. a Cross section of graphene foam supercapacitor. b Electrochemical reactions of the electrolyte ions on the surface of the electrodes. c Current density plot with the scan rate. d Capacitance of the fabricated supercapacitor. e Initial state of the siloxene supercapacitor. f Migrating electrolyte ions toward the electrodes due to the piezoelectric effect. g The new equilibrium state after the piezoelectrochemical reaction. h Effect of removing the compression; the disappearance of piezoelectric field. i Returning to the initial state after a complete self-charging cycle. j Schematic of the compact power device with the electrochromic supercapacitors and hybrid nanogenerator. k External load effect on the output voltage and power density. l The circuit diagram of rectification of the generated power from the device. Figures reprinted with permission from: a, b, c, d Ref. [126], © 2021 Elsevier; e, f, g, h, i Ref. [127], © 2020 Nature; j, k, l Ref. [131], © 2016 Wiley
Fig. 11
Fig. 11
Nanogenerator-based self-powered sensors based on 2D nanomaterials. a Image of single-layer MoS2 flake via optical microscope. b Image of flexible piezoelectric nanogenerator. c Image of two electrode-based piezoelectric MoS2 device. d Raman spectrum of the flake. e Resulting voltage and current with measurement circuit in inset. f Measured power according to external resistance. g Image of flexible perovskite solar cell-oriented photo rechargeable lithium-ion device. h Image of device adhered to cloths for real-world application. i Voltage–time characteristics of the device. j Voltage–time characteristics. k Efficiencies of the device. l Comparison of device performance with other integrated systems. Figures reprinted with permission from: a, b, c, d, e, f Ref. [131], © 2019 Elsevier; g, h, i, j, k Ref. [135], © 2019 Elsevier
Fig. 12
Fig. 12
Nanogenerator-based sensors based on 2D nanomaterials. a Microscopic diagram of the fabricated device along with graphene electrodes. b Stretching behavior and extension lengths in both directions of the triboelectric nanogenerator sensor. c Relation between stretch level and resistance. d Variation of output voltage with applied stretch. e Chip photograph. f Microscopic image of the MoS2 sensor. g Effect of concentration of Cd2+ ions on sensor response. h Transmission electron microscopic photo of the selected area electron diffraction patterns and the orientation of planes. i Selectivity of the device. j Reproducibility of the fabricated sensor in ethanol exposure up to 10 cycles. Figures reprinted with permission from: a, b, c, d Ref. [137], © 2019 Elsevier; e, f, g Ref. [138], © 2019 Elsevier; h, i, j Ref. [139], © 2019 American Chemical Society
Fig. 13
Fig. 13
A brief timeline profile of major achievements in the field of nanogenerator research

References

    1. Novoselov KS, Geim AK, Morozov SV, Jiang D, Zhang Y, et al. Electric field effect in atomically thin carbon films. Science. 2004;306(5696):666–669. doi: 10.1126/science.1102896. - DOI - PubMed
    1. Butler SZ, Hollen SM, Cao L, Cui Y, Gupta JA, et al. Progress, challenges, and opportunities in two-dimensional materials beyond graphene. ACS Nano. 2013;7(4):2898–2926. doi: 10.1021/nn400280c. - DOI - PubMed
    1. Hu J, Guo Z, Mcwilliams PE, Darges JE, Druffel DL, et al. Band gap engineering in a 2D material for solar-to-chemical energy conversion. Nano Lett. 2016;16(1):74–79. doi: 10.1021/acs.nanolett.5b02895. - DOI - PubMed
    1. Meyer JC, Geim AK, Katsnelson MI, Novoselov KS, Booth TJ, et al. The structure of suspended graphene sheets. Nature. 2007;446(7131):60–63. doi: 10.1038/nature05545. - DOI - PubMed
    1. Tao H, Fan Q, Ma T, Liu S, Gysling H, et al. Two-dimensional materials for energy conversion and storage. Prog. Mater. Sci. 2020;111:100637. doi: 10.1016/j.pmatsci.2020.100637. - DOI

LinkOut - more resources