. 2021 May 19;7(21):eabf0907.
doi: 10.1126/sciadv.abf0907. Print 2021 May.

Comparative evaluation of isogenic mesodermal and ectomesodermal chondrocytes from human iPSCs for cartilage regeneration

Affiliations

Comparative evaluation of isogenic mesodermal and ectomesodermal chondrocytes from human iPSCs for cartilage regeneration

Ming-Song Lee et al. Sci Adv. .

Abstract

Generating phenotypic chondrocytes from pluripotent stem cells is of great interest in the field of cartilage regeneration. In this study, we differentiated human induced pluripotent stem cells into the mesodermal and ectomesodermal lineages to prepare isogenic mesodermal cell-derived chondrocytes (MC-Chs) and neural crest cell-derived chondrocytes (NCC-Chs), respectively, for comparative evaluation. Our results showed that both MC-Chs and NCC-Chs expressed hyaline cartilage-associated markers and were capable of generating hyaline cartilage-like tissue ectopically and at joint defects. Moreover, NCC-Chs revealed closer morphological and transcriptional similarities to native articular chondrocytes than MC-Chs. NCC-Ch implants induced by our growth factor mixture demonstrated increased matrix production and stiffness compared to MC-Ch implants. Our findings address how chondrocytes derived from pluripotent stem cells through mesodermal and ectomesodermal differentiation are different in activities and functions, providing the crucial information that helps make appropriate cell choices for effective regeneration of articular cartilage.


Figures

Fig. 1
Fig. 1. Differentiation of blood-derived hiPSCs toward isogenic MC-Chs and NCC-Chs.
(A) Schematic of procedures inducing differentiation from hiPSCs to chondrocytes and corresponding timelines. hiPSCs were induced to differentiate into MCs and NCCs and then into MC-Chs and NCC-Chs, respectively. D, day. (B) Morphology of mesodermal and ectomesodermal lineage cells determined by microscopic imaging. (C) Immunofluorescence staining of hiPSC-derived MCs for detection of alpha-smooth muscle actin (α-SMA) and CD34 at day 8 and that of hiPSC-derived NCCs for detection of P75 and human natural killer 1 (HNK1) at day 15. Nuclear DNA was labeled by 4′,6-diamidino-2-phenylindole (DAPI). (D) Representative macrographs and volume quantification of MC-Ch and NCC-Ch pellets. (E) MC-Ch and NCC-Ch pellets stained by Alcian Blue. (F) Quantification of glycosaminoglycan (GAG) in MC-Ch and NCC-Ch pellets analyzed by dimethylmethylene blue. (G) Flow cytometry analysis of cells for detection of chondrocyte-related markers, CD44 and CD151. (H) Immunofluorescence staining of MC-Ch and NCC-Ch pellets for detection of COL1A1, COL2A2, and COL10A1. Nuclear DNA was labeled with DAPI. (I) Dynamics of the mRNA expression of pluripotency markers (OCT4, NANOG, and SOX2), mesoderm-associated markers (GATA4, FOXA2, CXCR4, KDR, MIXL1, and CDH1), neural crest–associated markers (SOX1, PAX6, ZIC1, and P75), and cartilage-associated markers (SOX9, ACAN, COL1A1, COL2A1, and COL10A1) during differentiation of hiPSCs into chondrocytes. Bars are color-coded to represent different cell types. N.D., not detected. n = 3. *P < 0.05, **P < 0.01, ***P < 0.001. Scale bars, 200 μm.
Fig. 2
Fig. 2. Subcutaneous implantation of human MC-Chs and NCC-Chs in mice.
(A) Depiction of the experimental procedure of in vitro chondrogenic induction and subcutaneous implantation of MC-Ch and NCC-Ch pellets. Macrographs and volume quantification of cell pellets before and after implantation were shown. (B) Implanted MC-Ch and NCC-Ch pellets analyzed by hematoxylin and eosin (H&E) and Safranin O/Fast Green staining. Dashed boxed areas in the left column are shown at a higher magnification in the right column for each staining. (C) Immunofluorescence staining of implanted MC-Ch and NCC-Ch pellets for detection of human vimentin to distinguish implanted human cells from host mice cells. Nuclear DNA was labeled with DAPI. (D) Immunofluorescence staining of implanted MC-Ch and NCC-Ch pellets for detection of COL1A1, COL2A1, and COL10A1. Nuclear DNA was labeled with DAPI. n = 3. *P < 0.05 and **P < 0.01, Scale bars, 200 μm.
Fig. 3
Fig. 3. Implantation of human MC-Ch and NCC-Ch pellets in rat joints.
(A) Schematic of chondrocyte pellet implantation. The pellet placed in the joint defect was covered with fibrin glue for secure integration with host tissue. (B) Repair of cartilage defects 4 and 16 weeks after pellet implantation. The control shown is contralateral joints of animals receiving implants. Black arrows point to the site of implantation. (C) ICRS-I scoring for visual assessment of repaired rat joints. (D) Immunofluorescence staining of the regenerated cartilage for detection of human vimentin. Nuclear DNA was labeled with DAPI. (E) Rat femur joints analyzed by H&E staining. (F) Rat joints analyzed by Safranin O/Fast Green staining. Solid boxed (superficial) and dashed boxed (subchondral bone) areas in the left column are shown at a higher magnification in the central and right column, respectively. (G) ICRS-II scoring for histological assessment of regenerated cartilage. n = 3. *P < 0.05, **P < 0.01, ***P < 0.001. Scale bars, 200 μm.
Fig. 4
Fig. 4. Comparison of global transcriptome profiles between hiPSC-derived and NCs.
(A) Multidimensional scaling plot depicting visualization of principal components analysis and variations in MC-Chs, NCC-Chs, and NCs. (B) Relationships between each sample group shown in a heatmap. Each entry is colored on the basis of its dissimilarity to other samples, and the rows and columns are reordered according to the hierarchical clustering. A dendrogram depicts the hierarchical arrangement of the samples produced by the hierarchical clustering. n = 3. (C) Smearplots presenting differences in the global transcript expression comparison between MC-Chs, NCC-Chs, and NCs. Red and blue dots denote individual up- and down-regulated genes, respectively, at the significance threshold of adjusted P value of 0.05. Gray dots reflect those genes with no statistically significant differential expression. Percentages of the up-regulated (Up), down-regulated (Down), and nonsignificant (NS) genes are shown in corresponding pie charts. (D) Gene Ontology enrichment analysis comparison between MC-Chs, NCC-Chs, and NCs. Categories of the most differentially expressed gene sets with P < 0.05 are shown. The number of genes in each enrichment category is represented by the length of an individual bar. *Negative regulation of multicellular organismal process. (E) Analysis of Kyoto Encyclopedia of Genes and Genomes (KEGG) pathway enrichment identifying abundance of differentially expressed genes in predominant biological categories comparison between MC-Chs, NCC-Chs, and NCs. Significantly enriched KEGG pathways are ordered from most to least significant. The number of genes in a specified KEGG pathway is denoted by the size of a circle. The color of each circle corresponds to that of the specific KEGG pathway. The dashed line represents significance at P = 0.05. n = 3.
Fig. 5
Fig. 5. Analysis of differentially expressed cartilage development–associated transcripts between different chondrocytes.
(A to C) Pie charts depicting percentages of the up-regulated (Up), down-regulated (Down), and nonsignificant (NS) transcripts comparison between MC-Chs, NCC-Chs, and NCs. (D to F) Heatmaps of differentially expressed cartilage development–associated transcripts comparison between MC-Chs, NCC-Chs, and NCs. The color intensity of each grid denotes the extent of change in transcript expression, where up-regulated transcripts are shown in red and down-regulated ones are shown in turquoise. n = 3.
Fig. 6
Fig. 6. Interactions of cartilage development–associated molecules differentially expressed in hiPSC-derived and NCs.
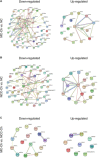
Functional protein association networks established using the STRING database revealed known and predicted interactions of cartilage development–associated molecules differentially expressed between (A) MC-Chs and NCs, (B) NCC-Chs and NCs, and (C) MC-Chs and NCC-Chs.
Fig. 7
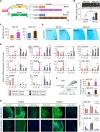
Fig. 7. Chondrogenic induction of MCs and NCCs by identified growth factors.
(A) Schematic of procedures and corresponding timelines for inducing differentiation from hiPSCs to chondrocytes. (B) Macrographs and size quantification of representative MC-Ch and NCC-Ch pellets of control and treated groups. (C) GAG quantification of MC-Ch and NCC-Ch pellets of control and treated groups. (D) Alcian Blue staining of MC-Ch and NCC-Ch pellets of control and treated groups. (E) Levels of mRNA expression of general cartilage–associated markers (SOX9, ACAN, COL1A1, and COL2A1), hyaline cartilage–associated markers (SIX1, THBS4, and ABI3BP), and hypertrophic-associated markers (COL10A1, CBFA1, and ALPL) in MC-Ch and NCC-Ch pellets. (F) Stiffness of control and treated MC-Ch and NCC-Ch pellets measured by atomic force microscopy (AFM). (G) Immunofluorescence staining of MC-Ch and NCC-Ch pellets of control and treated groups for detection of COL1A1, COL2A1, and COL10A1. Nuclear DNA was labeled with DAPI. n = 3. *P < 0.05, **P < 0.01, ***P < 0.001. Scale bars, 200 μm.
Fig. 8
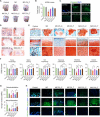
Fig. 8. Implantation of human MC-Ch and NCC-Ch pellets treated with identified growth factors in rat joints.
(A) Repair of rat cartilage defect 6 weeks after pellet implantation. Black arrows point to the site of implantation. (B) ICRS-I scoring for visual assessment of repaired rat joints. (C) Immunofluorescence staining of implanted chondrocyte pellets for detection of human vimentin. Nuclear DNA was labeled with DAPI. (D) Regenerated cartilage analyzed by H&E staining. (E) Rat joint analyzed by Safranin O/Fast Green staining. The central and bottom rows are magnifications of the solid boxed (superficial) and dashed boxed (subchondral bone) regions in the top row. (F) ICRS-II scoring for histological assessment of regenerated cartilage. (G) Surface and bulk stiffness of regenerated cartilage measured by AFM and Mark-10 indentation testing, respectively. (H) Immunofluorescence staining of regenerated cartilage for detection of COL1A1, COL2A1, and COL10A1. Nuclear DNA was labeled with DAPI. n = 3. *P < 0.05, **P < 0.01, ***P < 0.001. Scale bars, 200 μm.

References

    1. Sophia Fox A. J., Bedi A., Rodeo S. A., The basic science of articular cartilage: Structure, composition, and function. Sports Health 1, 461–468 (2009). - PMC - PubMed
    1. B. M. Carlson, Human Embryology and Developmental Biology E-Book (Elsevier Health Sciences, 2018).
    1. P. Trainor, Neural Crest Cells: Evolution, Development and Disease (Academic Press, 2013).
    1. Blentic A., Tandon P., Payton S., Walshe J., Carney T., Kelsh R. N., Mason I., Graham A., The emergence of ectomesenchyme. Dev. Dyn. 237, 592–601 (2008). - PMC - PubMed
    1. U.S. National Library of Medicine “ClinicalTrials.gov” National Institutes of Health (2021); www.clinicaltrials.gov/ct2/home.

Publication types