. 2021 May 19;7(21):eabf0573.
doi: 10.1126/sciadv.abf0573. Print 2021 May.

Quantum monitoring of cellular metabolic activities in single mitochondria

Affiliations

Quantum monitoring of cellular metabolic activities in single mitochondria

L Nie et al. Sci Adv. .

Abstract

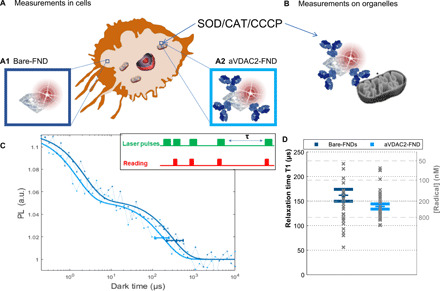
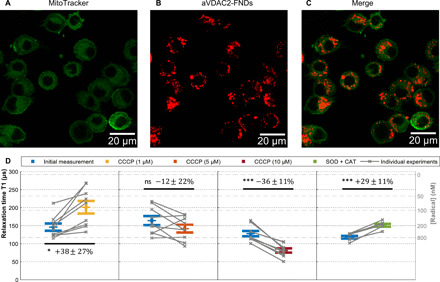
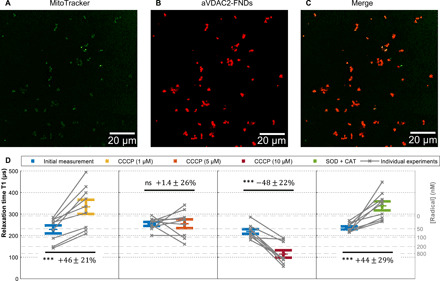
Free radicals play a vital role in all kinds of biological processes including immune responses. However, free radicals have short lifetimes and are highly reactive, making them difficult to measure using current methods. Here, we demonstrate that relaxometry measurement, or T1, inherited from the field of diamond magnetometry can be used to detect free radicals in living cells with subcellular resolution. This quantum sensing technique is based on defects in diamond, which convert a magnetic signal into an optical signal, allowing nanoscale magnetic resonance measurements. We functionalized fluorescent nanodiamonds (FNDs) to target single mitochondria within macrophage cells to detect the metabolic activity. In addition, we performed measurements on single isolated mitochondria. We were able to detect free radicals generated by individual mitochondria in either living cells or isolated mitochondria after stimulation or inhibition.


Figures

Fig. 1
Fig. 1. Schematic summary of the experimental conditions we investigated using diamond magnetometry (and compared to a conventional dye).
(A) First, we investigated free radical formation in single cells. Here, we differentiated between two subcellular locations: the cytosol reached by uncoated FNDs (A1) and the mitochondria reached by aVDAC2 antibody–coated FNDs (A2). (B) Measurements on single isolated mitochondria. In all conditions, we compared measurements before and after stimulation with CCCP in different concentrations: CAT (final concentration of 1000 U/ml) and SOD (final concentration of 600 U/ml). (C) The T1 relaxation curve is generated from different dark times plotted against the fluorescence intensity. The inset shows the pulsing sequence used in relaxometry experiments. The green blocks indicate when the laser was on, while the red blocks indicate when we read out the photoluminescence (PL) from the FND. The horizontal error bar indicates the position of the T1 time and the 95% confidence interval obtained with the fitting procedure. This T1 time gives a measure of radical concentration in the surroundings. The representative curves shown are from bare FNDs, or aVDAC2-coated FNDs, before applying any treatment. a.u., arbitrary unit. (D) Statistical distribution (mean and SE) of T1 from 26 and 36 FNDs (all the “initial conditions” are represented hereafter).
Fig. 2
Fig. 2. Free radical detection.
(A to C) Confocal images of FNDs (1 μg/ml) with adsorbed aVDAC2 antibodies incubated with cells (104 cells/ml) for 14 hours. Green, MitoTracker Green–stained mitochondria; red, aVDAC2-FND. (D) Single-cell free radical measurement by T1. After recording the initial T1 (blue), 1, 5, and 10 μM CCCP as well as SOD (1000 U/ml) and CAT (600 U/ml) were tested on the same samples. The error bars represent SEs. Gray lines show individual experiments on single cells. The left gray axis represents the approximated concentration determined from a calibration with *OH radicals in solution from the previous work (45). The experiments were repeated nine times. Data were analyzed using a paired t test to compare between groups with a *P ≤ 0.05 and ***P ≤ 0.001 significance.
Fig. 3
Fig. 3. Free radical measurements in single mitochondria.
(A to C) Confocal images of aVDAC2-FND targeted to isolated mitochondria. Green, MitoTracker Green–stained mitochondria; red, FNDs. Scale bar, 20 μm. (D) Free radicals detected on single isolated mitochondria by T1 measurements. After recording an initial T1 measurement, 1, 5, and 10 CCCP as well as SOD (1000 U/ml) and CAT (600 U/ml) were tested on the same samples. The error bars represent SEs. The left gray axis represents the approximated concentration determined from a calibration with *OH radicals in solution from the previous work (45). The experiments were repeated nine times. The data were analyzed by using a paired t test against the previous group. ***P ≤ 0.001.

References

    1. Quinlan C. L., Perevoschikova I. V., Goncalves R. L. S., Hey-Mogensen M., Brand M. D., The determination and analysis of site-specific rates of mitochondrial reactive oxygen species production. Methods Enzymol. 526, 189–217 (2013). - PMC - PubMed
    1. Wang W., Karamanlidis G., Tian R., Novel targets for mitochondrial medicine. Sci. Transl. Med. 8, 326rv3 (2016). - PMC - PubMed
    1. Smith R. A. J., Hartley R. C., Murphy M. P., Mitochondria-targeted small molecule therapeutics and probes. Antioxid. Redox Signal. 15, 3021–3038 (2011). - PubMed
    1. Sigaeva A., Ong Y., Damle V. G., Morita A., van der Laan K. J., Schirhagl R., Optical detection of intracellular quantities using nanoscale technologies. Acc. Chem. Res. 52, 1739–1749 (2019). - PMC - PubMed
    1. Shi J., Liu M., Shi J., Zheng G., Wang Y., Wang J., Chen Y., Lu C., Yin W., Reference gene selection for qPCR in Ammopiptanthus mongolicus under abiotic stresses and expression analysis of seven ROS-scavenging enzyme genes. Plant Cell Rep. 31, 1245–1254 (2012). - PubMed