. 2021 Jul 15;131(14):e142116.
doi: 10.1172/JCI142116.

Targeting the αv integrin/TGF-β axis improves natural killer cell function against glioblastoma stem cells

Affiliations

Targeting the αv integrin/TGF-β axis improves natural killer cell function against glioblastoma stem cells

Hila Shaim et al. J Clin Invest. .

Abstract

Glioblastoma multiforme (GBM), the most aggressive brain cancer, recurs because glioblastoma stem cells (GSCs) are resistant to all standard therapies. We showed that GSCs, but not normal astrocytes, are sensitive to lysis by healthy allogeneic natural killer (NK) cells in vitro. Mass cytometry and single-cell RNA sequencing of primary tumor samples revealed that GBM tumor-infiltrating NK cells acquired an altered phenotype associated with impaired lytic function relative to matched peripheral blood NK cells from patients with GBM or healthy donors. We attributed this immune evasion tactic to direct cell-to-cell contact between GSCs and NK cells via αv integrin-mediated TGF-β activation. Treatment of GSC-engrafted mice with allogeneic NK cells in combination with inhibitors of integrin or TGF-β signaling or with TGFBR2 gene-edited allogeneic NK cells prevented GSC-induced NK cell dysfunction and tumor growth. These findings reveal an important mechanism of NK cell immune evasion by GSCs and suggest the αv integrin/TGF-β axis as a potentially useful therapeutic target in GBM.

Keywords: Brain cancer; Cancer immunotherapy; Immunology; NK cells.


Conflict of interest statement

Conflict of interest: HS, MS, RB, EJS, and KR have filed for a patent (MDA 20-021; UTSC.P1190US.P1; “Natural killer cell immunotherapy for the treatment of glioblastoma”). KR, EJS, REC, EL, RB, MD, PPB, DM, and The University of Texas MD Anderson Cancer Center (MDACC) have an institutional financial conflict of interest with Takeda Pharmaceutical for the licensing of the technology related to CAR-NK cells. KR, EJS, RB, EL, DM, and the MDACC has an institutional financial conflict of interest with Affimed GmbH. KR participates on Scientific Advisory Boards for GemoAb, AvengeBio, Kiadis, GSK, and Bayer.

Figures

Figure 1
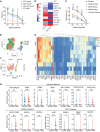
Figure 1. GSCs express NK cell receptor ligands and are susceptible to NK cell cytotoxicity.
(A) 51Cr release assay showing cytotoxicity of donor-derived NK cells activated overnight with IL-15 (5 ng/mL) against GSCs (blue), K562 cells (black), U87 cell line (green), or healthy human astrocytes (red) (U87: n = 3; K562, GSCs, astrocytes: n = 6). Error bars denote SD. Green asterisks: cytotoxicity against U87 vs. astrocytes. Black asterisks: cytotoxicity against K562 vs. astrocytes. Blue asterisks: cytotoxicity against GSCs vs. astrocytes. (B) Heatmap representing the relative expression of NK cell ligands on GSCs or human astrocytes ranging from blue (low) to red (high). Columns represent the median expression of each receptor (GSC: n = 6; astrocytes: n = 3). (C) Activated HC-NK cells were cocultured with GSCs in the presence or absence of blocking antibodies: anti-NKG2D (blue), anti-DNAM (green), anti-NKp30 (red), or anti–HLA class I (purple). 51Cr release assay against GSCs was assessed (n = 4). Blue asterisks: cytotoxicity against GSCs with or without anti-NKG2D. Red asterisks: cytotoxicity against GSCs with or without anti-NKp30. Green asterisks: cytotoxicity against GSCs with or without anti-DNAM. (D and E) viSNE plots (D) and a comparative mass cytometry heatmap (E) showing the expression of NK cell markers in HC-NK (red), GP-NK (green), and TI-NK cells (blue). Column clustering was identified by FlowSOM. Each row reflects annotation of the expression level for an individual patient. Color scale ranges from blue (lower expression) to red (higher expression) (n = 3). (F) UMAP plot showing clusters for TI-NK versus HC-NK cells by scRNA-seq. (G) Violin plots showing the mRNA expression levels for individual NK cell–related genes in healthy controls (HC-NK cells; blue) and TI-NK cells (red) using scRNA-seq. Markers associated with NK cell activation and cytotoxicity, inhibition, and the TGF-β pathway are presented. Statistical analysis by 2-way ANOVA with Dunnett’s correction for multiple comparisons (A and C) or unpaired t test (G). *P ≤ 0.05; **P ≤ 0.01; ***P ≤ 0.001.
Figure 2
Figure 2. GSCs induce NK cell dysfunction.
(A) Primary human GBM tumor–infiltrating NK (TI-NK) cells (red) and paired peripheral blood NK (GP-NK) cells (blue) from the same patient with GBM or peripheral blood NK cells from healthy control donors (HC-NK) (black) were cocultured for 4 hours with K562 cells at different ratios and the cytotoxicity was determined by 51Cr release assay (n = 8). Black asterisks: HC-NK cell cytotoxicity against K562 targets vs. TI-NK. Blue asterisks: GP-NK cell cytotoxicity against K562 vs. paired TI-NK. (B) Box-and-whisker plots summarizing CD107a, IFN-γ, and TNF-α production by TI-NK, GP-NK, or HC-NK cells after incubation with K562 cells for 5 hours at a 5:1 ratio (n = 10). (C) Comparison of the mean fluorescence intensity (MFI) of p-Smad2/3 expression in NK cells from HC-NK (white), GP-NK (blue), and TI-NK cells (red) (n = 10). (D) Susceptibility of K562 to NK cells that were cocultured at a 1:1 ratio with healthy astrocytes (red) or alone (blue) for 48 hours. NK cells were then purified and their ability to kill K562 cell targets was assessed by 51Cr release assay (n = 3). (E) Specific lysis (51Cr release assay) of K562 cells by NK cells cultured alone or with GSCs at a 1:1 ratio for 48 hours (n = 10). Red asterisks: statistical significance in NK cell cytotoxicity against K562 cells for NK cells cocultured with GSCs vs. NK cells alone. (F) Box-and-whisker plots summarizing CD107a, IFN-γ, and TNF-α production by NK cells cultured either alone or with GSCs at a 1:1 ratio for 48 hours in response to K562 cells (n = 10). Statistical analysis by 2-way ANOVA with Dunnett’s correction for multiple comparisons (A and C), 2-way ANOVA with Tukey’s correction for multiple comparisons (B, D, and E), or paired t test (F). **P ≤ 0.01; ***P ≤ 0.001.
Figure 3
Figure 3. GSC-induced NK cell dysfunction requires cell-cell contact.
(A) p-Smad2/3 (MFI) expression in NK cells cultured alone or with GSCs in the presence or absence of LY2109761 or galunisertib (n = 4). (B) HC-NK cells were cultured with or without GSCs for 48 hours in the presence or absence of LY2109761 or galunisertib. A 4-hour 51Cr release assay tested their cytotoxicity against K562 cell (left) or GSC (right) targets. Asterisks represent the statistical difference in NK cell cytotoxicity in the presence or absence of galunisertib (gray) or LY2109761 (black) (n = 3). (C) TI-NK cells were cultured overnight with or without galunisertib and their cytotoxicity tested against K562 cell targets in a 4-hour 51Cr release assay. Black asterisks: TI-NK + galunisertib vs. GP-NK (n = 3). (D and E) Total TGF-β1 (pg/mL; ELISA) levels in supernatants from NK cells and GSCs cultured alone or together for 48 hours in direct contact or separated with a Transwell membrane (D; n = 13) or NK cells and astrocytes cultured alone or together for 48 hours (E; n = 3). (F) NK cells cocultured with GSCs for 48 hours in direct contact or separated with a Transwell and their cytotoxicity tested against K562 in a 4-hour 51Cr release assay (n = 7). (G) p-Smad2/3 (MFI) expression in HC-NK cells cultured overnight with or without GSCs in the presence or absence of TGF-β–blocking antibodies, or separated with a Transwell membrane (n = 5). (H) Total TGF-β1 (ELISA) in the supernatant of NK cells and GSCs cultured alone (NK: blue; GSC: black) or together (red) (n = 4). Blue asterisks: GSCs vs. NK:GSCs (E:T). (I) Fold-change in TGFB1 mRNA levels in NK cells and GSCs cultured for 48 hours either alone, or together in direct contact or separated with a Transwell membrane (n = 7). Statistical analysis by 2-way ANOVA with Dunnett’s (AC and EH), Tukey’s (D), or Bonferroni’s (I) correction for multiple comparisons. *P ≤ 0.05; **P ≤ 0.01; ***P ≤ 0.001.
Figure 4
Figure 4. αv Integrins mediate TGF-β1 release by GSCs and GSC-induced NK cell dysfunction.
(A) Box-and-whisker plots showing total TGF-β (pg/mL) in the supernatant of NK cells and GSCs cultured either alone or together in the presence or absence of the αv integrin small molecule inhibitor cilengitide (10 μM) for 48 hours was determined by ELISA (n = 11). (B) Box-and-whisker plots showing MFI of p-Smad2/3 expression on HC-NK cells cultured either alone or with GSCs in the presence or absence of cilengitide (10 μM). (C) 51Cr release assay of K562 cell killing by NK cells cultured either alone or after coculture with GSCs for 48 hours in the presence or absence of cilengitide (10 μM) (n = 8). Red asterisks: specific lysis of K562 targets by NK cells that were cocultured with GSCs in the presence or absence cilengitide. (D and E) Representative zebra plots (D) and summary box-and-whisker plots (E) of CD107, IFN-γ, and TNF-α production by NK cells in response to K562 cells cultured either alone or after 48 hours of coculture with GSCs at a 1:1 ratio with or without cilengitide (n = 12). Inset numbers in panel D are the percentages of CD107a-, IFN-γ–, or TNF-α–positive NK cells within the indicated regions. (F) 51Cr release assay of K562 cell targets by NK cells cultured either alone or with WT GSCs or with CD51-KO GSCs for 48 hours at a 1:1 ratio (n = 3). Red asterisks: the specific lysis of K562 cell targets by NK cells after coculture with WT GSCs vs. CD51 KO. Statistical analysis by 2-way ANOVA with Bonferroni’s correction for multiple comparisons (A, B, E, and F) or 2-way ANOVA with Dunnett’s correction for multiple comparisons (C). *P ≤ 0.05; **P ≤ 0.01; ***P ≤ 0.001.
Figure 5
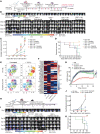
Figure 5. In vivo antitumor activity and NK cell function following TGF-β and αv integrin signaling inhibition in a GBM mouse model.
(A) Schematic diagram showing the timeline of the in vivo experiment. (B) Bioluminescence imaging (BLI) at different time points was used as a surrogate marker for tumor progression (n = 4–5). (C) Average radiance (BLI) data. Orange asterisks: NK + galunisertib vs. tumor control. Red asterisks: NK + cilengitide vs. tumor control. Blue asterisks: NK alone vs. tumor control. Green asterisks: NK + galunisertib vs. cilengitide control. Brown asterisks: NK + cilengitide vs. cilengitide control. Purple asterisks: NK + galunisertib vs. galunisertib control. (D) Survival of mice in each group (n = 5). Animals treated with NK + galunisertib or NK + cilengitide had significantly better survival compared with tumor controls (P = 0.009 and P = 0.05, respectively). (E and F) viSNE plots (E) and comparative heatmap (F) of mass cytometry data showing the expression of NK cell markers in WT or TGFBR2-KO NK cells with or without recombinant TGF-β. Heatmap column clustering generated by FlowSOM analysis; color scale shows the expression of each marker: red (high) and blue (low). (G) Killing of K562 cells over time by WT-NK (blue), TGFBR2-KO NK (black), WT-NK + recombinant TGF-β (red), or TGFBR2-KO NK + recombinant TGF-β (green) as measured by real-time killing assay. (H) Schematic diagram showing the timeline of subsequent in vivo mouse experiment. (I) BLI was obtained from the 4 groups of mice (n = 4). (J) Average radiance (BLI) data: Red asterisks: TGFBR2-KO NK vs. tumor controls. Green asterisks: WT NK + galunisertib vs. tumor controls. Blue asterisks: WT NK vs. tumor controls. (K) Kaplan-Meier plot showing mouse survival. Statistical analysis by 2-way ANOVA with Dunnett’s correction for multiple comparisons (C, G, and J) or log-rank test (D and K). *P ≤ 0.05; **P ≤ 0.01; ***P ≤ 0.001.

References

    1. Stupp R, et al. Radiotherapy plus concomitant and adjuvant temozolomide for glioblastoma. N Engl J Med. 2005;352(10):987–996. doi: 10.1056/NEJMoa043330. - DOI - PubMed
    1. Bao S, et al. Glioma stem cells promote radioresistance by preferential activation of the DNA damage response. Nature. 2006;444(7120):756–760. doi: 10.1038/nature05236. - DOI - PubMed
    1. Lan X, et al. Fate mapping of human glioblastoma reveals an invariant stem cell hierarchy. Nature. 2017;549(7671):227–232. doi: 10.1038/nature23666. - DOI - PMC - PubMed
    1. Guo M, et al. Cytotoxic activity of allogeneic natural killer cells on U251 glioma cells in vitro. Mol Med Rep. 2016;14(1):583–589. doi: 10.3892/mmr.2016.5220. - DOI - PubMed
    1. Jung TY, et al. Immunological characterization of glioblastoma cells for immunotherapy. Anticancer Res. 2013;33(6):2525–2533. - PubMed

Publication types

MeSH terms