. 2021 Jul 22;6(14):e137708.
doi: 10.1172/jci.insight.137708.

mTORC1 is a mechanosensor that regulates surfactant function and lung compliance during ventilator-induced lung injury

Affiliations

mTORC1 is a mechanosensor that regulates surfactant function and lung compliance during ventilator-induced lung injury

Hyunwook Lee et al. JCI Insight. .

Abstract

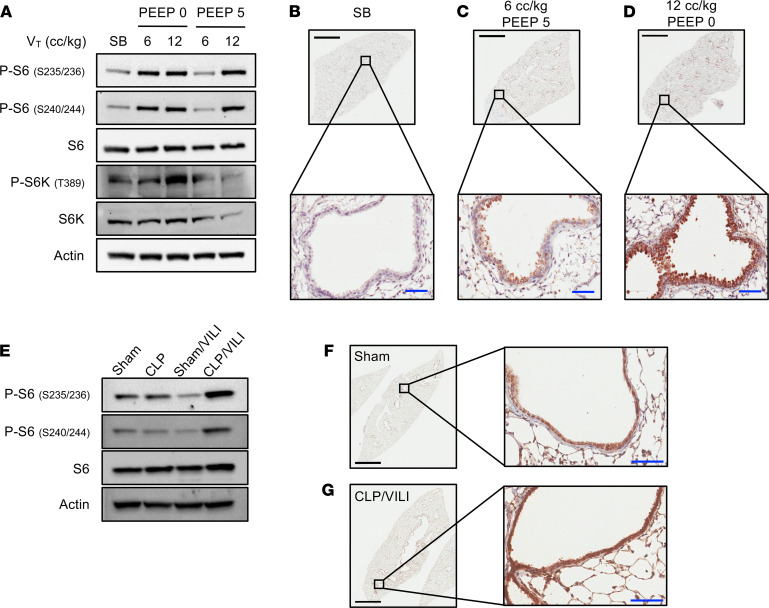
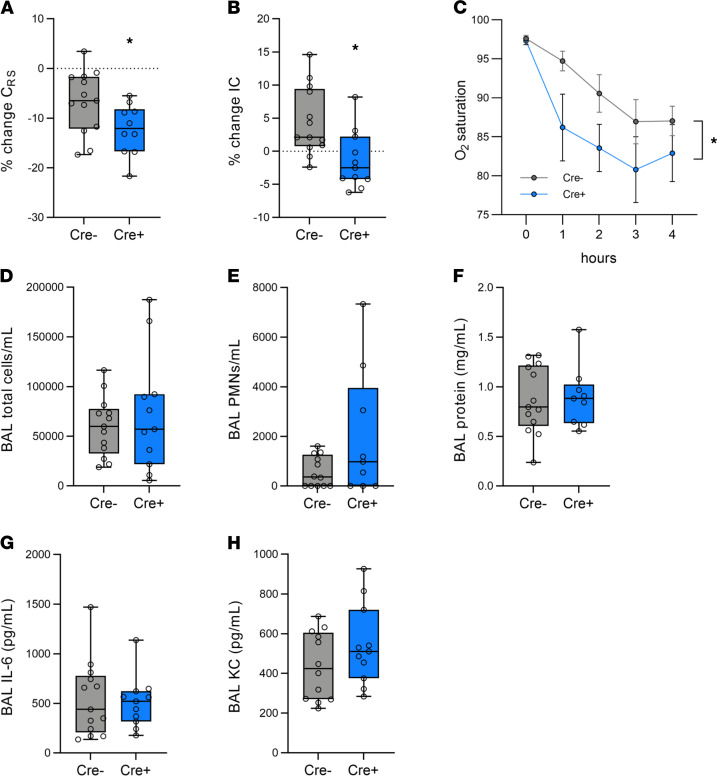
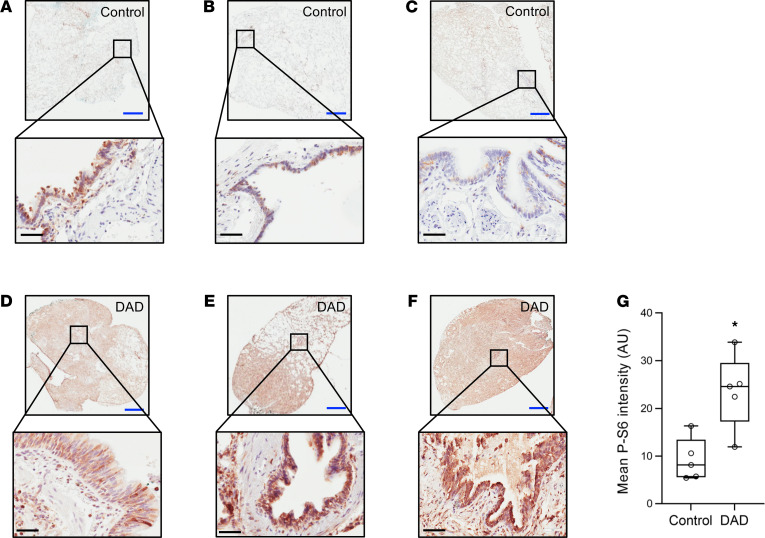
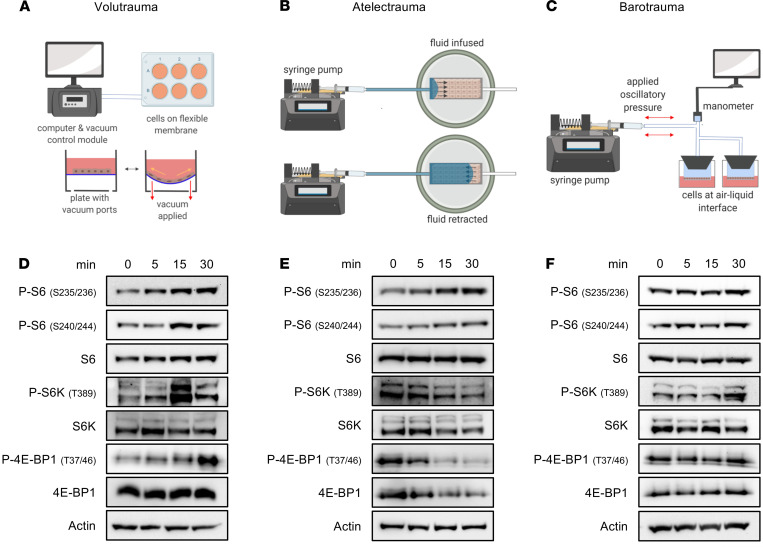
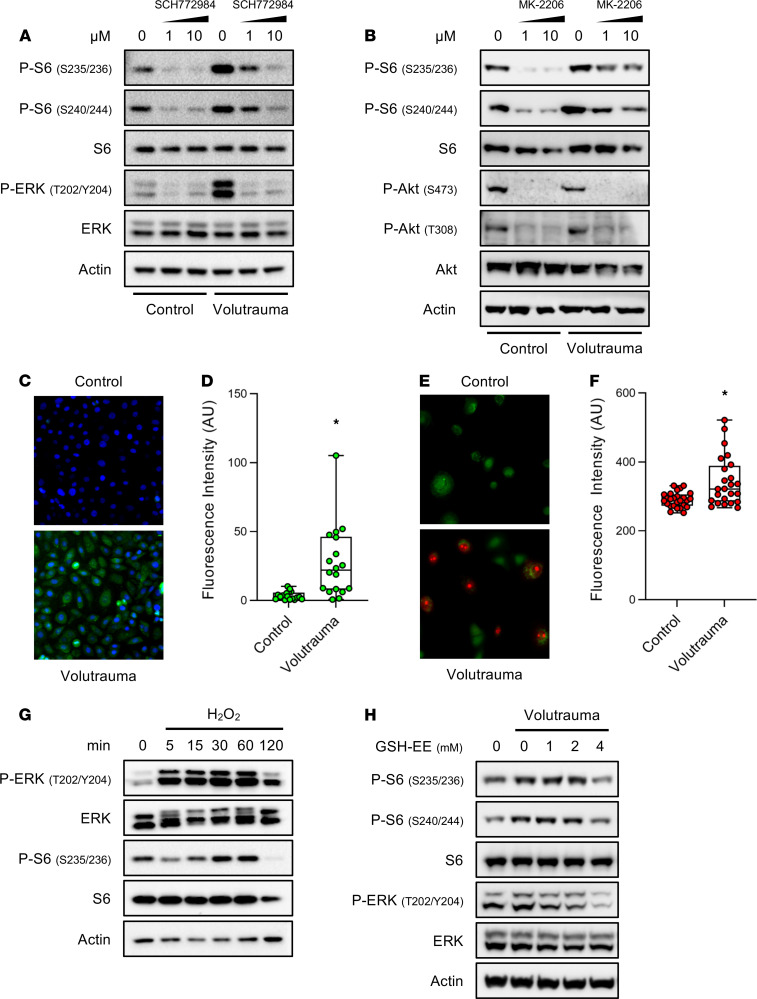
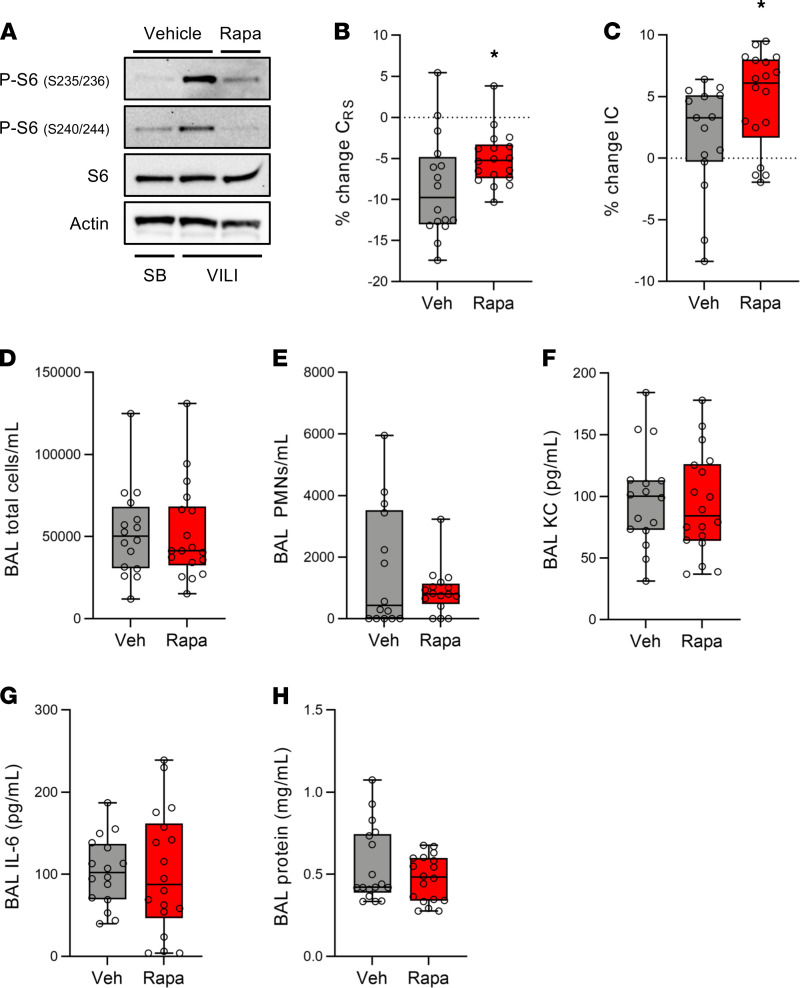
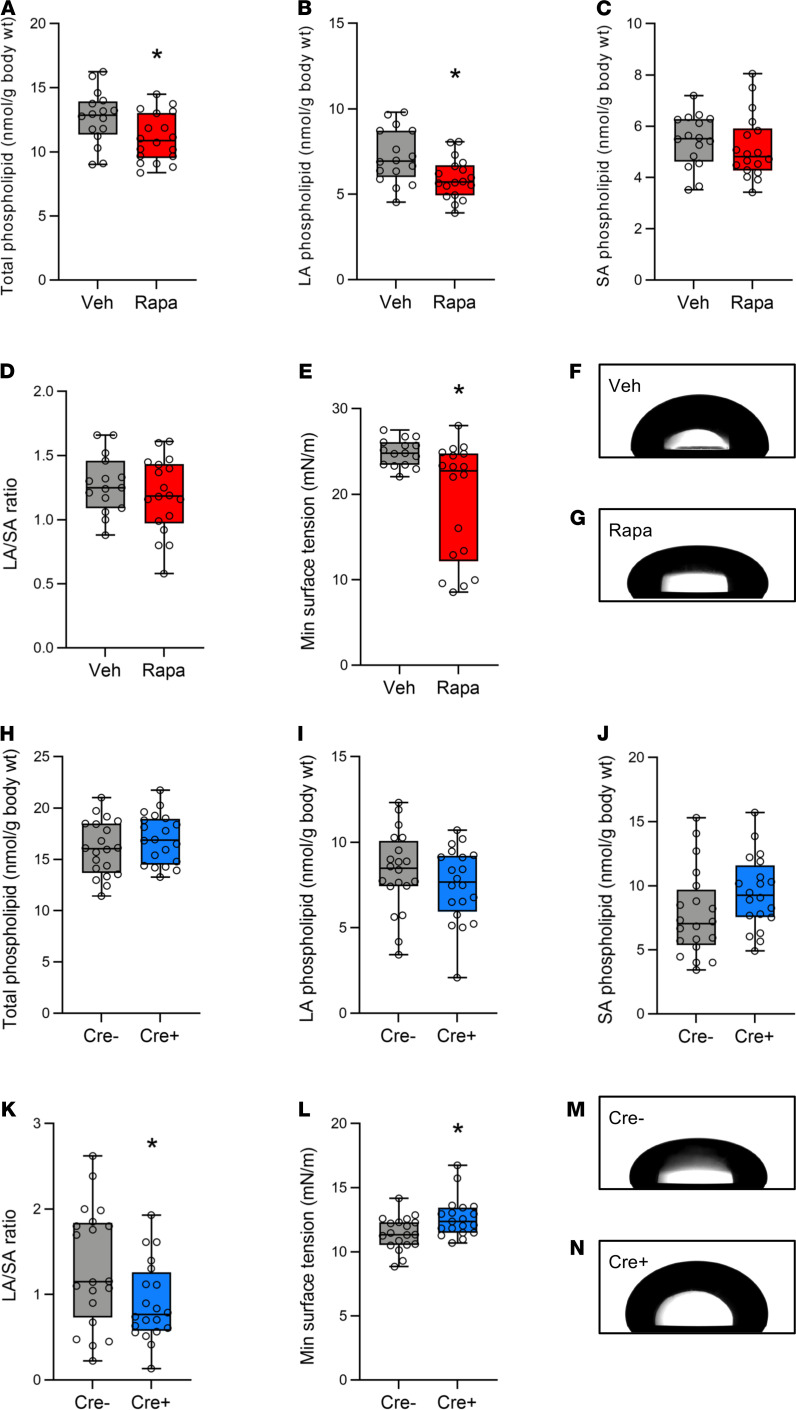
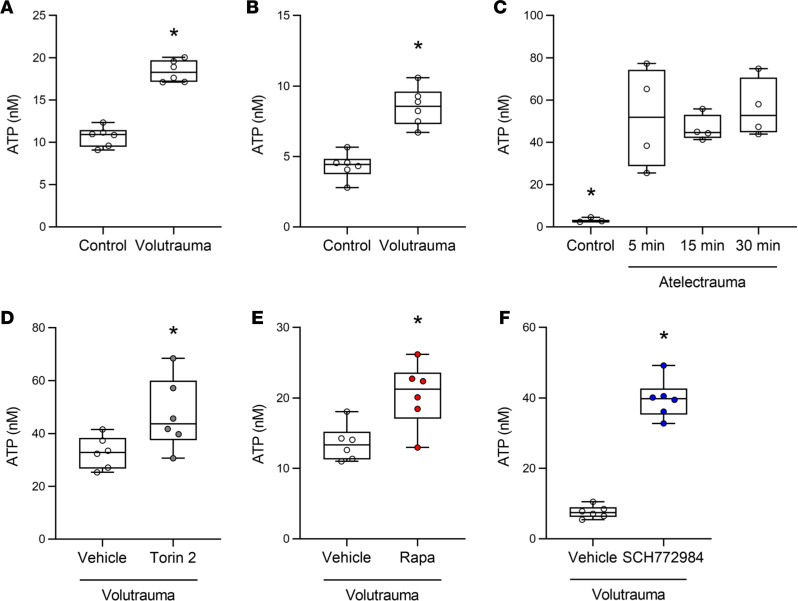
The acute respiratory distress syndrome (ARDS) is a highly lethal condition that impairs lung function and causes respiratory failure. Mechanical ventilation (MV) maintains gas exchange in patients with ARDS but exposes lung cells to physical forces that exacerbate injury. Our data demonstrate that mTOR complex 1 (mTORC1) is a mechanosensor in lung epithelial cells and that activation of this pathway during MV impairs lung function. We found that mTORC1 is activated in lung epithelial cells following volutrauma and atelectrauma in mice and humanized in vitro models of the lung microenvironment. mTORC1 is also activated in lung tissue of mechanically ventilated patients with ARDS. Deletion of Tsc2, a negative regulator of mTORC1, in epithelial cells impairs lung compliance during MV. Conversely, treatment with rapamycin at the time MV is initiated improves lung compliance without altering lung inflammation or barrier permeability. mTORC1 inhibition mitigates physiologic lung injury by preventing surfactant dysfunction during MV. Our data demonstrate that, in contrast to canonical mTORC1 activation under favorable growth conditions, activation of mTORC1 during MV exacerbates lung injury and inhibition of this pathway may be a novel therapeutic target to mitigate ventilator-induced lung injury during ARDS.

Keywords: Pulmonary surfactants; Pulmonology; Signal transduction.


Conflict of interest statement

Conflict of interest: RMB serves on advisory boards for Merck and Genentech.

Figures

Figure 1
Figure 1. Injurious MV activates mTORC1 in lung epithelial cells.
(A) Immunoblots of phosphorylated and total ribosomal S6, S6 kinase (S6K), and beta-actin using pooled protein lysate from whole lung tissue of SB control mice (n = 3/lane) or mice subjected to MV (n = 4/lane) with high TV (VT, 12 cc/kg), low TV (VT 6 cc/kg), with or without the use of PEEP (0 or 5 cm H2O). Low power (4×) and high power (400×, inset) images from lung tissue that was immunostained for phosphorylated S6 (P-S6, Ser235/236) from SB control mice (B), mice ventilated with noninjurious settings (C) (VT 6 cc/kg, PEEP 5 cm H2O), and mice ventilated with injurious settings (D) (VT 12 cc/kg, PEEP 0 cm H2O). (E) Immunoblots from whole lung tissue of mice subjected to sham laparotomy (n = 3/lane), CLP,(n = 4/lane), and VILI (VT 12 cc/kg, PEEP 2.5 cm H2O) 24 hours after sham laparotomy (n = 3/lane) and VILI 24 hours after CLP (CLP/VILI, n = 4/lane). Representative images from lung tissue that was immunostained for P-S6 (Ser235/236) from sham (F) and CLP/VILI (G) mice. Scale bars: black bars = 2 mm, blue bars = 50 μm.
Figure 2
Figure 2. Airway epithelial Tsc2 deletion impairs lung function in a murine model of combined volutrauma and atelectrauma.
Mice with airway epithelial Tsc2 deletion (Cre+) and Cre– control mice were subjected to MV with high TV (12 cc/kg) without PEEP (0 cm H2O) for 4 hours. (A) The change in respiratory system compliance (CRS) and (B) inspiratory capacity (IC) were measured during MV. All data were normally distributed, analyzed by Student’s t test, *P < 0.05. (C) Oxygen saturations measured via pulse oximetry during the 4-hour period of ventilation presented as mean ± SEM. *P < 0.05, by 2-way ANOVA with repeated measures with Holms-Sidak post hoc test. Following MV, a bronchoalveolar lavage (BAL) was performed and total inflammatory cells (D), neutrophils (PMNs) (E), and protein levels (F) were measured. For PMN counts, n = 12 for Cre- and n = 9 for Cre+. IL-6 (G) and KC (H) levels were measured in BAL fluid by ELISA. n = 13 for Cre- and n = 11 for Cre+ unless otherwise noted. Box blots show median ± interquartile range and whiskers define min and max values.
Figure 3
Figure 3. mTORC1 is activated in lung tissue from mechanically ventilated patients with DAD.
Photomicrographs of lung sections stained for P-S6 (Ser235/236) from normal lung tissue from control patients (AC) and from patients with DAD (DF). Mean intensity of staining was quantitated using low power images of the entire slide (G) (n = 5/group). Scale bars: blue bar = 2 mm, black bar = 50 μm. *P < 0.05 versus control by Student’s t test. Box blots show median ± interquartile range and whiskers define min and max values.
Figure 4
Figure 4. mTORC1 is rapidly activated by volutrauma and atelectrauma in vitro.
Schematics of in vitro volutrauma, atelectrauma, and barotrauma models used (AD). SAECs were subjected to equibiaxial stretch (20%, 0.2 Hz) for varying amounts of time prior to immunoblotting for markers of mTORC1 activation (protein pooled from n = 3 wells/lane). (E) SAECs were grown to confluent monolayers on collagen-coated glass slides in a microfluidic chamber and subjected to bubble flow (velocity 30 mm/sec) to model atelectrauma for varying amounts of time prior to immunoblotting for markers of mTORC1 activation (protein pooled from n = 2 gels/time point). (F) SAECs were grown at air-liquid interface on Transwells and subjected to oscillatory pressure (30 cm H2O, 0.2 Hz) for varying amounts of time prior to immunoblotting for markers of mTORC1 activation (protein pooled from n = 3 wells/lane).
Figure 5
Figure 5. In vitro volutrauma activates mTORC1 through reactive oxygen species-dependent activation of the ERK pathway.
(A) Human bronchial epithelial cells were subjected to volutrauma (20% equibiaxial stretch, 0.2 Hz, 30 min) in the presence of increasing doses of the ERK 1/2 inhibitor (SCH772984) or vehicle (DMSO) prior to immunoblotting for markers of ERK and mTORC1 activation (pooled protein from n = 2 wells/lane). (B) SAECs were subjected to volutrauma (24% biaxial stretch, 0.2 Hz, 30 min) in the presence of increasing doses of the AKT inhibitor (MK-2206) or vehicle (DMSO) prior to immunoblotting for markers of AKT and mTORC1 activation (pooled protein from n = 2 wells/lane). (C and D) HBEs were stretched (24% biaxial stretch, 0.2 Hz, 30 min) in the presence of CellRox Green and fluorescence was quantitated in each field (100×). Data log normally distributed, analyzed by Student’s t test on log2 transformed data (n = 18 fields/group). (E and F) SAECs were stretched (24% biaxial stretch, 0.3 Hz, 30 min) in the presence of mitoSOX (Red) and calcein AM (Green) prior to quantitating the intensity of MitoSOX Red staining in each field (100×). Data not normally distributed, analyzed by Mann-Whitney test (n = 27 images per condition). (G) Small airway epithelial cells were treated with 500 μM hydrogen peroxide (H2O2) for increasing amounts of time prior to immunoblotting for markers or ERK and mTORC1 activation (n = 1 well/lane). (H) SAECs were treated with increasing doses of GSH-EE 30 minutes prior to volutrauma (20% equibiaxial stretch, 0.2 Hz, 30 min) and immunoblotting for markers of mTORC1 and ERK activation (n = 2 wells/lane). Box blots show median ± interquartile range and whiskers define min and max values. *P < 0.05 for all panels.
Figure 6
Figure 6. Pharmacologic mTORC1 inhibition attenuates VILI.
WT mice were treated with rapamycin (rapa) or vehicle (veh) immediately prior to injurious MV (VILI, TV 12 cc/kg, PEEP 0 cm H2O) for 4 hours. (A) Following MV, protein was isolated from lung tissue of ventilated (n = 6) and SB control (n = 4) mice and immunoblotted for phosphorylated S6 (P-S6). (B) The percent change in respiratory system compliance (CRS) was measured during the 4-hour period of MV. Data normally distributed, analyzed by Student’s t test. (C) The percent change in inspiratory capacity (IC) was quantitated following 4 hours of VILI. Data not normally distributed, analyzed by Mann-Whitney test. Following mechanical, a bronchoalveolar lavage (BAL) was performed and total inflammatory cells (D) and neutrophils (E) (PMNs, n = 14 veh, n = 18 rapa) were measured. KC (F) and IL-6 (G) levels were measured in BAL fluid by ELISA. BAL protein levels (H) were also measured. Box blots show median ± interquartile range and whiskers define min and max values. *P < 0.05, n = 16 for veh and n = 18 for rapa unless otherwise noted.
Figure 7
Figure 7. mTORC1 activation exacerbates surfactant dysfunction during injurious ventilation.
(A) Total phospholipid levels were measured in mice treated with veh or rapa (5 mg/kg) following 4 hours of injurious ventilation (TV 12 cc/kg, PEEP 0 cm H2O). Data normally distributed, analyzed by Student’s t test. Phospholipid levels were also measured in LA fractions (B) and SA fractions (C). (AC) Data normally distributed, analyzed by Student’s t test, n = 16 for veh and n = 18 for rapa. (D) The ratio of LA/SA phospholipid was calculated (n = 15 veh, n = 18 rapa). (E) Minimum surface tension after 15 cycles measured using a CDS in LA fractions from vehicle- and rapamycin-treated mice. Data not normally distributed, analyzed by Mann-Whitney test, n = 15 veh, n = 18 rapa. (F and G) Representative images of minimum surface tension from LA fractions of mice treated with rapa or veh prior to VILI. Total (H), LA (I), and SA (J) phospholipid levels were measured in mice with airway epithelial Tsc2 deletion (Cre+) and Cre– control mice following 4 hours of injurious ventilation (TV 12 cc/kg, PEEP 0 cm H2O). The ratio of LA/SA phospholipid was calculated (K). Data normally distributed, analyzed by Student’s t test, n = 20/group for (HK). (L) Minimum surface tension after 25 cycles measured using CDS in LA fractions from Cre- and Cre+ mice. Data log normally distributed, analyzed by Student’s t test on log2 transformed data, n = 19/group. (M and N) representative images of minimum surface tension from LA fractions of Cre- and Cre+ mice following VILI. Box blots show median ± interquartile range and whiskers define min and max values. *P < 0.05.
Figure 8
Figure 8. mTORC1 activation impairs release of the surfactant secretagogue extracellular ATP in response to volutrauma.
(A) SAECs were subjected to volutrauma (24% stretch, 0.2 Hz, 30 min) or static culture (control) prior to measuring extracellular ATP. Data normally distributed, analyzed by Student’s t test, n = 6 wells/condition. (B) HBE cells were subjected to volutrauma (24% stretch, 0.2 Hz, 30 min) or static culture (control) prior to measuring extracellular ATP. Data normally distributed, analyzed by Student’s t test, n = 6 wells/condition. (C) SAECs on polyacrylamide gels were subjected to atelectrauma or control for varying amounts of time prior to measuring extracellular ATP. Data normally distributed, analyzed by 1-way ANOVA with Sidak’s post hoc test, n = 4 for all time points except control n = 3. (DF) HBE cells were treated with Torin 2 (D) (10 nM), rapamycin (E) (10 nM), SCH772984 (F) (10 μM), or appropriate vehicle control 1 hour prior to in vitro volutrauma. ATP concentration was measured in media following 30 minutes of injurious stretch. Data normally distributed, analyzed by Student’s t test, n = 6 wells/group. Box blots show median ± interquartile range and whiskers define min and max values. *P < 0.05 versus all groups.

References

    1. Attaway AH, et al. Severe covid-19 pneumonia: pathogenesis and clinical management. BMJ. 2021;372:n436. - PubMed
    1. Englert JA, et al. Integrating molecular pathogenesis and clinical translation in sepsis-induced acute respiratory distress syndrome. JCI Insight. 2019;4(2):124061. - PMC - PubMed
    1. Rubenfeld GD, et al. Incidence and outcomes of acute lung injury. N Engl J Med. 2005;353(16):1685–1693. doi: 10.1056/NEJMoa050333. - DOI - PubMed
    1. Force ADT, et al. Acute respiratory distress syndrome: the Berlin definition. JAMA. 2012;307(23):2526–2533. - PubMed
    1. Tremblay LN, Slutsky AS. Ventilator-induced lung injury: from the bench to the bedside. Intensive Care Med. 2006;32(1):24–33. doi: 10.1007/s00134-005-2817-8. - DOI - PubMed

Publication types

MeSH terms

Substances