. 2021 Jun 17;19(6):e3001239.
doi: 10.1371/journal.pbio.3001239. eCollection 2021 Jun.

Erythrocyte adenosine A2B receptor prevents cognitive and auditory dysfunction by promoting hypoxic and metabolic reprogramming

Affiliations

Erythrocyte adenosine A2B receptor prevents cognitive and auditory dysfunction by promoting hypoxic and metabolic reprogramming

Qingfen Qiang et al. PLoS Biol. .

Abstract

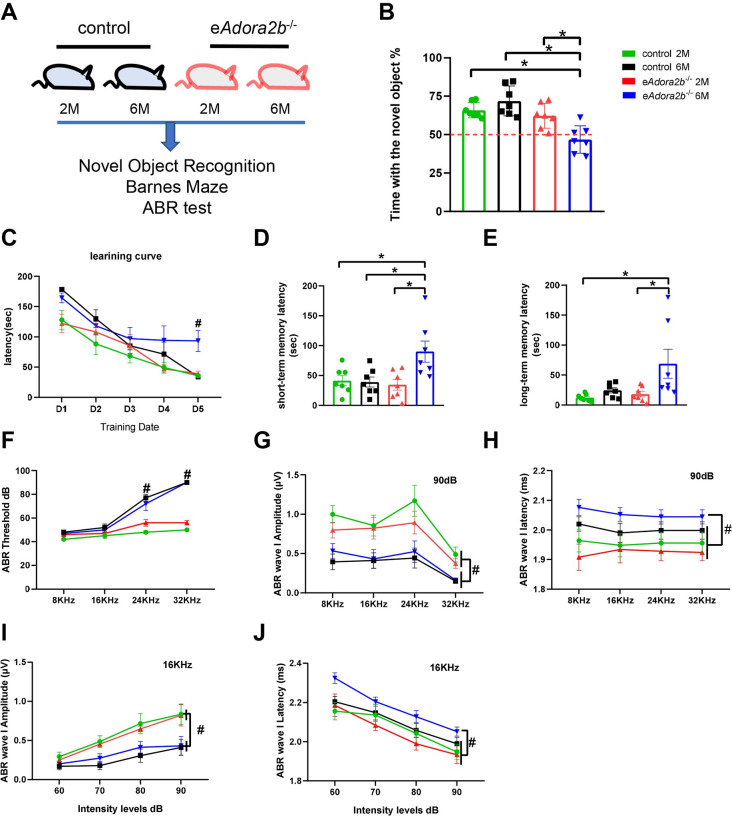
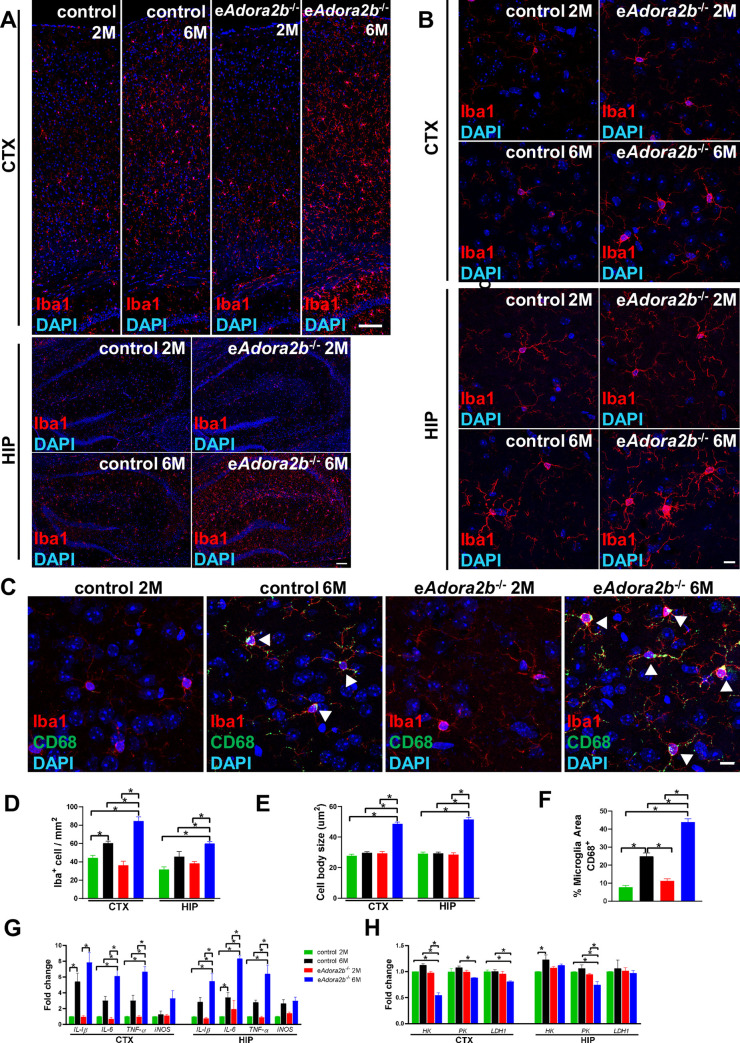
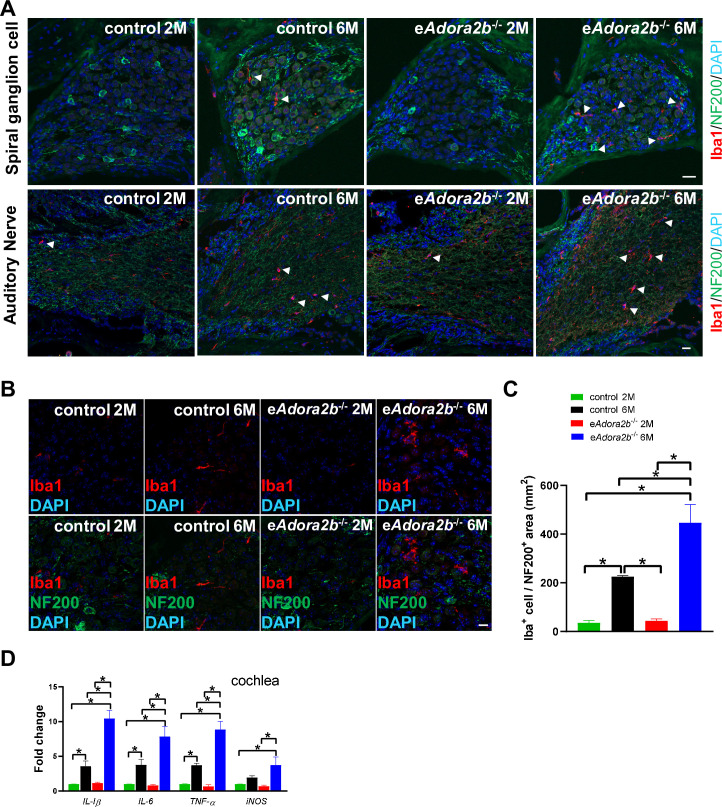
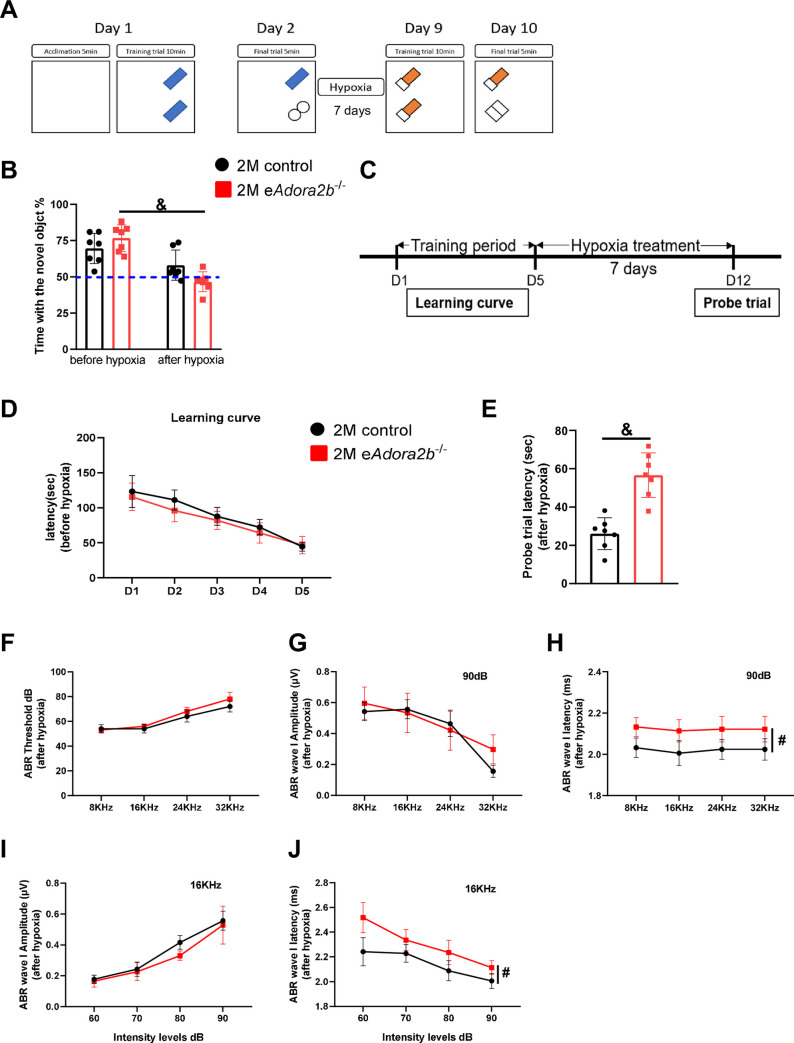
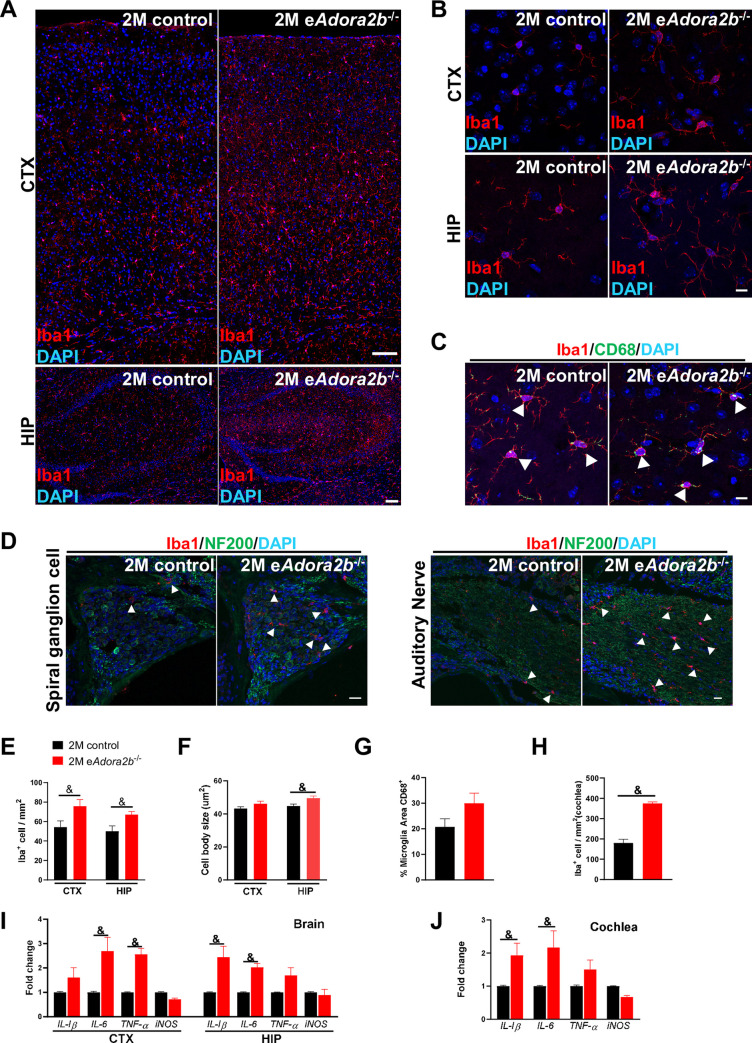
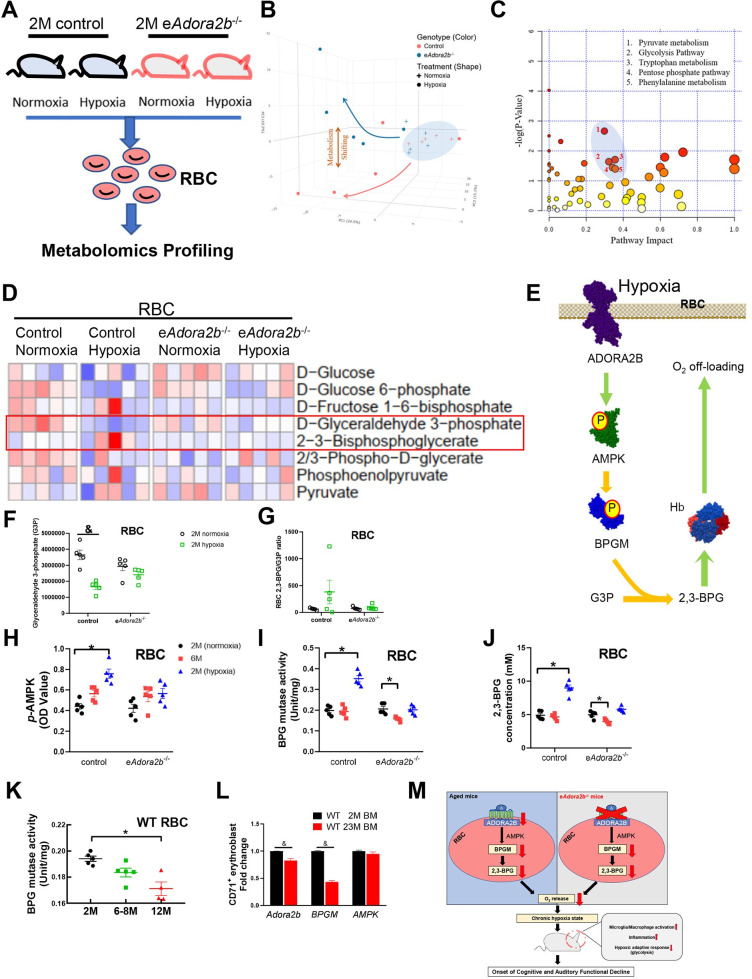
Hypoxia drives aging and promotes age-related cognition and hearing functional decline. Despite the role of erythrocytes in oxygen (O2) transport, their role in the onset of aging and age-related cognitive decline and hearing loss (HL) remains undetermined. Recent studies revealed that signaling through the erythrocyte adenosine A2B receptor (ADORA2B) promotes O2 release to counteract hypoxia at high altitude. However, nothing is known about a role for erythrocyte ADORA2B in age-related functional decline. Here, we report that loss of murine erythrocyte-specific ADORA2B (eAdora2b-/-) accelerates early onset of age-related impairments in spatial learning, memory, and hearing ability. eAdora2b-/- mice display the early aging-like cellular and molecular features including the proliferation and activation of microglia and macrophages, elevation of pro-inflammatory cytokines, and attenuation of hypoxia-induced glycolytic gene expression to counteract hypoxia in the hippocampus (HIP), cortex, or cochlea. Hypoxia sufficiently accelerates early onset of cognitive and cochlear functional decline and inflammatory response in eAdora2b-/- mice. Mechanistically, erythrocyte ADORA2B-mediated activation of AMP-activated protein kinase (AMPK) and bisphosphoglycerate mutase (BPGM) promotes hypoxic and metabolic reprogramming to enhance production of 2,3-bisphosphoglycerate (2,3-BPG), an erythrocyte-specific metabolite triggering O2 delivery. Significantly, this finding led us to further discover that murine erythroblast ADORA2B and BPGM mRNA levels and erythrocyte BPGM activity are reduced during normal aging. Overall, we determined that erythrocyte ADORA2B-BPGM axis is a key component for anti-aging and anti-age-related functional decline.


Conflict of interest statement

The authors have declared that no competing interests exist.

Figures

Fig 1
Fig 1. Erythrocyte ADORA2B deficiency impaired cognitive and cochlear function at 6 months.
(A) Schematic representation of experimental design. Two-month-old and 6-month-old control and eAdora2b−/− mice cognitive and cochlear functions were evaluated by NOR, BM, and ABR test. (B) Percentage of time exploring the novel object was quantified in final trial of NOR, and a value lower than 50% demonstrated impaired cognitive abilities. Data are shown as mean ± SEM. n = 7 mice/group. *P < 0.05. (C) Learning curve was measured in the 4 groups for 5 consecutive days as the primary latency to find escape box in seconds. Data are expressed as mean ± SEM. n = 7 mice/group. #P < 0.05 compared to other 3 groups. (D, E) Short-term memory (D) and long-term memory (E) were measured as the primary latency in seconds for mice to find the escape box. Data are shown as mean ± SEM. n = 7 mice/group. *P < 0.05. (F–J) ABR test was applied to measure HL of the 4 groups. Threshold (F) was defined as the lowest intensity to detect Waves I–V. Data are shown as mean ± SEM. n = 5 mice/group. #P < 0.05, eAdora2b−/− 6M and control 6M vs. eAdora2b−/− 2M and control 2M. Average Wave I amplitude (G) and latency (H) were measured in response to 90 dB. Data are shown as mean ± SEM. n = 5 mice/group. #P < 0.05. Average Wave I amplitude (I) and latency (J) were measured in response to 16 KHz. Data are shown as mean ± SEM. n = 5 mice/group. #P < 0.05. (G) and (I) were assessed by eAdora2b−/− 6M and control 6M vs. eAdora2b−/− 2M and control 2M. (H) and (J) were assessed by eAdora2b−/− 6M compared to other 3 groups. *P were measured by 1-way ANOVA with Tukey multiple comparison test. #P were tested by 2-way ANOVA with Tukey post hoc test. For all graphs, numerical data underlying plots are provided in S1 Data. ABR, auditory brainstem response; BM, Barnes Maze test; ADORA2B, adenosine A2B receptor; HL, hearing loss; NOR, novel object recognition.
Fig 2
Fig 2. Increased abundance of activated microglia and pro-inflammatory cytokines and reduced glycolysis in brain are associated with eAdora2b−/− mice at 6 months old.
(A) Representative images of microglia visualized by Iba1 staining in CTX (upper) and HIP (bottom) are shown. Scale bar, 100 μm. (B) Representative high-magnification images show morphology of microglia in CTX and HIP. Scale bar, 10 μm. (C) Representative high-magnification images of activated microglia in brain by co-staining with Iba1 and CD68. Scale bar, 10 μm. Arrowheads indicate areas of co-staining. (D) Quantification of microglia cell count in the CTX and HIP were determined from 5 randomly selected fields for each brain region and for each of the 4 categories of mice. Data are expressed as mean ± SEM. n = 5 mice/group. *P < 0.05. (E) Morphology of microglia was assessed by measuring their cell body size from 10 cells for each brain region for each of the 4 groups of mice. Data are expressed as mean ± SEM. n = 5 mice/group. *P < 0.05. (F) Microglia activation was evaluated by assessing the proportion of Iba1-positive cells with CD68 staining from 3 randomly selected fields in the CTX and HIP for each mouse. Data are expressed as mean ± SEM. n = 5 mice/group. *P < 0.05. (G) Pro-inflammatory cytokines mRNA expression levels in CTX and HIP were measured by qRT-PCR, which were normalized to β-actin mRNA. Data are expressed as mean ± SEM. n = 4–5 mice/group. *P < 0.05. (H) Glycolytic enzyme mRNA expression level in CTX and HIP were measured by qRT-PCR, which were normalized to β-actin mRNA. Data are expressed as mean ± SEM. n = 3 mice/group. *P < 0.05. *P were measured by 1-way ANOVA with Tukey multiple comparison test. For all graphs, numerical data underlying plots are provided in S1 Data. ADORA2B, adenosine A2B receptor; CTX, cerebral cortex; HIP, hippocampus; IL, interleukin; iNOS, inducible nitric oxide synthase; qRT-PCR, quantitative RT-PCR; TNF-α, tumor necrosis factor alpha.
Fig 3
Fig 3. Increased abundance of enlarged macrophages and pro-inflammatory cytokines in cochlea of eAdora2b−/− mice at 6 months old.
(A) Representative images of macrophages around spiral ganglion cells and AN were identified by Iba1 and NF200 staining. Scale bar, 20 μm. Arrowheads indicate macrophage cells. (B) Representative high-magnification images show morphology of macrophages in RC. Scale bar, 10 μm. (C) Macrophage cells in RC were counted from apex to basal in 2 slices for each mouse. Data are expressed as mean ± SEM. n = 3 mice/group. *P < 0.05. (D) Pro-inflammatory cytokine mRNA expression levels in cochlea were measured by qRT-PCR, which were normalized to β-actin mRNA. Data are expressed as mean ± SEM. n = 4–5 mice/group, *P < 0.05. *P were measured by 1-way ANOVA with Tukey multiple comparison test. For all graphs, numerical data underlying plots are provided in S1 Data. ADORA2B, adenosine A2B receptor; AN, auditory nerve; IL, interleukin; iNOS, inducible nitric oxide synthase; qRT-PCR, quantitative RT-PCR; RC, Rosenthal’s canal; TNF-α, tumor necrosis factor alpha.
Fig 4
Fig 4. Erythrocyte ADORA2B deficiency accelerates cognitive and cochlear function decline under hypoxia.
(A) Schematic diagram of NOR. On day 1, mice were placed in empty box with bedding for 5 minutes and then trained with 2 identical objects for 10 minutes. On day 2, final trial was done by replacing with a novel object for mice to explore for 5 minutes. With 7 days hypoxia treatment, 2 different identical objects were placed in opposite places in box to train mice on day 9. Moreover, final trial was done by replacing with a novel object on day 10. (B) Percentage of time exploring the novel object was quantified in final trial of NOR. A percentage lower than 50% indicates impaired cognitive abilities. Data are shown as mean ± SEM. n = 7 mice/group. &P < 0.05 were analyzed by paired t test. (C) Time course of BM. Learning curves were obtained from training period during days 1–5. After 7 days hypoxia treatment, probe trial was done on day 12. (D, E) Primary latency of learning curve (D) and probe trial (E) were measured. Data are presented as mean ± SEM. n = 7 mice/group. &P < 0.05 were assessed by unpaired t test. (F–J) ABR test was applied to measure HL in the 4 groups after hypoxia treatment. Threshold (F), Wave I amplitude (G) and latency (H) in response to 90 dB, and Wave I amplitude (I) and latency (J) in response to 16 KHz were measured. Data are shown as mean ± SEM. n = 5 mice/group. #P < 0.05 were measured by 2-way ANOVA with Tukey post hoc test. For all graphs, numerical data underlying plots are provided in S1 Data. ABR, auditory brainstem response; ADORA2B, adenosine A2B receptor; BM, Barnes Maze test; HL, hearing loss; NOR, novel object recognition.
Fig 5
Fig 5. Increased abundance of activated microglia/macrophages and pro-inflammatory cytokines in tissues of eAdora2b−/− mice following hypoxia treatment.
(A–C) Representative images of microglia from brain. (A) Representative images of microglia visualized by Iba1 staining in CTX and HIP are shown. Scale bar, 100 μm. (B) Representative high-magnification images show morphology of microglia in CTX and HIP. Scale bar, 10 μm. (C) Representative high-magnification images of activated microglia in brain visualized by co-staining Iba1 and CD68. Scale bar, 10 μm. Arrowheads indicate areas of co-staining. (D) Representative images of macrophages around spiral ganglion cells and AN were identified by Iba1 and NF200 staining. Scale bar, 20 μm. Arrowheads indicate macrophage cells. (E) Quantification of microglia in the CTX and HIP from 5 randomly selected fields for each brain region per mouse. Data are expressed as mean ± SEM. n = 5 mice/group. &P < 0.05. (F) Morphology of microglia was assessed by measuring their cell body size from 10 cells for each brain region per mouse. Data are expressed as mean ± SEM. n = 5 mice/group. &P < 0.05. (G) Microglia activation was evaluated by assessing the proportion of Iba1-positive cells with CD68 staining from 3 randomly selected fields in CTX and HIP per mouse. Data are expressed as mean ± SEM. n = 5 mice/group. &P < 0.05. (H) Number of macrophages around NF200+ SGN cells were counted from apex to basal in 2 slices for each mouse. Data are expressed as mean ± SEM. n = 3 mice/group. &P < 0.05. (I) Pro-inflammatory cytokine mRNA expression levels in CTX and HIP were measured by qRT-PCR, which were normalized to β-actin mRNA. Data are expressed as mean ± SEM. n = 5 mice/group, &P < 0.05. (J) Pro-inflammatory cytokine mRNA expression levels in cochlea were measured by qRT-PCR and were normalized to β-actin mRNA. Data are expressed as mean ± SEM. n = 5 mice/group, &P < 0.05. &P were assessed by unpaired t test. For all graphs, numerical data underlying plots are provided in S1 Data. ADORA2B, adenosine A2B receptor; CTX, cerebral cortex; HIP, hippocampus; IL, interleukin; iNOS, inducible nitric oxide synthase; qRT-PCR, quantitative RT-PCR; TNF-α, tumor necrosis factor alpha.
Fig 6
Fig 6. Hypoxia as the driving force resulted in reduced erythrocyte-mediated hypoxic metabolic reprogramming during aging.
(A) Schematic representation of experimental design. Erythrocytes collected from 2-month-old controls and eAdora2b−/− mice with or without hypoxia treatment were evaluated by unsupervised metabolomics. n = 5 mice/group. (B) PCA revealed metabolic shift of eAdora2b−/− mice compared to control mice with or without hypoxia. (C) Metabolic pathway impact score of eAdora2b−/−- and control mice with or without hypoxia treatment. (D) Heatmap of erythrocyte glucose metabolism measured by unbiased metabolomics profiling. (E) Schematic graph illustrating erythrocyte ADORA2B–AMPK–BPGM signaling pathway to promote G3P metabolized toward 2,3-BPG and thus induce more O2 release to counteract tissue hypoxia. (F, G) G3P level and (F) an 2,3-BPG/G3P ratio (G) in Metabolomic screening. Data are expressed as mean ± SEM. n = 5 mice/group. &P < 0.05 were measured by unpaired t test. (H) Erythrocyte AMPK 1α activity was measured by commercial ELISA kit. Data are expressed as mean ± SEM. n = 5 mice/group. *P < 0.05. (I–K) Erythrocyte BPGM activity (I, K) and 2,3-BPG (J) was measured by commercial kits. Data are expressed as mean ± SEM. n = 4–5 mice/group. *P < 0.05. (L) Adora2b-AMPKBPGM axis mRNA expression level in CD71+ erythroblasts isolated from bone marrow were measured by qRT-PCR and were normalized to β-actin mRNA. Data are expressed as mean ± SEM. n = 3 mice/group, &P < 0.05. &P were assessed by unpaired t test. (M) Graphical abstract. *P were assessed by 1-way ANOVA with Tukey multiple comparison test. For all graphs, numerical data underlying plots are provided in S1 Data. 2,3-BPG, 2,3-bisphosphoglycerate; ADORA2B, adenosine A2B receptor; AMPK, AMP-activated protein kinase; BPGM, bisphosphoglycerate mutase; G3P, glyceraldehyde 3-phosphate; PCA, principal component analysis; qRT-PCR, quantitative RT-PCR; RBC, red blood cell; WT, wild-type.

Similar articles

Cited by

References

    1. Fong JHJBG. Disability incidence and functional decline among older adults with major chronic diseases. 2019;19(1):323. Epub 2019/11/23. doi: 10.1186/s12877-019-1348-z ; PubMed Central PMCID: PMC6873710. - DOI - PMC - PubMed
    1. Berthelot G, Johnson S, Noirez P, Antero J, Marck A, Desgorces F-D, et al.. The age-performance relationship in the general population and strategies to delay age related decline in performance. Archives of Public Health. 2019;77(1):51. doi: 10.1186/s13690-019-0375-8 - DOI - PMC - PubMed
    1. Lin FR, Yaffe K, Xia J, Xue Q-L, Harris TB, Purchase-Helzner E, et al.. Hearing loss and cognitive decline in older adults. JAMA Intern Med 2013;173(4):293–9. doi: 10.1001/jamainternmed.2013.1868 . - DOI - PMC - PubMed
    1. Harada CN, Natelson Love MC, Triebel KL. Normal cognitive aging. Clin Geriatr Med 2013;29(4):737–52. doi: 10.1016/j.cger.2013.07.002 . - DOI - PMC - PubMed
    1. Franceschi C, Garagnani P, Parini P, Giuliani C, Santoro A. Inflammaging: a new immune–metabolic viewpoint for age-related diseases. Nat Rev Endocrinol. 2018;14(10):576–90. doi: 10.1038/s41574-018-0059-4 - DOI - PubMed

Publication types

MeSH terms