

Estimating the cumulative incidence of COVID-19 in the United States using influenza surveillance, virologic testing, and mortality data: Four complementary approaches
- PMID: 34138845
- PMCID: PMC8241061
- DOI: 10.1371/journal.pcbi.1008994
Estimating the cumulative incidence of COVID-19 in the United States using influenza surveillance, virologic testing, and mortality data: Four complementary approaches
Abstract
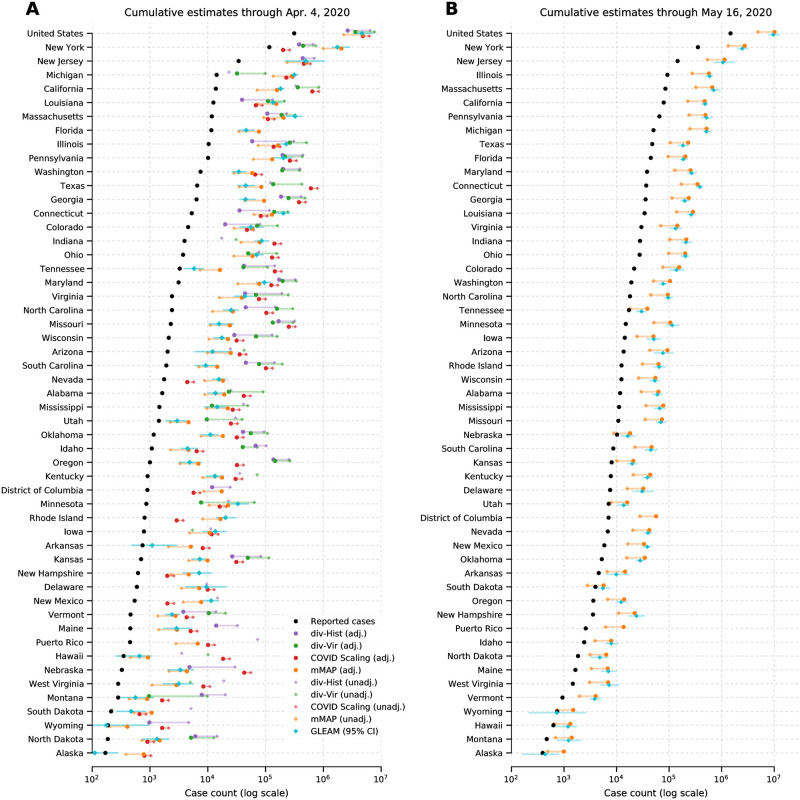
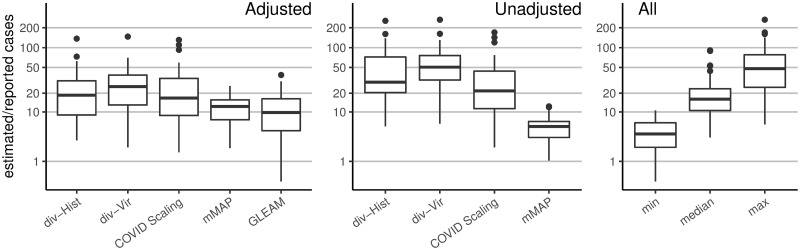
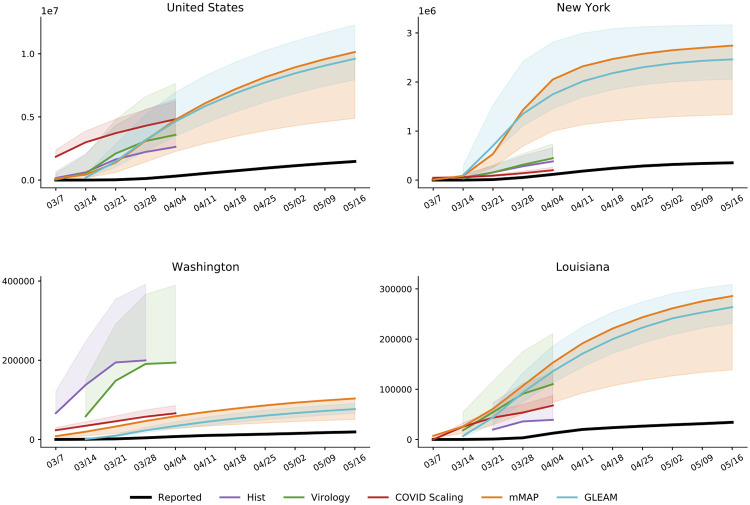
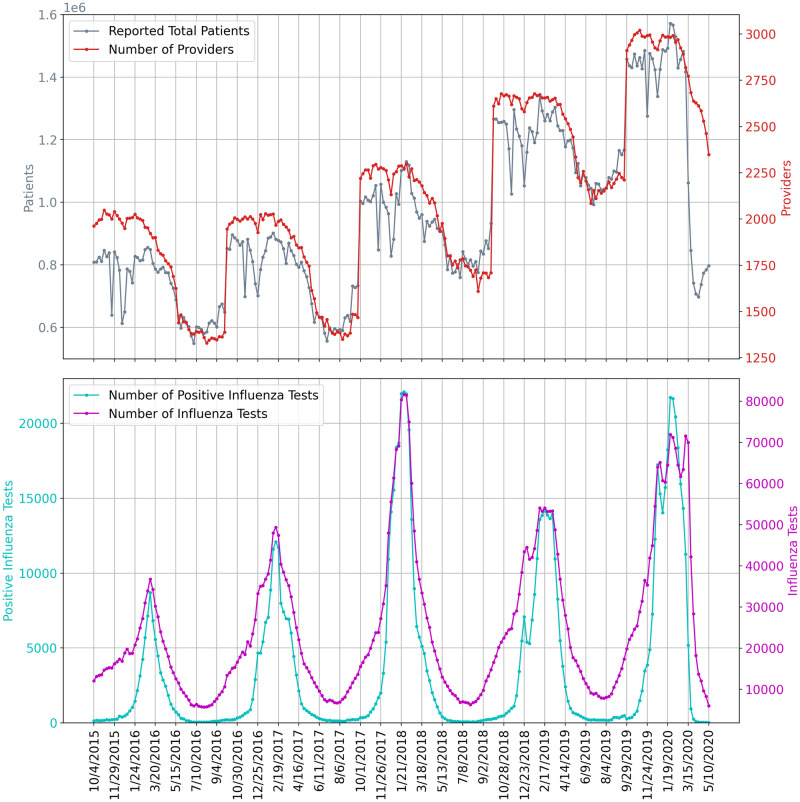
Effectively designing and evaluating public health responses to the ongoing COVID-19 pandemic requires accurate estimation of the prevalence of COVID-19 across the United States (US). Equipment shortages and varying testing capabilities have however hindered the usefulness of the official reported positive COVID-19 case counts. We introduce four complementary approaches to estimate the cumulative incidence of symptomatic COVID-19 in each state in the US as well as Puerto Rico and the District of Columbia, using a combination of excess influenza-like illness reports, COVID-19 test statistics, COVID-19 mortality reports, and a spatially structured epidemic model. Instead of relying on the estimate from a single data source or method that may be biased, we provide multiple estimates, each relying on different assumptions and data sources. Across our four approaches emerges the consistent conclusion that on April 4, 2020, the estimated case count was 5 to 50 times higher than the official positive test counts across the different states. Nationally, our estimates of COVID-19 symptomatic cases as of April 4 have a likely range of 2.3 to 4.8 million, with possibly as many as 7.6 million cases, up to 25 times greater than the cumulative confirmed cases of about 311,000. Extending our methods to May 16, 2020, we estimate that cumulative symptomatic incidence ranges from 4.9 to 10.1 million, as opposed to 1.5 million positive test counts. The proposed combination of approaches may prove useful in assessing the burden of COVID-19 during resurgences in the US and other countries with comparable surveillance systems.
Conflict of interest statement
I have read the journal’s policy and the authors of this manuscript have the following competing interests: ML has provided advice on COVID-19 free of charge to Janssen, Astra-Zeneca, Pfizer, and COVAXX (United Biomedical), as well as to the nonprofit One Day Sooner. ML has received consulting income or honoraria from Merck, Pfizer, Bristol Meyers Squibb, and Sanofi, and institutional research support from Pfizer.
Figures

Update of
-
Estimating the Cumulative Incidence of COVID-19 in the United States Using Four Complementary Approaches.medRxiv [Preprint]. 2020 Aug 7:2020.04.18.20070821. doi: 10.1101/2020.04.18.20070821. medRxiv. 2020. Update in: PLoS Comput Biol. 2021 Jun 17;17(6):e1008994. doi: 10.1371/journal.pcbi.1008994. PMID: 32587997 Free PMC article. Updated. Preprint.
References
-
- Organization WH. Report of the WHO-China Joint Mission on Coronavirus Disease 2019;. Available from: https://www.who.int/publications-detail/report-of-the-who-china-joint-mi....
-
- Centers for Disease Control and Prevention. Locations with Confirmed COVID-19 Cases;. Available from: https://www.cdc.gov/coronavirus/2019-ncov/cases-updates/world-map.html.
-
- D Shear M, Goodnough A, Kaplan S, Fink S, Thomas K, Weiland N. The Lost Month: How a Failure to Test Blinded the U.S. to Covid-19;. Available from: https://www.nytimes.com/2020/03/28/us/testing-coronavirus-pandemic.html.
-
- Manrai AK, Mandl KD. Covid-19 testing: overcoming challenges in the next phase of the epidemic;. Available from: https://www.statnews.com/2020/03/31/covid-19-overcoming-testing-challenges/.
Publication types
MeSH terms
Grants and funding
LinkOut - more resources
Full Text Sources
Medical
Miscellaneous
