. 2021 Aug 18;12(8):780-794.e7.
doi: 10.1016/j.cels.2021.05.005. Epub 2021 Jun 14.

A time-resolved proteomic and prognostic map of COVID-19

Vadim Demichev  1 Pinkus Tober-Lau  2 Oliver Lemke  3 Tatiana Nazarenko  4 Charlotte Thibeault  2 Harry Whitwell  5 Annika Röhl  3 Anja Freiwald  3 Lukasz Szyrwiel  6 Daniela Ludwig  3 Clara Correia-Melo  6 Simran Kaur Aulakh  6 Elisa T Helbig  2 Paula Stubbemann  2 Lena J Lippert  2 Nana-Maria Grüning  3 Oleg Blyuss  7 Spyros Vernardis  6 Matthew White  6 Christoph B Messner  8 Michael Joannidis  9 Thomas Sonnweber  10 Sebastian J Klein  9 Alex Pizzini  10 Yvonne Wohlfarter  11 Sabina Sahanic  10 Richard Hilbe  10 Benedikt Schaefer  12 Sonja Wagner  12 Mirja Mittermaier  13 Felix Machleidt  2 Carmen Garcia  2 Christoph Ruwwe-Glösenkamp  2 Tilman Lingscheid  2 Laure Bosquillon de Jarcy  2 Miriam S Stegemann  2 Moritz Pfeiffer  2 Linda Jürgens  2 Sophy Denker  14 Daniel Zickler  15 Philipp Enghard  15 Aleksej Zelezniak  16 Archie Campbell  17 Caroline Hayward  18 David J Porteous  17 Riccardo E Marioni  19 Alexander Uhrig  2 Holger Müller-Redetzky  2 Heinz Zoller  12 Judith Löffler-Ragg  10 Markus A Keller  11 Ivan Tancevski  10 John F Timms  20 Alexey Zaikin  21 Stefan Hippenstiel  22 Michael Ramharter  23 Martin Witzenrath  22 Norbert Suttorp  22 Kathryn Lilley  24 Michael Mülleder  25 Leif Erik Sander  22 PA-COVID-19 Study groupMarkus Ralser  26 Florian Kurth  27
Collaborators, Affiliations

A time-resolved proteomic and prognostic map of COVID-19

Vadim Demichev et al. Cell Syst. .

Abstract

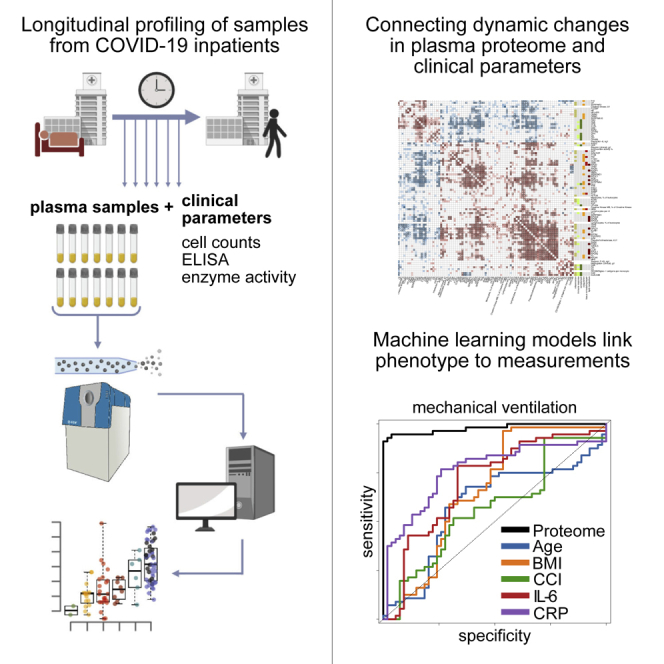
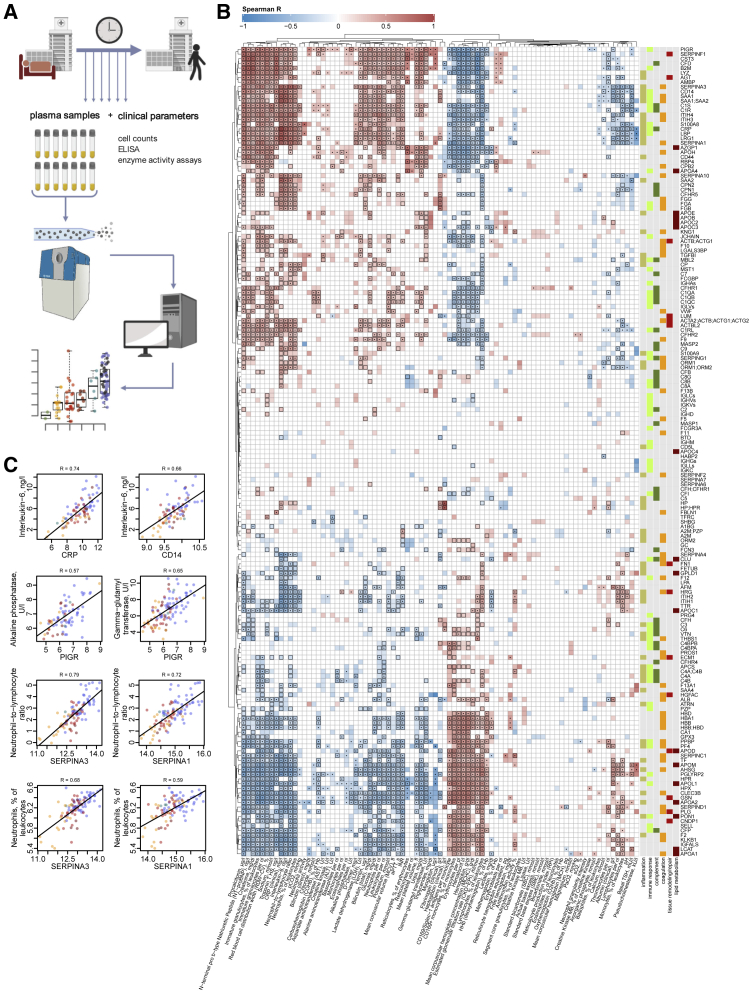
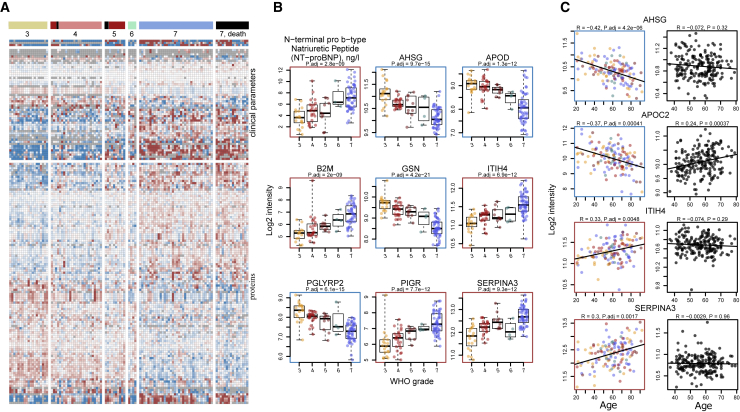
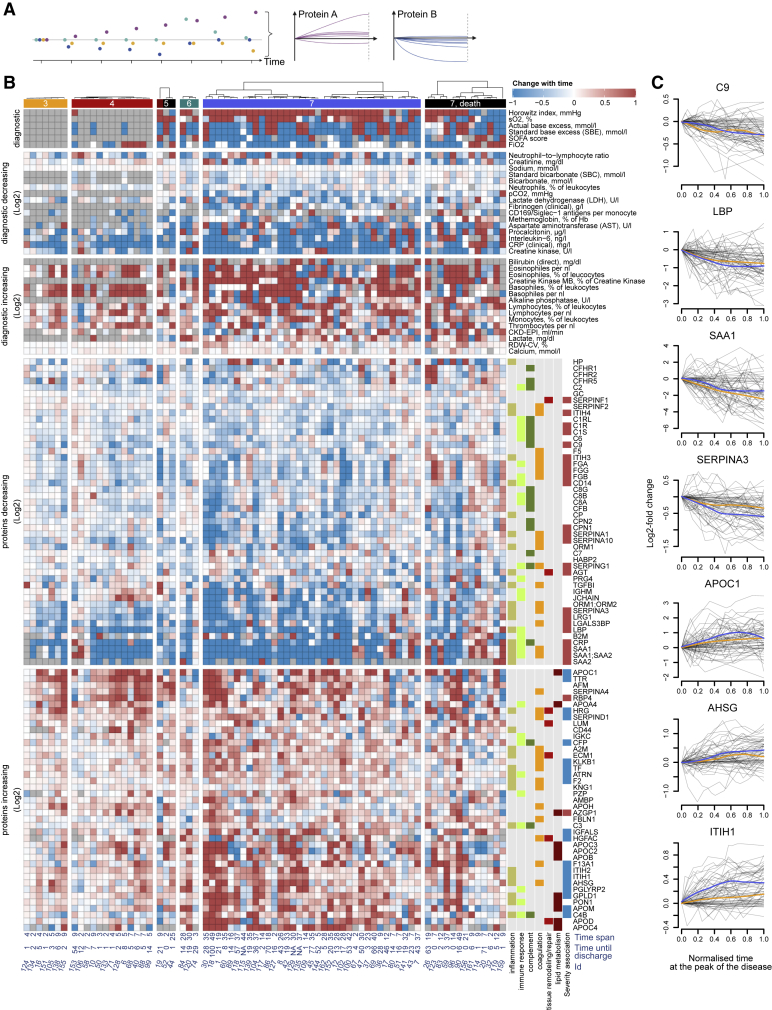
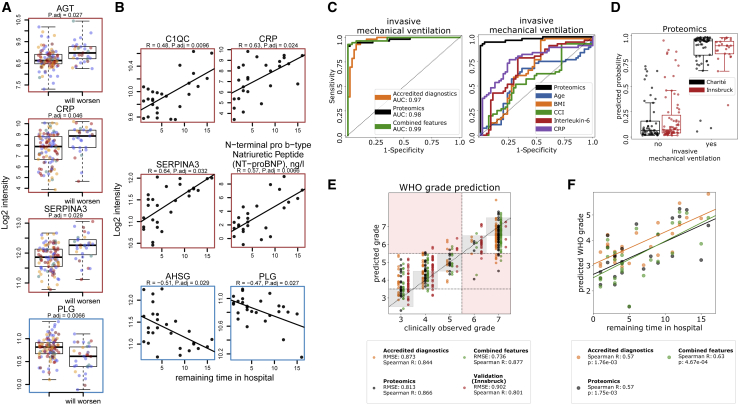
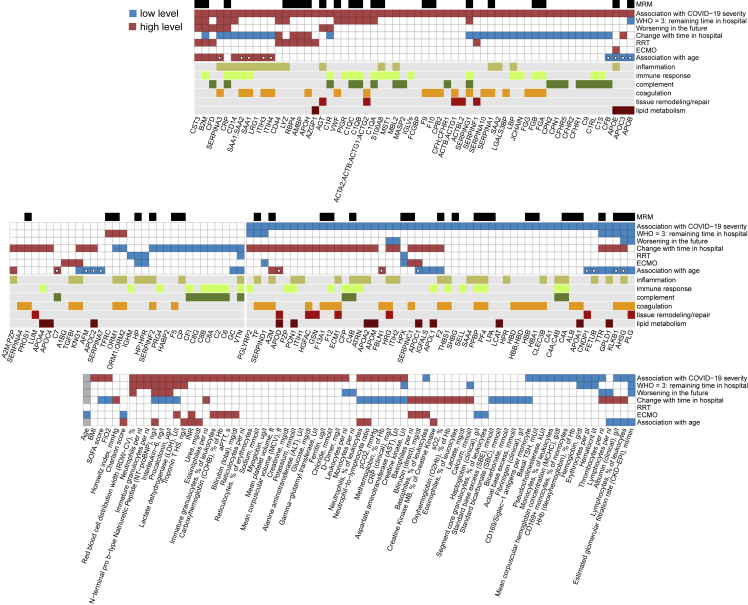
COVID-19 is highly variable in its clinical presentation, ranging from asymptomatic infection to severe organ damage and death. We characterized the time-dependent progression of the disease in 139 COVID-19 inpatients by measuring 86 accredited diagnostic parameters, such as blood cell counts and enzyme activities, as well as untargeted plasma proteomes at 687 sampling points. We report an initial spike in a systemic inflammatory response, which is gradually alleviated and followed by a protein signature indicative of tissue repair, metabolic reconstitution, and immunomodulation. We identify prognostic marker signatures for devising risk-adapted treatment strategies and use machine learning to classify therapeutic needs. We show that the machine learning models based on the proteome are transferable to an independent cohort. Our study presents a map linking routinely used clinical diagnostic parameters to plasma proteomes and their dynamics in an infectious disease.

Keywords: COVID-19; biomarkers; clinical disease progression; disease prognosis; longitudinal profiling; machine learning; patient trajectories; physiological parameters; proteomics.


Conflict of interest statement

Declaration of interests The authors declare no competing interests.

Figures

None
Graphical abstract
Figure 1
Figure 1
Interdependence of clinical, diagnostic, physiological and proteomic parameters during the clinical progression of COVID-19 (A) Study design. Schematic of the cohort of 139 patients with PCR-confirmed SARS-CoV-2 infection treated at Charité University Hospital Berlin. Plasma proteomics and accredited diagnostic tests were applied at 687 sampling points to generate high-resolution time series data for 86 routine diagnostic parameters and 321 protein quantities (see also Figures S1 and S2). (B) Covariation map for plasma proteins and routine diagnostic and physiological parameters. Statistically significant correlations (Spearman; p < 0.05) are colored. Dots indicate statistical significance after row-wise multiple-testing correction (false discovery rate [FDR] < 0.05), black rectangles—column-wise. The panel on the right of the heatmap provides manual functional annotation for the proteins (see also Figures S3 and S4, and Tables S4, S5, and S6). (C) Covariation of key diagnostic parameters and plasma protein markers (log2-transformed) in COVID-19 (see also Tables S4, S5, and S6). Dots colors correspond to the WHO grade of the patient, see Figure 2B.
Figure 2
Figure 2
The molecular phenotype of patients with COVID-19 and its dependency on severity and age (A) Plasma proteome and clinical diagnostic parameters in dependency of COVID-19 severity irrespective of age. The patients are grouped according to the maximum clinical treatment received (WHO ordinal scale), used as an indicator of disease severity (Table S1). 113 proteins and 55 routine diagnostic parameters vary significantly (FDR < 0.05) between patients of the different WHO groups upon accounting for age as a covariate using linear modeling (Ritchie et al., 2015). A fully annotated heatmap is provided in Figure S5 (see also Figure S6 and Table S3). (B) Selected protein markers and routine diagnostic parameters (log2-transformed) plotted against the WHO ordinal scale. (C) Selected proteins differentially abundant depending on age (FDR < 0.05). Left, colored: this data set (log2-transformed levels; statistical testing was performed by accounting for the WHO grade as a covariate Ritchie et al., 2015 and STAR methods; for visualization only, the data were corrected for the WHO grade); right, black: general population (log2-transformed levels; Generation Scotland cohort).
Figure 3
Figure 3
The progression of the COVID-19 molecular patient phenotype over time (A) Schematic: each patient is followed during inpatient care by repetitive sampling, and the “trajectory” of each of the proteins and the routine diagnostic features is analyzed (points of different colors at each time point) (see also Figure S2). (B) Protein levels and routine diagnostic parameters that change significantly (FDR < 0.05) over time during the peak of the disease, shown for individual patients stratified by their maximum treatment received (WHO grade): 89 proteins, 37 clinical diagnostic markers show time dependency during the disease course (illustrated as log2-fold changes or absolute value changes, as indicated). The panel to the right of the heatmap provides manual functional annotation for the proteins. Known associations with COVID-19 severity are indicated (blue - downregulated in severe COVID-19, and red - upregulated) (D’Alessandro et al., 2020; Laing et al., 2020; Messner et al., 2020; Shen et al., 2020). Below the heatmap, the time span between the first and the last sampling time point at the peak of the disease is indicated as well as the remaining time until the discharge (see also Figures S14 and S15, and Table S3). (C) Trajectories (change of log2-transformed levels with time) for selected proteins. Sampling points during the peak period of the disease (STAR methods) are considered. x axis: 0 – first time point measured at the peak of the disease, 1 – last. The y axis reflects the change relative to the first valid measurement during the peak of the disease. Loess approximations are shown for patients, which did (blue), and did not (orange), require invasive mechanical ventilation. See also Figure S16.
Figure 4
Figure 4
Predicting COVID-19 treatment requirement and future disease progression from the early molecular phenotype by using machine learning. (A) Selected proteins that are predictive (FDR < 0.05) of the future clinical deterioration of the disease (that is progression to a higher WHO grade in the future; STAR methods). Illustrated are the log2-transformed levels of the proteins at the first sampling point upon correction (for visualization only) for the impact of the WHO grade and age as covariates (Ritchie et al., 2015) (see also Figure S17). (B) Selected proteins and routine diagnostic parameters predictive (FDR < 0.05) of the remaining time in hospital for patients receiving mild treatment (WHO grade 3). Statistical testing was performed by including patient’s age as a covariate (STAR methods). Illustrated are the log2-transformed levels of the proteins (upon correction for age as a covariate, for visualization only) at the first sampling point, plotted against the remaining time in hospital (days) (see also Figure S18). (C) Left: performance of a machine learning model characterizing the need for invasive mechanical ventilation, based on either the proteomic data, accredited diagnostic parameters, or both. Right: comparison of the performance of a machine learning model characterising the need for invasive mechanical ventilation based on proteomic data to established prognostic parameters. (D) Prediction performance, based on the proteome, visualized as boxplots. Cross-validation predictions on the Charité cohort are shown in black, predictions of a model trained on the Charité data and then applied to an independent cohort from another hospital (Innsbruck cohort) are shown in red. (E) Prediction of the WHO grade itself using machine learning (cross-validated, first time point at the maximum treatment level for each patient is used, STAR methods), based on either the proteome, clinical diagnostic parameters, or both. The performance of the proteomic model trained on the Charité cohort and applied to the Innsbruck cohort is also shown. (F) A machine learning model was trained to predict the level of necessary treatment (WHO grade) using the data (proteomics, clinical, or both) from the first time point measured for each patient. Derived predictions for patients who did not receive supplemental oxygen at this time point (WHO = 3) were plotted against the remaining time (days) in hospital for these patients.
Figure 5
Figure 5
Summary: association of individual plasma proteins, routine diagnostic and physiological parameters with severity, necessary therapy, and progression of COVID-19. For each statistical test considered (association with WHO grade, prediction of the remaining time in hospital for patients at WHO grade 3, prediction of worsening, i.e., progression to a higher WHO grade in the future, the trend during the peak period of the disease, association with RRT, association with ECMO and association with higher patient age), measurements, which show significant differences are highlighted, with the color indicating the trend, e.g., red for CST3 in the “Association with COVID-19 severity” test indicates higher levels of CST3 in severely ill patients. Proteins for which MRMAssayDB (Bhowmick et al., 2018) lists that a targeted proteomic assay has been developed are indicated with a black bar at the top. Proteins which change significantly with age in the Charité COVID-19 cohort (FDR < 0.05) but do not change significantly (p < 0.05) with age in the general population (Generation Scotland cohort), are highlighted with a white circle in the 7th row (“Association with age”). See also Figures S6–S8, S10, S11, S14, S17, and S18, and Table S3.

References

    1. Aĝirbaşli M., Song J., Lei F., Wang S., Kunselman A.R., Clark J.B., Myers J.L., Ündar A. Apolipoprotein E levels in pediatric patients undergoing cardiopulmonary bypass. Artif. Organs. 2015;39:28–33. - PubMed
    1. Alwan N.A., Burgess R.A., Ashworth S., Beale R., Bhadelia N., Bogaert D., Dowd J., Eckerle I., Goldman L.R., Greenhalgh T. Scientific consensus on the COVID-19 pandemic: we need to act now. Lancet. 2020;396:e71–e72. - PMC - PubMed
    1. Anderson N.L., Anderson N.G. The human plasma proteome: history, character, and diagnostic prospects. Mol. Cell. Proteomics. 2002;1:845–867. - PubMed
    1. ARDS Definition Task Force, Ranieri V.M., Rubenfeld G.D., Thompson B.T., Ferguson N.D., Caldwell E., Fan E., Camporota L., Slutsky A.S. Acute respiratory distress syndrome: the Berlin definition. JAMA. 2012;307:2526–2533. - PubMed
    1. Banda M.J., Rice A.G., Griffin G.L., Senior R.M. Alpha 1-proteinase inhibitor is a neutrophil chemoattractant after proteolytic inactivation by macrophage elastase. J. Biol. Chem. 1988;263:4481–4484. - PubMed

Publication types