. 2021 Jun 24;184(13):3438-3451.e10.
doi: 10.1016/j.cell.2021.05.031. Epub 2021 May 24.

Binding and molecular basis of the bat coronavirus RaTG13 virus to ACE2 in humans and other species

Affiliations

Binding and molecular basis of the bat coronavirus RaTG13 virus to ACE2 in humans and other species

Kefang Liu et al. Cell. .

Abstract

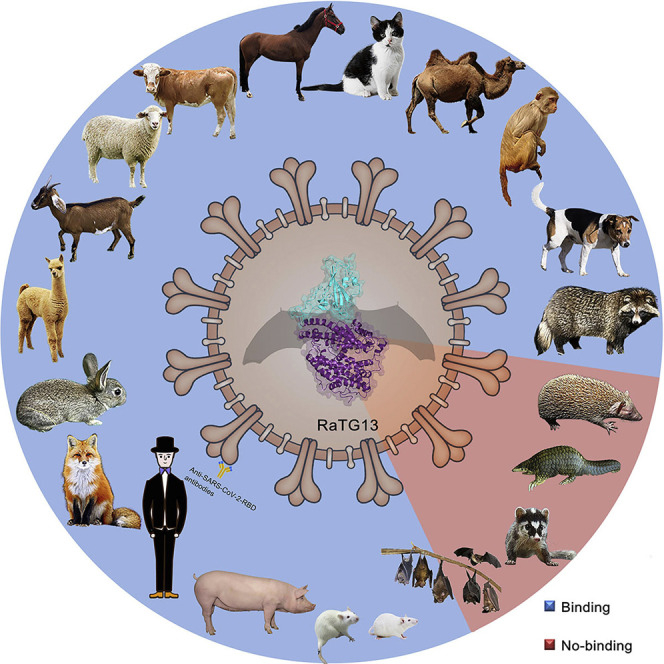
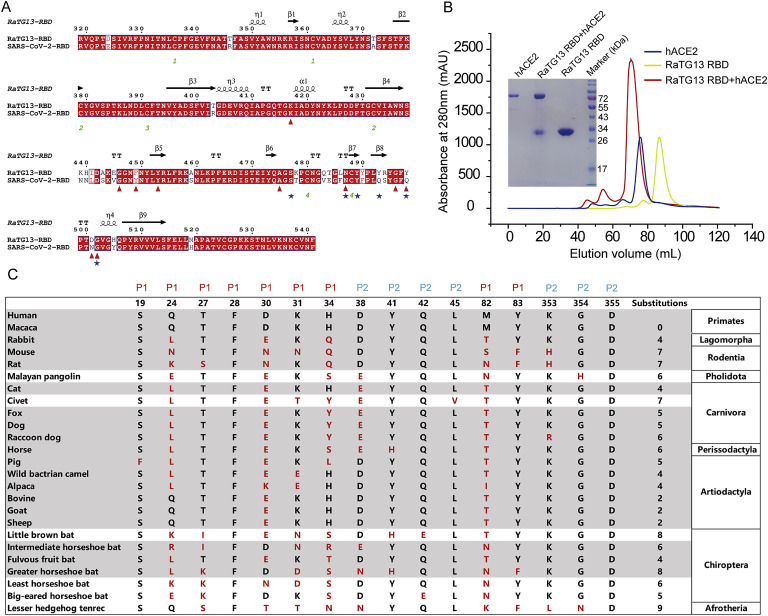
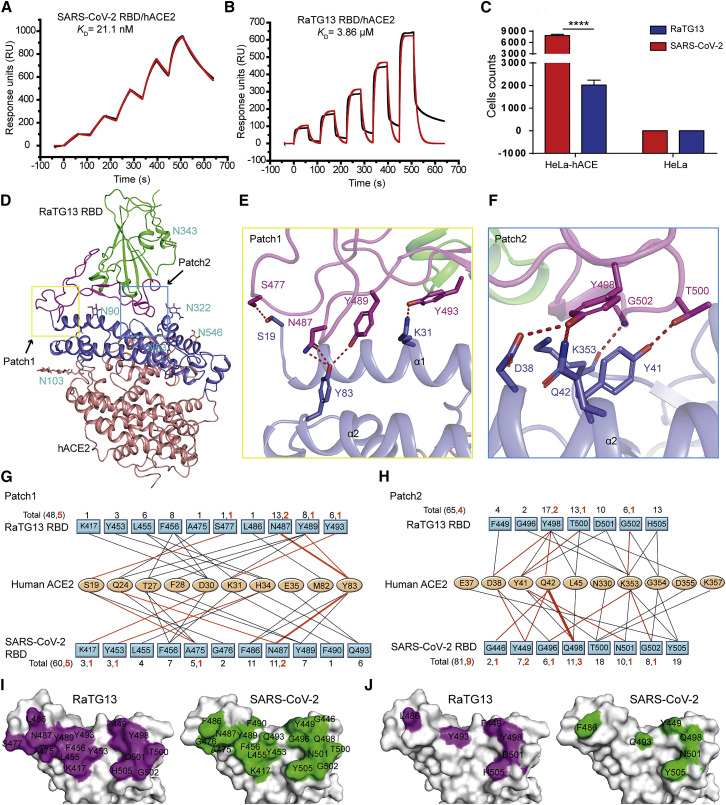
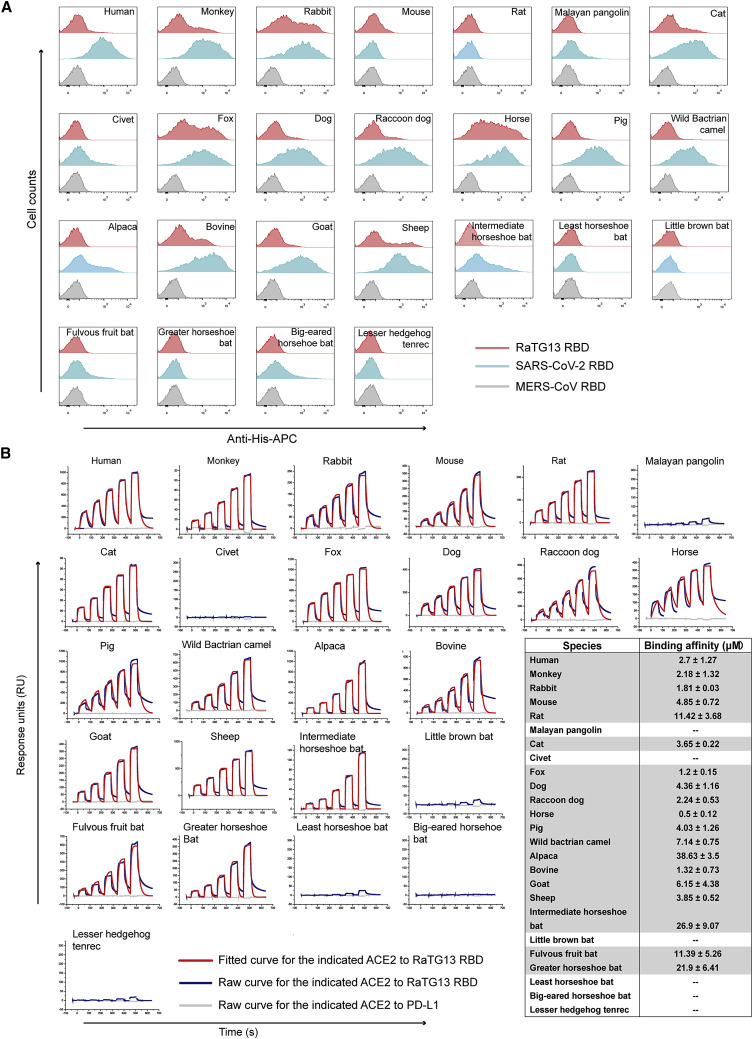
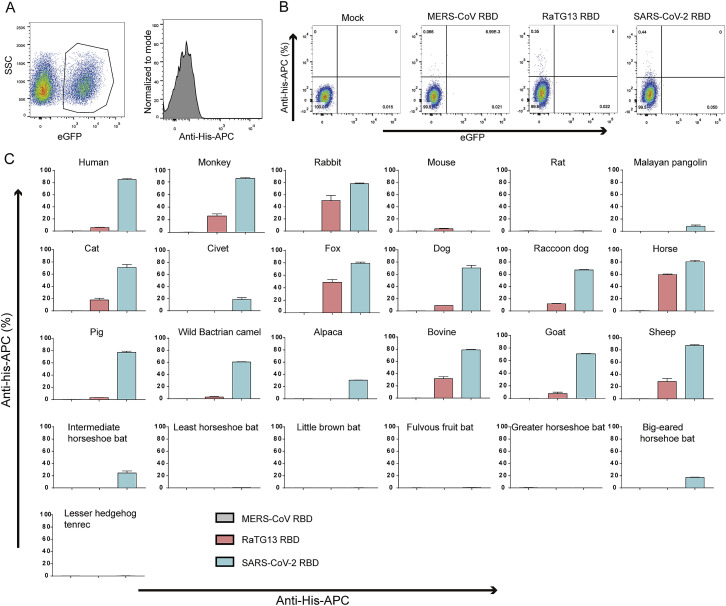
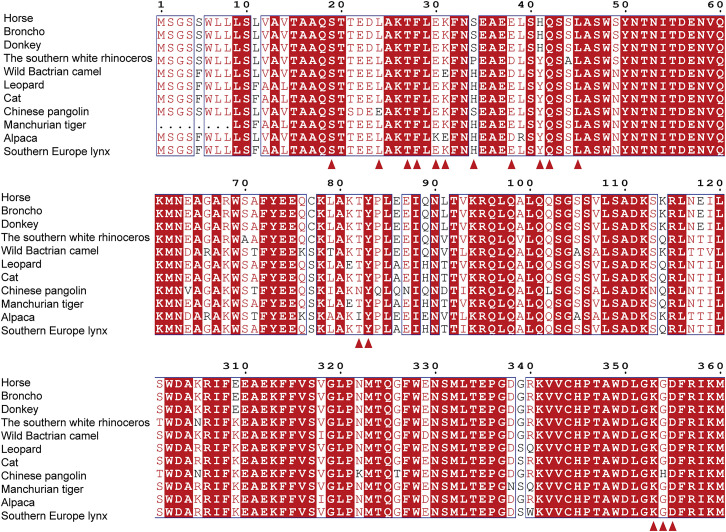
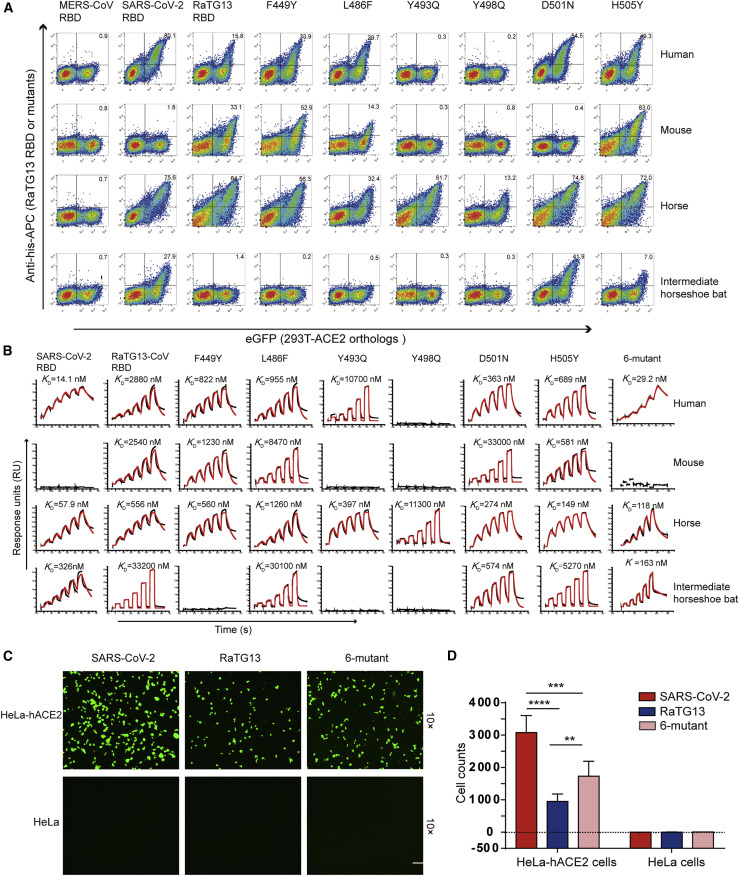
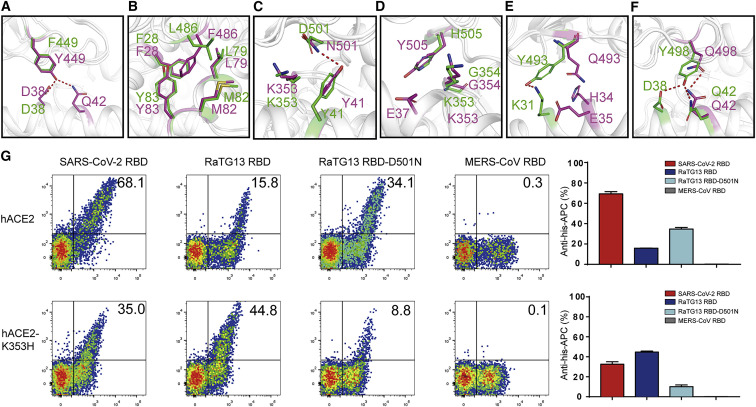
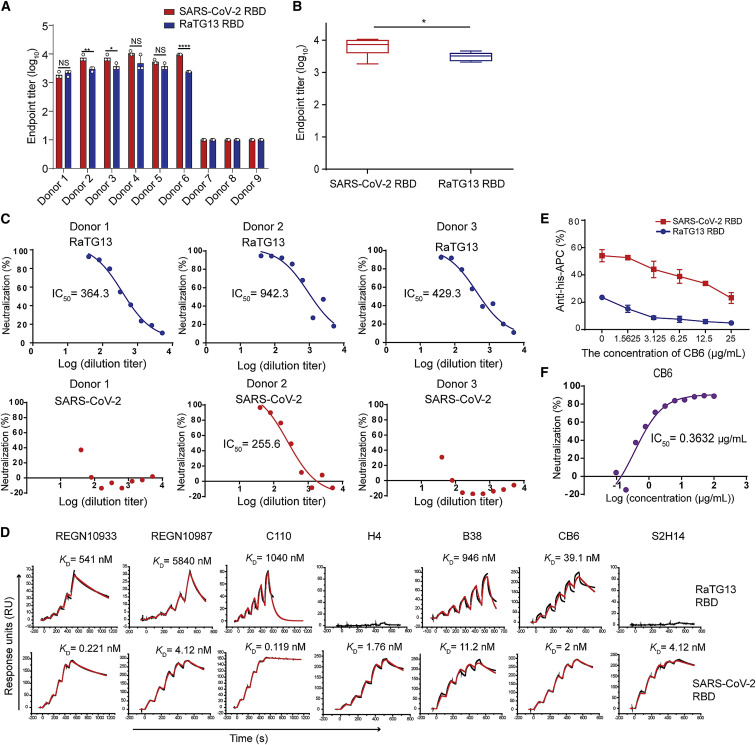
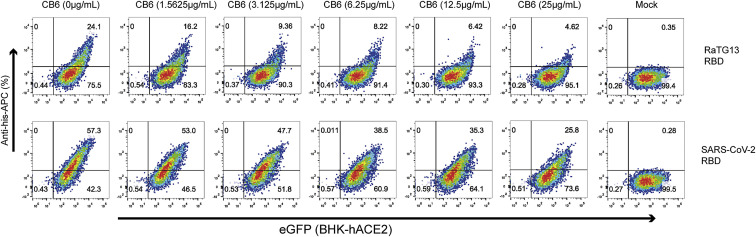
Severe acute respiratory syndrome coronavirus 2 (SARS-CoV-2) has been spreading worldwide, causing a global pandemic. Bat-origin RaTG13 is currently the most phylogenetically related virus. Here we obtained the complex structure of the RaTG13 receptor binding domain (RBD) with human ACE2 (hACE2) and evaluated binding of RaTG13 RBD to 24 additional ACE2 orthologs. By substituting residues in the RaTG13 RBD with their counterparts in the SARS-CoV-2 RBD, we found that residue 501, the major position found in variants of concern (VOCs) 501Y.V1/V2/V3, plays a key role in determining the potential host range of RaTG13. We also found that SARS-CoV-2 could induce strong cross-reactive antibodies to RaTG13 and identified a SARS-CoV-2 monoclonal antibody (mAb), CB6, that could cross-neutralize RaTG13 pseudovirus. These results elucidate the receptor binding and host adaption mechanisms of RaTG13 and emphasize the importance of continuous surveillance of coronaviruses (CoVs) carried by animal reservoirs to prevent another spillover of CoVs.

Keywords: ACE2; COVID-19; RBD; RaTG13; SARS-CoV-2; intermediate horseshoe bat.


Conflict of interest statement

Declaration of interests The authors declare no competing interests.

Figures

None
Graphical abstract
Figure S1
Figure S1
Structure-based sequence alignment and protein expression, related to Figure 1 (A) Structure-based sequence alignment of SARS-CoV-2 RBD and RaTG13 RBD. Coils indicate α helices, and black arrows indicate β strands. Conserved residues are highlighted in red. Residues of SARS-CoV-2 RBD or RaTG13 RBD contact with hACE2 through hydrogen bonds are marked with red triangle or blue star, respectively. Sequence alignment is generated with ClustalX and ESPript. (B) Gel filtration profiles of hACE2 (blue), RaTG13 RBD (yellow) and the RaTG13 RBD/hACE2 complex (red) were analyzed and displayed. The separation profiles of each pooled samples on SDS-PAGE are shown in reducing conditions (+DTT). (C) Characteristics of the RaTG13 RBD-binding residues of ACE2s. The conserved residues among 25 ACE2 orthologs are shown as black letters and the residue substitutions in the ACE2 of 24 species comparing with human ACE2 are shown as red letters.
Figure 1
Figure 1
Structural basis of binding between the RaTG13 RBD and hACE2 (A and B) SPR characterization of the SARS-CoV-2 RBD (A) and RaTG13 RBD (B) interacting with hACE2. (C) Entry of the SARS-CoV-2 and RaTG13 pseudovirus into HeLa cells expressing the hACE2 (HeLa-hACE2s). Data represent the mean ± SD of six replicates. p < 0.05, ∗∗p < 0.01, ∗∗∗p < 0.001, ∗∗∗∗p < 0.0001 (two-tailed unpaired t test). (D) Overall structure of the RaTG13 RBD in complex with hACE2. Boxes indicate the patches of the RaTG13 RBD/hACE2 complex. (E and F) The hydrogen bond networks of patch 1 (E) and patch 2 (F). The complex structure is shown as a cartoon, and residues taking part in hydrogen bond formation are shown as sticks. (G and H) Residues involved in the interaction of hACE2 with the RaTG13 RBD or SARS-CoV-2 RBD are listed and connected by solid lines. Black lines indicate vdw contacts, and red lines represent an H-bond or salt bridge. (I) The binding surface of hACE2 with the RaTG13 RBD (left) or SARS-CoV-2 RBD (right). (J) Six different residues between RaTG13 RBD and SARS-CoV-2 RBD among RaTG13 RBD binding sites are labeled. See also Figure S1.
Figure 2
Figure 2
Binding between ACE2 orthologs and the SARS-CoV-2 RBD or RaTG13 RBD (A) Flow cytometry analysis of binding between 25 ACE2 orthologs and the SARS-CoV-2 RBD or RaTG13 RBD. HEK293T cells expressing EGFP-fused ACE2s are stained with the indicated His-tagged proteins (RaTG13 RBD, SARS-CoV-2 RBD, and MERS-CoV RBD). An anti-His/Allophycocyanin (APC) antibody is used to detect His-tagged proteins. The MERS-CoV RBD is used as a negative control. (B) SPR characterizations of the binding between 25 ACE2 orthologs and the RaTG13 RBD. ACE2s with a mouse Fc (mFc) tag are immobilized on a CM5 chip. SPR characterizations of the binding affinity between the RaTG13 RBD and each ACE2 ortholog are shown. PD-L1 is used as a negative control. Raw and fitted curves are displayed as blue and red lines, respectively. Data represent the mean ± SD of three independent experiments. See also Figures S2 and S3 and Tables S1 and S2.
Figure S2
Figure S2
Gating strategy and statistics for flow cytometric analysis of the binding between ACE2s and the SARS-CoV-2 RBD or RaTG13 RBD, related to Figure 2 (A) Gating strategy for flow cytometric analysis of the binding between ACE2s and SARS-CoV-2 RBD or SARS-CoV RBD. eGFP-positive HEK293T cells are gated first, followed by analysis of anti-his-APC positive cells. (B) Dot plot of untransfected HEK293T cells stained by MERS-CoV RBD, RaTG13 RBD and SARS-CoV-2 RBD proteins. (C) Frequency of SARS-CoV-2 RBD or RaTG13 RBD positive HEK293T cells expressing hACE2. MERS-CoV RBD is used as negative control. Data represent the results of three replicates, and error bars show the SD of each measurement.
Figure S3
Figure S3
Structure-based sequence alignment of horse ACE2 and 10 ACE2 orthologs most closely related to horse ACE2, related to Figure 2 Coils indicate α helices, and black arrows indicate β strands. Conserved residues are highlighted in red. Residues highlighted in blue boxes are highly (80%) conserved, with consensus amino acids in red. Residues of hACE2 marked with blue star indicate key binding residues with RaTG13 RBD. Sequence alignment is generated with ClustalX, and ESPript.
Figure 3
Figure 3
Mutational analysis of the key residues in RaTG13 involved in interaction with hACE2 (A) Flow cytometry analysis of binding between the six RaTG13 RBD mutants and ACE2s from human, mouse, horse, or intermediate horseshoe bat. SARS-CoV-2 RBD and MERS-CoV RBD are used as control. (B) SPR analysis of the binding affinity between wild-type/mutated RaTG13 RBD with ACE2s from human, mouse, horse, or intermediate horseshoe bat, respectively. Raw and fitted curves are displayed as blue and red lines, respectively. (C) Entry of the pseudovirus of SARS-CoV-2, RaTG13, and 6-mutant RaTG13 into HeLa-hACE2s. Green fluorescent HeLa-hACE2s indicate pseudovirus-transducing-cells. Untransfected HeLa cells were used as negative controls. The scale bar indicates 150 μm. (D) Statistics for transduction of the SARS-CoV-2, RaTG13, and 6-mutant RaTG13 pseudoviruses. Data represent the results of six replicates. All data are presented as mean ± SD. p < 0.05, ∗∗p < 0.01, ∗∗∗p < 0.001, ∗∗∗∗p < 0.0001 (two-tailed unpaired t test). See also Figure S4 and Table S3.
Figure S4
Figure S4
Percentage of ACE2-positive cells among total EGFP-positive cells, related to Figure 3 The percentage of SARS-CoV-2 RBD and RaTG13 RBD positive cells in HEK293T cells with different ACE2 othologs. Data represent the results of three replicates, and error bars show the SD of each measurement.
Figure 4
Figure 4
Structural and functional analysis of the role of each key residue between ACE2 orthologs and the RaTG13 RBD or SARS-CoV-2 RBD (A–F) Structural comparison of the binding between hACE2 and the RaTG13 RBD or SARS-CoV-2 RBD. Substituted residues on the RaG13 RBD and SARS-CoV-2 RBD are shown in green and purple, respectively. Key residues are shown as sticks with corresponding colors. (G) Flow cytometric analysis of the effect of D501 and N501 of the RaTG13 RBD and K353 and H353 of hACE2. Bar graphs indicate the ratio of anti-His-positive cells in HEK293T cells with hACE2 expression.
Figure 5
Figure 5
The cross-reactive immune response of SARS-CoV-2 to RaTG13 (A) Enzyme-linked immunosorbent assay (ELISA) measurement of the titers of SARS-CoV-2 RBD- and RaTG13 RBD-specific immunoglobulin G (IgG) in serum samples. (B) Statistic of the titers of SARS-CoV-2 RBD- and RaTG13 RBD-specific IgG in six convalescent individuals’ serum samples. Data are presented as mean ± SD. p < 0.05 (two-tailed unpaired t test). (C) Neutralization of the RaTG13 or SARS-CoV-2 pseudovirus by antisera from three convalescent individuals. (D) SPR characterization of the binding affinities of the SARS-CoV-2 RBD or RaTG13 RBD with the indicated antibodies. (E) The ratio of SARS-CoV-2 RBD- and RaTG13 RBD-binding cells among Baby Hamster Syrian Kidney cells with hACE2 expression (BHK-hACE2 cells) in the presence of CB6. Data represent the results of three replicates. Data are presented as mean ± SD. (F) Neutralization of the RaTG13 or SARS-CoV-2 pseudovirus by the CB6 antibody. See also Figure S5 and Table S4.
Figure S5
Figure S5
Blocking of the binding between HeLa-hACE2 cells and the SARS-CoV-2 RBD or RaTG13 RBD by CB6, related to Figure 5 CB6 was serially diluted by 2 folds, followed by incubation with SARS-CoV-2 RBD or RaTG13 RBD. Blocking efficacies were analyzed through staining BHK-hACE2 cells. Cells stained with SARS-CoV-2 RBD or RaTG13 RBD proteins was used as a positive control. Unstained HeLa-hACE2 cells were used as negative controls.

References

    1. Adams P.D., Afonine P.V., Bunkóczi G., Chen V.B., Davis I.W., Echols N., Headd J.J., Hung L.W., Kapral G.J., Grosse-Kunstleve R.W., et al. PHENIX: a comprehensive Python-based system for macromolecular structure solution. Acta Crystallogr. D Biol. Crystallogr. 2010;66:213–221. - PMC - PubMed
    1. Barnes C.O., Jette C.A., Abernathy M.E., Dam K.A., Esswein S.R., Gristick H.B., Malyutin A.G., Sharaf N.G., Huey-Tubman K.E., Lee Y.E., et al. SARS-CoV-2 neutralizing antibody structures inform therapeutic strategies. Nature. 2020;588:682–687. - PMC - PubMed
    1. Boni M.F., Lemey P., Jiang X., Lam T.T., Perry B.W., Castoe T.A., Rambaut A., Robertson D.L. Evolutionary origins of the SARS-CoV-2 sarbecovirus lineage responsible for the COVID-19 pandemic. Nat. Microbiol. 2020;5:1408–1417. - PubMed
    1. Chan J.F., Kok K.H., Zhu Z., Chu H., To K.K., Yuan S., Yuen K.Y. Genomic characterization of the 2019 novel human-pathogenic coronavirus isolated from a patient with atypical pneumonia after visiting Wuhan. Emerg. Microbes Infect. 2020;9:221–236. - PMC - PubMed
    1. Conceicao C., Thakur N., Human S., Kelly J.T., Logan L., Bialy D., Bhat S., Stevenson-Leggett P., Zagrajek A.K., Hollinghurst P., et al. The SARS-CoV-2 Spike protein has a broad tropism for mammalian ACE2 proteins. PLoS Biol. 2020;18:e3001016. - PMC - PubMed

Publication types