. 2021 Nov;161(5):1692-1694.
doi: 10.1053/j.gastro.2021.06.013. Epub 2021 Jun 15.

Sentinel Acute Pancreatitis Event Increases Severity of Subsequent Episodes in Mice

Affiliations

Sentinel Acute Pancreatitis Event Increases Severity of Subsequent Episodes in Mice

Andrea Geisz et al. Gastroenterology. 2021 Nov.
No abstract available


Conflict of interest statement

Conflict of interest: No conflicts to declare.

Figures

Figure 1.
Figure 1.
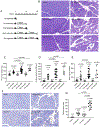
Recurrent acute pancreatitis in C57BL/6N mice. A, Experimental protocol of modeling recurrent acute pancreatitis. Solid triangles indicate an episode of acute pancreatitis elicited by 10 hourly injections of cerulein. Vertical lines indicate time of euthanasia. B, Hematoxylin-eosin stained histological sections of the pancreas from mice during the 1st, 2nd and 3rd pancreatitis episodes and from mice that recovered from the 1st and 2nd episodes. Scale bars correspond to 100 μm. C, Pancreas weight, D, plasma amylase activity and E, pancreas myeloperoxidase (MPO) content in mice during the 1st, 2nd and 3rd pancreatitis episodes and from mice that recovered from the 1st and 2nd episodes. For clarity, data from the saline-treated control groups of mice were pooled and graphed as a single group. F, Immunohistochemistry staining for the F4/80 macrophage marker in pancreas sections from mice with 1 or 2 episodes of acute pancreatitis and mice that recovered from an acute episode. Scale bars correspond to 50 μm. G, Quantitative analysis of F4/80 positive cells per visual field. Individual values with means ± SD are shown. The difference of means between two groups was analyzed by two-tailed unpaired t-test.

References

    1. Yadav D, Lowenfels AB Gastroenterology 2013, 144: 1252–1261 - PMC - PubMed
    1. Whitcomb DC Gut 1999, 45: 317–322 - PMC - PubMed
    1. Schneider A, et al. Best Pract Res Clin Gastroenterol 2002, 16: 347–363 - PubMed
    1. Whitcomb DC Gastroenterology 2013, 144: 1292–1302 - PMC - PubMed
    1. Whitcomb DC, et al. Pancreatology 2016, 16: 218–224 - PMC - PubMed

Publication types

MeSH terms