. 2021:20:100113.
doi: 10.1016/j.mcpro.2021.100113. Epub 2021 Jun 15.

Proteome Profiling of Recombinant DNase Therapy in Reducing NETs and Aiding Recovery in COVID-19 Patients

Affiliations

Proteome Profiling of Recombinant DNase Therapy in Reducing NETs and Aiding Recovery in COVID-19 Patients

Jane Fisher et al. Mol Cell Proteomics. 2021.

Abstract

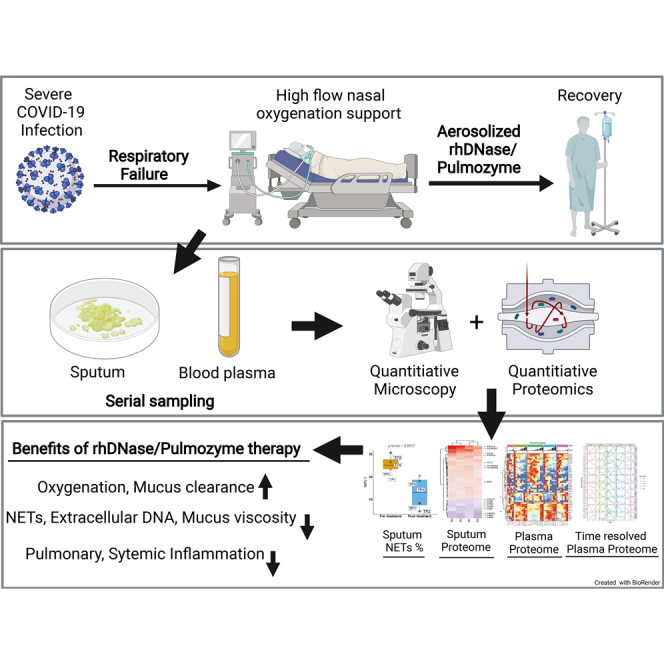
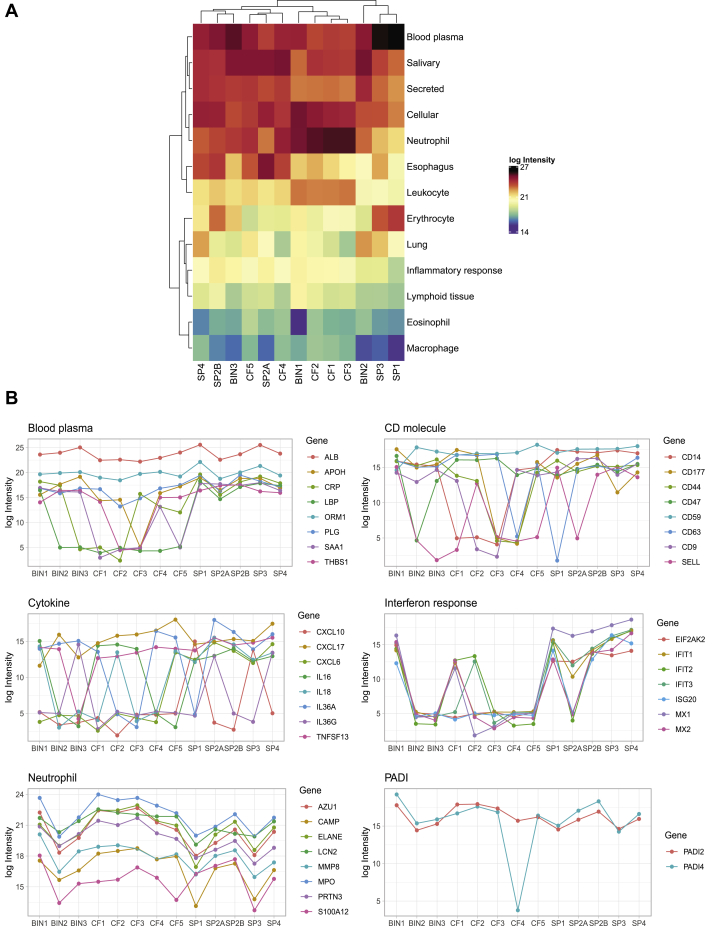
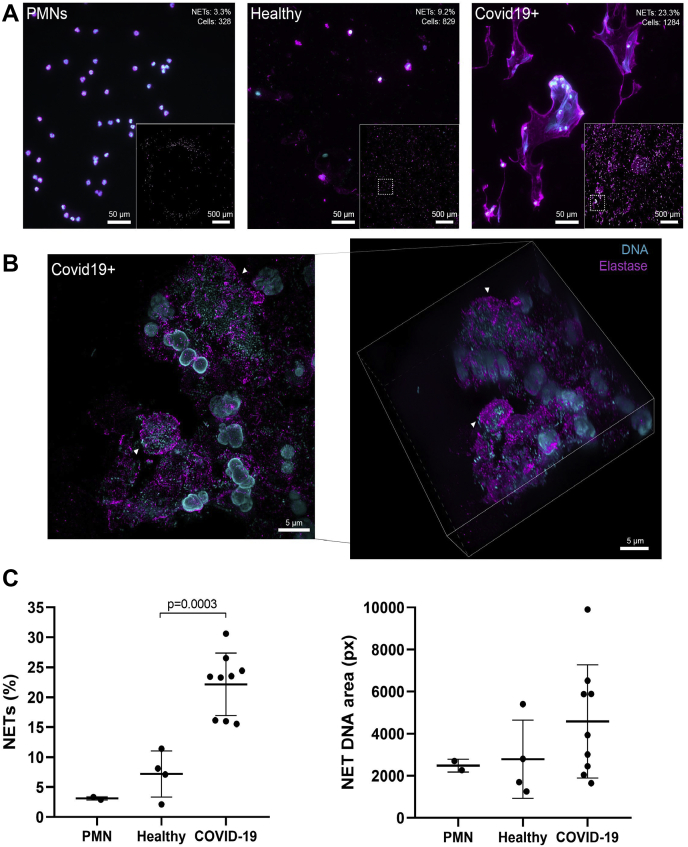
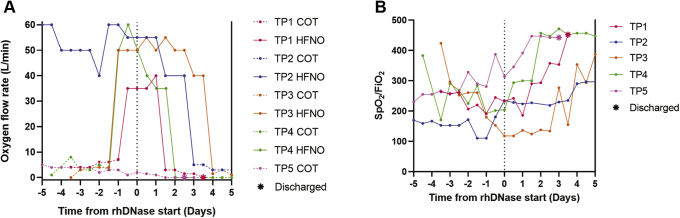
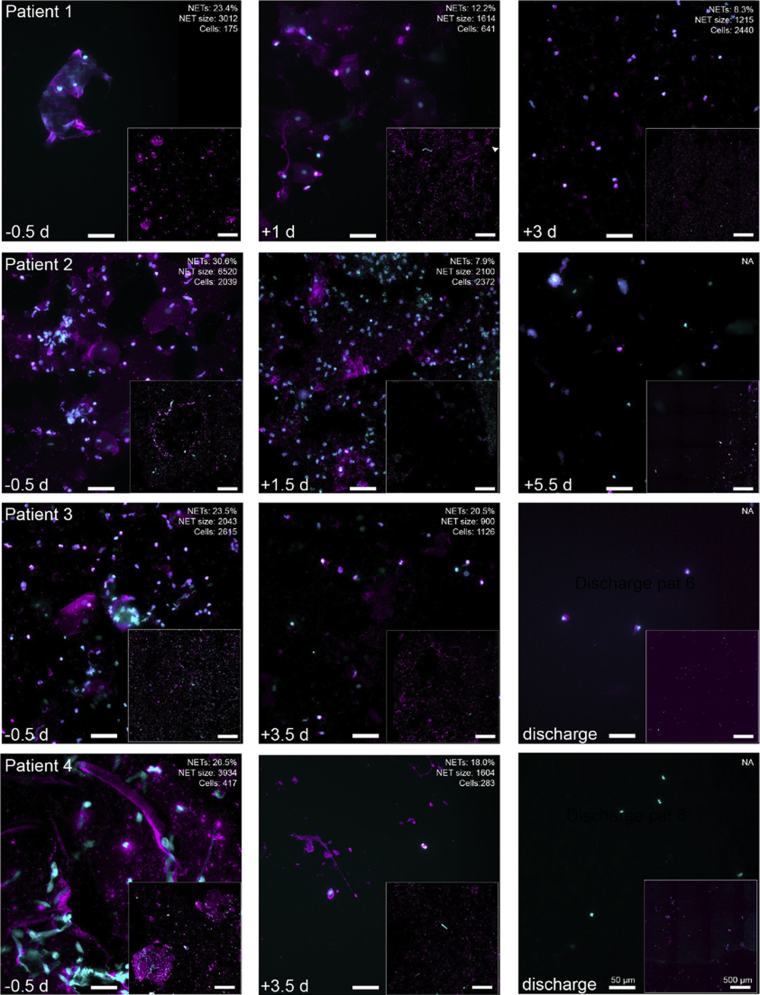
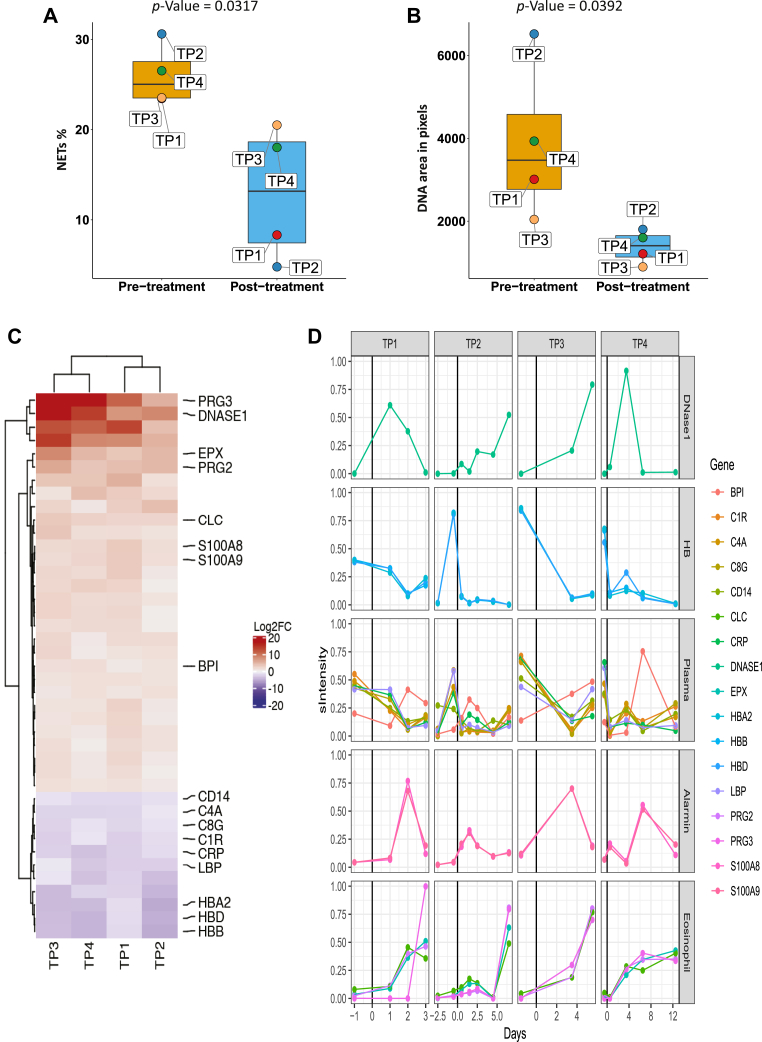
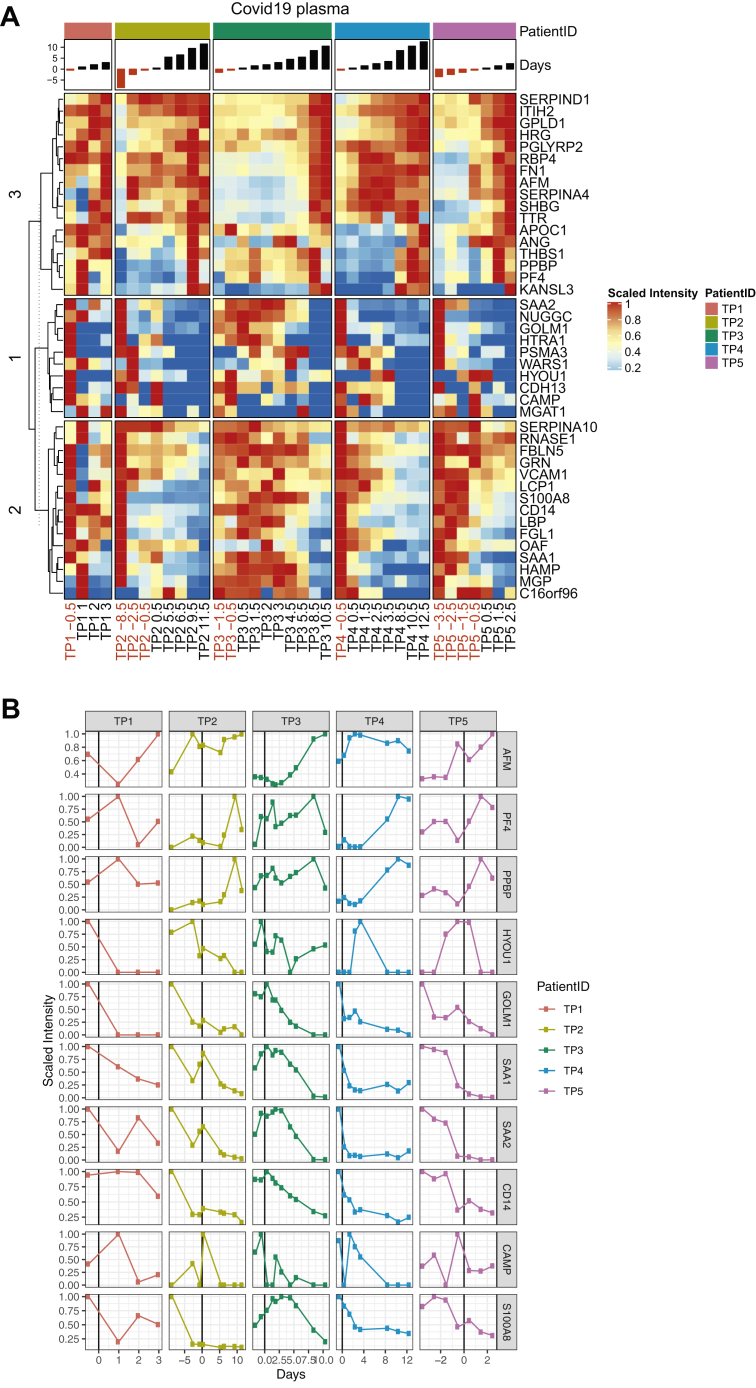
Severe coronavirus disease 2019 (COVID-19) can result in pneumonia and acute respiratory failure. Accumulation of mucus in the airways is a hallmark of the disease and can result in hypoxemia. Here, we show that quantitative proteome analysis of the sputum from severe patients with COVID-19 reveal high levels of neutrophil extracellular trap (NET) components, which was confirmed by microscopy. Extracellular DNA from excessive NET formation can increase sputum viscosity and lead to acute respiratory distress syndrome. Recombinant human DNase (Pulmozyme; Roche) has been shown to be beneficial in reducing sputum viscosity and improve lung function. We treated five patients pwith COVID-19 resenting acute symptoms with clinically approved aerosolized Pulmozyme. No adverse reactions to the drug were seen, and improved oxygen saturation and recovery in all severely ill patients with COVID-19 was observed after therapy. Immunofluorescence and proteome analysis of sputum and blood plasma samples after treatment revealed a marked reduction of NETs and a set of statistically significant proteome changes that indicate reduction of hemorrhage, plasma leakage and inflammation in the airways, and reduced systemic inflammatory state in the blood plasma of patients. Taken together, the results indicate that NETs contribute to acute respiratory failure in COVID-19 and that degrading NETs may reduce dependency on external high-flow oxygen therapy in patients. Targeting NETs using recombinant human DNase may have significant therapeutic implications in COVID-19 disease and warrants further studies.


Conflict of interest statement

Conflict of interest A. L. and J. M. have a patent “Treatment of subjects suffering from COVID-19” pending. All authors declare that they have no conflicts of interest with the contents of this article.

Figures

None
Graphical abstract
Fig. 1
Fig. 1
Characterization of lung sputum from COVID-19 patients using MS-based proteomics. Sputum from severely ill COVID-19 patients (SP1–4, n = 4), cystic fibrosis (CF1–5, n = 5), and bacterial infections (BIN1–3, n = 3) was collected and analyzed using MS. Two samples from a single patient (SP2A and SP2B), collected 2 days apart, were included in the analysis. About 2037 proteins were discovered in sputum with 1% FDR (supplemental Table S1). Proteins were then assigned manually to 13 protein classes using protein functions in Swiss-Uniprot and human protein atlas. A, heat map showing the log10 intensities of the assigned protein classes in lung sputum (n = 5) from four COVID-19 patients, CF (n = 5), and bacterial infections (n = 3). B, plots of individual protein intensities grouped by class in the different sputums. The mapped gene names of the proteins are indicated. FDR, false discovery rate.
Fig. 2
Fig. 2
NETs in the sputum of SARS-CoV2 positive who were not treated with rhDNase and healthy controls.A, widefield microscopy of neutrophil elastase (magenta, antielastase antibody) and DNA (cyan, DAPI) in sputum samples or purified neutrophils. Insets show stitched overview image from 6 × 6 images of the samples. Quantification of single cell–level NETs (percent of cells and number of cells) of each overview is shown in the top corner of representative images. B, super-resolution microscopy of neutrophil elastase (magenta, antielastase antibody) and DNA (cyan, DRAQ5) in a nontreated patient sample. Left, maximum intensity projection of structured illumination microscopy Z-stack. Right, isometric view of Z-stack. Arrowheads show either a fully formed NET (top) or a neutrophil with decondensed DNA undergoing NETosis (bottom). C, quantitative data of A are shown as the percentage of NET-positive cells and the corresponding average area that the DNA signals covers in each cell. Each point indicates quantification of 36 images from independent samples. Lines indicate the mean for each category. DAPI, 4,6 diamidino-2-phenylindole; NETs, neutrophil extracellular traps; rhDNase, recombinant human DNase I; SARS-CoV2, severe acute respiratory syndrome coronavirus 2.
Fig. 3
Fig. 3
Oxygen requirements and SpO2/FiO2ratios of patients receiving rhDNase. Severely ill patients with COVID-19 that required high-flow nasal oxygen (HFNO) or conventional oxygen therapy (COT) (n = 5) were treated with aerosolized rhDNase (TP1–5). Dashed vertical line at the center of the graph denotes start of rhDNase treatment. Oxygen flow rate (A) and estimated SpO2/FiO2 ratio (B) of patients receiving HFNO therapy at the time of rhDNase treatment start. Solid lines are flow rate during HFNO, whereas dashed lines are flow rate during COT. Asterisks indicate hospital discharge. COVID-19, coronavirus disease 2019; FiO2, fraction of inspired oxygen; rhDNase, recombinant human DNase I; SpO2, the oxygen saturation as measured by pulse oximetry.
Fig. 4
Fig. 4
NETs and neutrophil proteins in the sputum of patients receiving rhDNase. Sputum could be collected from four of five patients who received rhDNase treatment. Widefield microscopy of neutrophil elastase (magenta, antielastase ab) and DNA (cyan, DAPI) in sputum samples from treated patients (TP 1–4). Insets show stitched overview image from 6 × 6 images of the samples. Quantification of single cell–level NETs (percent of cells, average NET size, and number of cells) of each overview is shown in the top corner of representative images. The scale bars are the same for each image and corresponds to 50 μm (high magnification) or 500 μm (overview inset), respectively. Day of. sputum sampling is indicated in the bottom left corner. For some images, there were too few cells (<100) identified for reliable quantification, and thus they were excluded from the analysis. The images shown in this figure are part of the NETs quantification in Figure 5, A and B. DAPI, 4,6 diamidino-2-phenylindole; NETs, neutrophil extracellular traps; rhDNase, recombinant human DNase I.
Fig. 5
Fig. 5
Differential analysis of sputum protein abundance levels between COVID-19 patients before and after DNAse1 treatment.A, heat map of 45 proteins (rows) identified to change with rhDNase treatment by using t statistics (supplemental Fig. S5) in five patients (TP1–TP5). The mapped gene name for each protein is indicated to the right. The columns for each patient are the days relative to rhDNase treatment start (day 0) and are plotted as bar plots above the heat map. Colors in the heat map represent the scaled intensity per protein and patient (where maximum intensity is set to 1). B, individual plots of ten selected proteins from A (the scaled intensity is the same as in A). The vertical black lines in plots indicate day 0 (rhDNase treatment start). COVID-19, coronavirus disease 2019; rhDNase, recombinant human DNase I.
Fig. 6
Fig. 6
Differential analysis of plasma protein abundance levels between COVID-19 patients before and after DNAse1 treatment.A, heat map of 45 proteins (rows) identified to change after DNAse1 treatment by using t test statistics (supplemental Fig. S5 in five patients [TP1–TP5]). The mapped gene name for each protein is indicated to the right. The columns for each patient are the days relative to DNAse1 treatment start (day 0) and are plotted as bar plots above the heat map. Colors in the heat map represent the scaled intensity per protein and patient (where maximum intensity is set to 1). B, individual plots of ten selected proteins from A) (the scaled intensity is the same as in A). The vertical black lines in plots indicate day 0 (DNAse1 treatment start). COVID-19, coronavirus disease 2019.

References

    1. Huang C., Wang Y., Li X., Ren L., Zhao J., Hu Y., Zhang L., Fan G., Xu J., Gu X., Cheng Z., Yu T., Xia J., Wei Y., Wu W. Clinical features of patients infected with 2019 novel coronavirus in Wuhan, China. Lancet. 2020;395:497–506. - PMC - PubMed
    1. Liu K., Chen Y., Lin R., Han K. Clinical features of COVID-19 in elderly patients: A comparison with young and middle-aged patients. J. Infect. 2020;80:e14–e18. - PMC - PubMed
    1. Wu C., Chen X., Cai Y., Xia J., Zhou X., Xu S., Huang H., Zhang L., Zhou X., Du C., Zhang Y., Song J., Wang S., Chao Y., Yang Z. Risk factors associated with acute respiratory distress syndrome and death in patients with coronavirus disease 2019 pneumonia in Wuhan, China. JAMA Intern. Med. 2020;180:934–943. - PMC - PubMed
    1. Situation Report-46. WHO; Geneva, Switzerland: 2020. World Health Organization.
    1. Ye Z., Zhang Y., Wang Y., Huang Z., Song B. Chest CT manifestations of new coronavirus disease 2019 (COVID-19): A pictorial review. Eur. Radiol. 2020;30:4381–4389. - PMC - PubMed

Publication types

MeSH terms

LinkOut - more resources