. 2022 Jan 13;59(1):2100285.
doi: 10.1183/13993003.00285-2021. Print 2022 Jan.

Rapid, simplified whole blood-based multiparameter assay to quantify and phenotype SARS-CoV-2-specific T-cells

Affiliations

Rapid, simplified whole blood-based multiparameter assay to quantify and phenotype SARS-CoV-2-specific T-cells

Catherine Riou et al. Eur Respir J. .

Abstract

Background: Rapid tests to evaluate severe acute respiratory syndrome coronavirus 2 (SARS-CoV-2)-specific T-cell responses are urgently needed to decipher protective immunity and aid monitoring vaccine-induced immunity.

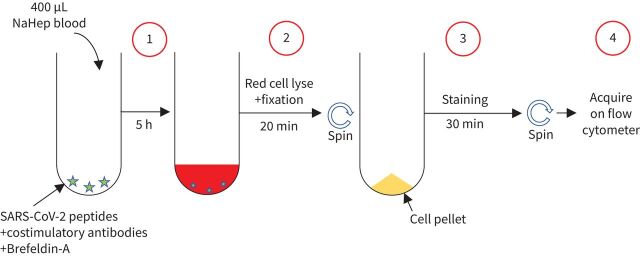
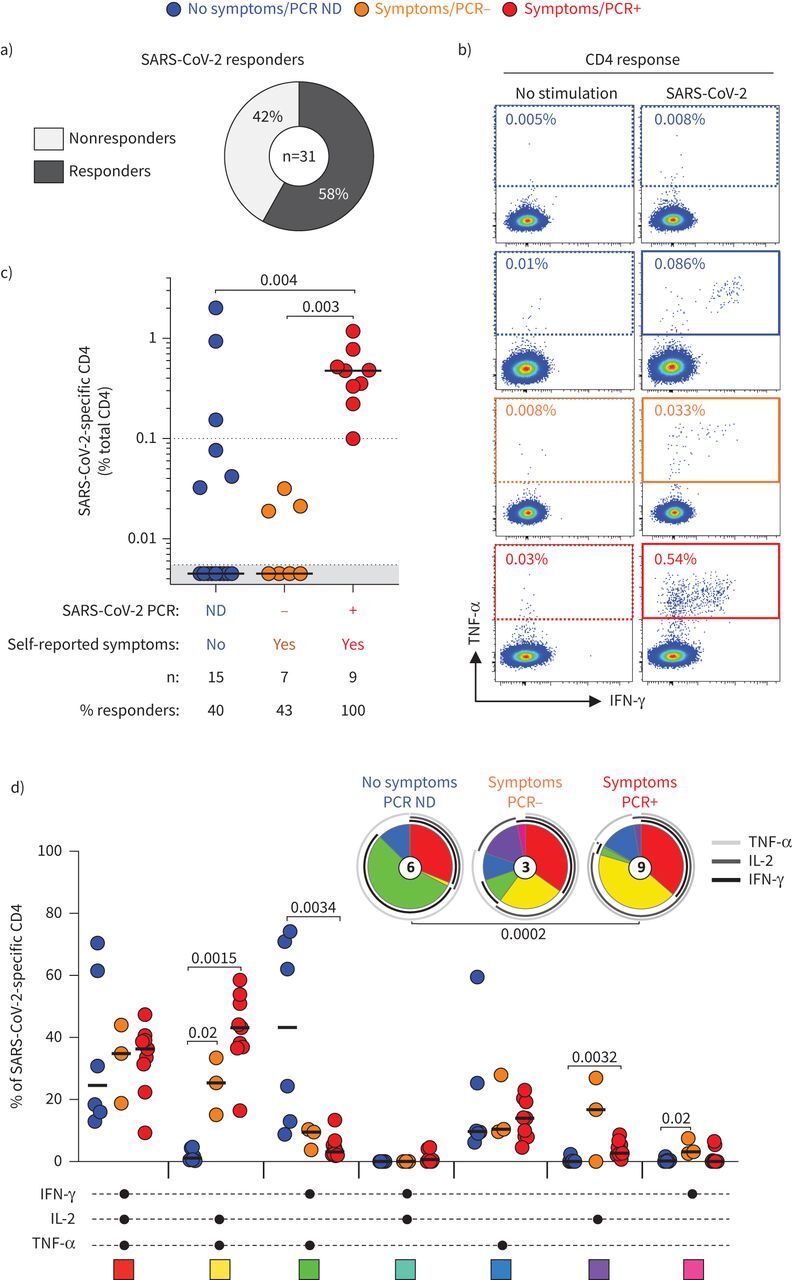
Methods: Using a rapid whole blood assay requiring a minimal amount of blood, we measured qualitatively and quantitatively SARS-CoV-2-specific CD4 T-cell responses in 31 healthcare workers using flow cytometry.

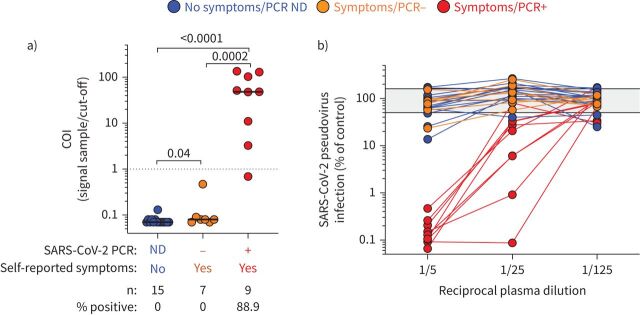
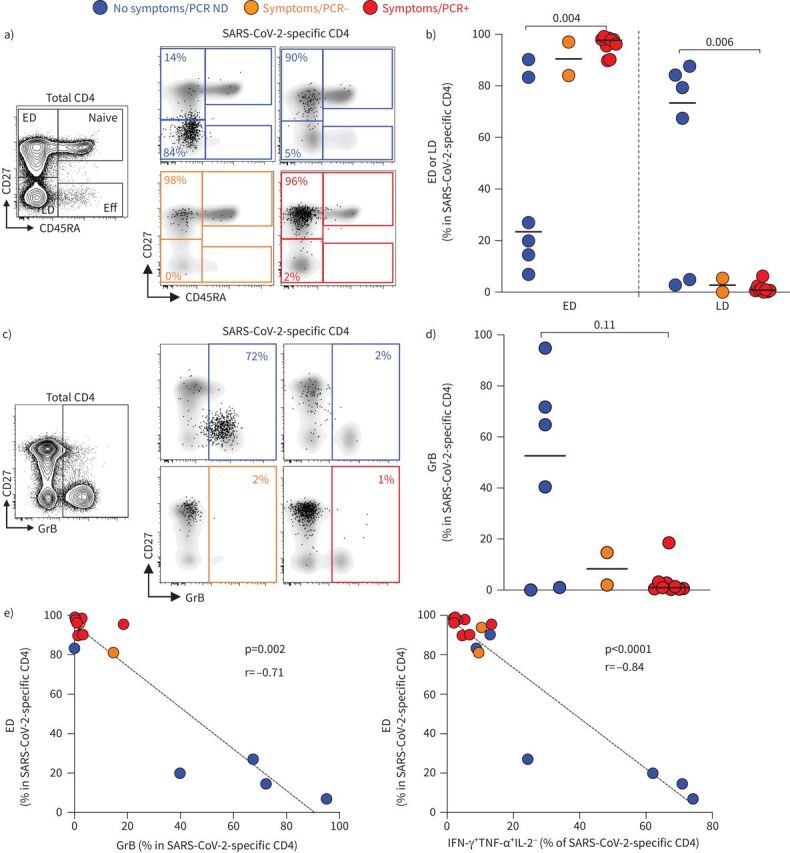
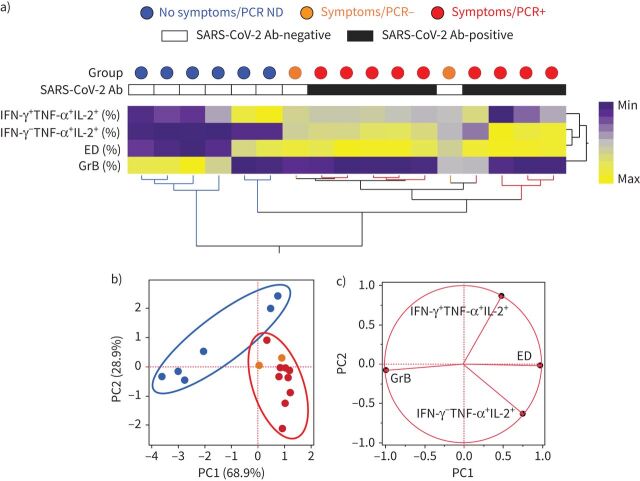
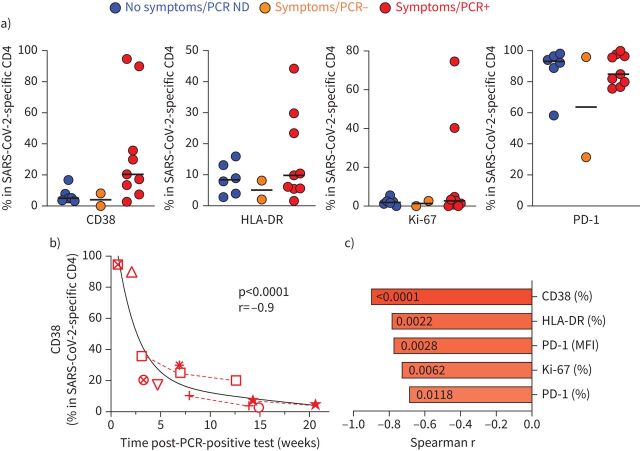
Results: 100% of COVID-19 convalescent participants displayed a detectable SARS-CoV-2-specific CD4 T-cell response. SARS-CoV-2-responding cells were also detected in 40.9% of participants with no COVID-19-associated symptoms or who tested PCR-negative. Phenotypic assessment indicated that, in COVID-19 convalescent participants, SARS-CoV-2 CD4 responses displayed an early differentiated memory phenotype with limited capacity to produce interferon (IFN)-γ. Conversely, in participants with no reported symptoms, SARS-CoV-2 CD4 responses were enriched in late differentiated cells, coexpressing IFN-γ and tumour necrosis factor-α and also Granzyme B.

Conclusions: This proof-of-concept study presents a scalable alternative to peripheral blood mononuclear cell-based assays to enumerate and phenotype SARS-CoV-2-responding T-cells, thus representing a practical tool to monitor adaptive immunity due to natural infection or vaccine trials.


Conflict of interest statement

Conflict of interest: C. Riou has nothing to disclose. Conflict of interest: G. Schäfer has nothing to disclose. Conflict of interest: E. du Bruyn has nothing to disclose. Conflict of interest: R.T. Goliath has nothing to disclose. Conflict of interest: C. Stek has nothing to disclose. Conflict of interest: H. Mou has nothing to disclose. Conflict of interest: D. Hung has nothing to disclose. Conflict of interest: K.A. Wilkinson has nothing to disclose. Conflict of interest: R.J. Wilkinson reports grants from Wellcome, Cancer Research UK, UK Research and Innovation, and the European and Developing Countries Clinical Trials Partnership, during the conduct of the study.

Figures

FIGURE 1
FIGURE 1
Schematic showing methodology and workflow of the whole blood assay for the detection of severe acute respiratory syndrome coronavirus 2 (SARS-CoV-2)-specific adaptive immune responses. Step 1: 400 µL heparinised (NaHep) whole blood is incubated for 5 h in the presence of a SARS-CoV-2-specific peptide pool in the presence of costimulatory antibodies (i.e. CD28 and CD49d) and Brefeldin-A. Step 2: cells are incubated for 20 min in the presence of a transcription factor fixation buffer, leading to the simultaneous lysis of red blood cells and cell fixation. Step 3: cells are stained for 30 min with an optimised panel of fluorophore-labelled antibodies. Step 4: samples are acquired on a flow cytometer. Control samples are processed with a similar workflow in the absence of the SARS-CoV-2-specific peptide pool.
FIGURE 2
FIGURE 2
Severe acute respiratory syndrome coronavirus 2 (SARS-CoV-2) serological assessment. a) Quantification of SARS-CoV-2 nucleocapsid-specific antibodies using the Elecsys assay expressed as a cut-off index (COI) (signal sample/cut-off). Participants were grouped according to their clinical characteristics. Medians (black bar) are shown. The dotted line indicates the manufacturer's cut-off value for positivity. Statistical comparisons were performed using the Mann–Whitney t-test; p-values are shown. b) SARS-CoV-2 pseudovirus neutralisation activity. SARS-CoV-2 pseudovirions pre-incubated with serially diluted patient plasma were used to infect angiotensin-converting enzyme 2-expressing HEK-293T cells. Luciferase activity as a measure for infection was assessed 3 days post-infection and results are expressed as infection compared with control (untreated virions, grey shaded area), which was set at 100%. ND: not done.
FIGURE 3
FIGURE 3
Magnitude and functional profile of severe acute respiratory syndrome coronavirus 2 (SARS-CoV-2)-specific CD4 T-cells. a) Proportion of participants exhibiting a detectable SARS-CoV-2-specific CD4 T-cell response. b) Representative examples of tumour necrosis factor (TNF)-α and interferon (IFN)-γ production in CD4 T-cells in response to the SARS-CoV-2 peptide pool. c) Magnitude of SARS-CoV-2-specific CD4 T-cell response (expressed as a percentage of total CD4 T-cells) in participants grouped according to their clinical characteristics. The number of participants and percentage of responders in each group is presented at the bottom of the graph. Statistical comparisons were performed using the Kruskal–Wallis test; p-values are shown. d) Polyfunctional profile of SARS-CoV-2-specific CD4 T-cells in each group. The x-axis displays the composition of each combination which is denoted with a black circle for the presence of IFN-γ, interleukin (IL)-2 and TNF-α. Medians (black bar) are shown. Each combination is colour-coded and data are summarised in the pie charts, where each pie slice represents the median contribution of each combination to the total SARS-CoV-2 response. The arcs identify the contribution of TNF-α, IL-2 and IFN-γ to the SARS-CoV-2 response. The Wilcoxon rank sum test was used to compare response patterns between groups and statistical differences between pie charts were defined using the permutation test; p-values are shown. ND: not done.
FIGURE 4
FIGURE 4
Memory differentiation profile and Granzyme B (GrB) expression in severe acute respiratory syndrome coronavirus 2 (SARS-CoV-2)-specific CD4 T-cells. a) Representative examples of the memory differentiation profile of SARS-CoV-2-specific CD4 T-cells based on the expression of CD45RA and CD27. The flow plot on the right shows the distribution of naive (CD45RA+CD27+), early differentiated (ED: CD45RACD27+), late differentiated (LD: CD45RACD27) and effector (Eff: CD45RA+CD27) cells in total CD4 T-cells. b) Summary graph of the proportion of ED and LD in SARS-CoV-2-specific CD4 T-cells in each group. Statistical comparisons were performed using the Kruskal–Wallis test; p-values are shown. c) Representative examples of GrB expression in total and SARS-CoV-2-specific CD4 T-cells. d) Summary graph of GrB expression in SARS-CoV-2-specific CD4 T-cells in each group. Statistical comparisons were performed using the Kruskal–Wallis test; p-value is shown. e) Relationship between the proportion of ED within SARS-CoV-2-specific CD4 T-cells and GrB expression or the proportion of IFN-γ+TNF-α+IL-2 SARS-CoV-2-specific CD4 T-cells. Correlations were tested by the two-tailed nonparametric Spearman rank test. ND: not done; IFN: interferon; TNF: tumour necrosis factor; IL: interleukin.
FIGURE 5
FIGURE 5
Phenotypic signature of severe acute respiratory syndrome coronavirus 2 (SARS-CoV-2)-specific IFN-γ+ CD4+ T-cells according to clinical characteristics. a) Nonsupervised two-way hierarchical cluster analysis (Ward method) using four phenotypic parameters (i.e. proportions of IFN-γ+TNF-α+IL-2+ and IFN-γTNF-α+IL-2+ cells, proportion of ED, and GrB expression) from SARS-CoV-2-specific CD4 T-cells. Each column represents a participant and is colour-coded according to their clinical characteristics indicated by a circle at the top of the dendrogram. Participants with a positive or negative SARS-CoV-2 serology test are indicated. Data are depicted as a heatmap coloured from minimum to maximum values for each parameter. b) Principal component analysis on correlations, derived from the three studied parameters. Each data point represents a participant. The two axes represent principal components 1 (PC1) and 2 (PC2). Their contribution to the total data variance is shown as a percentage. c) Loading plot showing how each parameter influences PC1 and PC2 values. ND: not done; Ab: antibody; IFN: interferon; TNF: tumour necrosis factor; IL: interleukin.
FIGURE 6
FIGURE 6
Activation profile of severe acute respiratory syndrome coronavirus 2 (SARS-CoV-2)-specific CD4 T-cells. a) CD38, HLA-DR, Ki-67 and PD-1 expression in SARS-CoV-2-specific CD4 T-cells in each group. Medians (black bar) are shown. No significant differences were observed between groups for any markers using the Kruskal–Wallis test. b) Association between CD38 expression in SARS-CoV-2-specific CD4 T-cells and the time post-SARS-CoV-2 PCR-positive test. Each symbol represents a participant (n=9). Dashed red lines identify participants with longitudinal samples. Correlations were tested by the two-tailed nonparametric Spearman rank test. c) Comparison of the correlation between the time post-SARS-CoV-2 PCR-positive test and the expression of different activation profile markers, ranked according to the strength of the association. Spearman correlation r-values are plotted on the x-axis and corresponding p-values are shown within each bar. ND: not done; MFI: mean fluorescence intensity.

Update of

References

    1. Margolin E, Burgers WA, Sturrock ED, et al. . Prospects for SARS-CoV-2 diagnostics, therapeutics and vaccines in Africa. Nat Rev Microbiol 2020; 18: 690–704. doi:10.1038/s41579-020-00441-3 - DOI - PMC - PubMed
    1. Cox RJ, Brokstad KA. Not just antibodies: B cells and T cells mediate immunity to COVID-19. Nat Rev Immunol 2020; 20: 581–582. doi:10.1038/s41577-020-00436-4 - DOI - PMC - PubMed
    1. Altmann DM, Boyton RJ. SARS-CoV-2 T cell immunity: specificity, function, durability, and role in protection. Sci Immunol 2020; 5: eabd6160. doi:10.1126/sciimmunol.abd6160 - DOI - PubMed
    1. Quinti I, Lougaris V, Milito C, et al. . A possible role for B cells in COVID-19? Lesson from patients with agammaglobulinemia. J Allergy Clin Immunol 2020; 146: 211–213. doi:10.1016/j.jaci.2020.04.013 - DOI - PMC - PubMed
    1. Canete PF, Vinuesa CG. COVID-19 makes B cells forget, but T cells remember. Cell 2020; 183: 13–15. doi:10.1016/j.cell.2020.09.013 - DOI - PMC - PubMed

Publication types