. 2021 Jun 18;372(6548):eabf3736.
doi: 10.1126/science.abf3736.

Common genetic variation influencing human white matter microstructure

Affiliations

Common genetic variation influencing human white matter microstructure

Bingxin Zhao et al. Science. .

Abstract

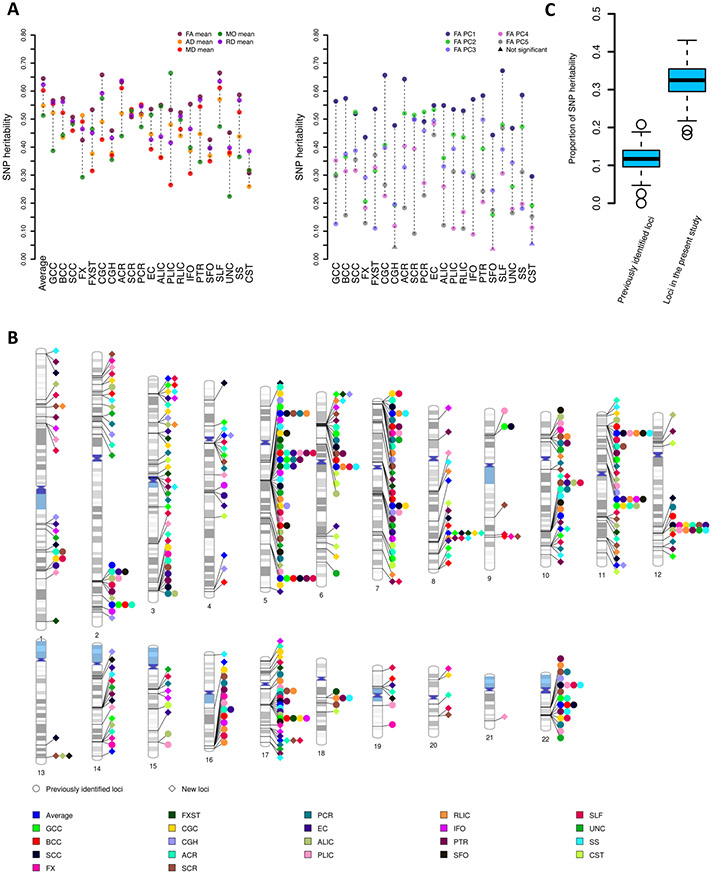
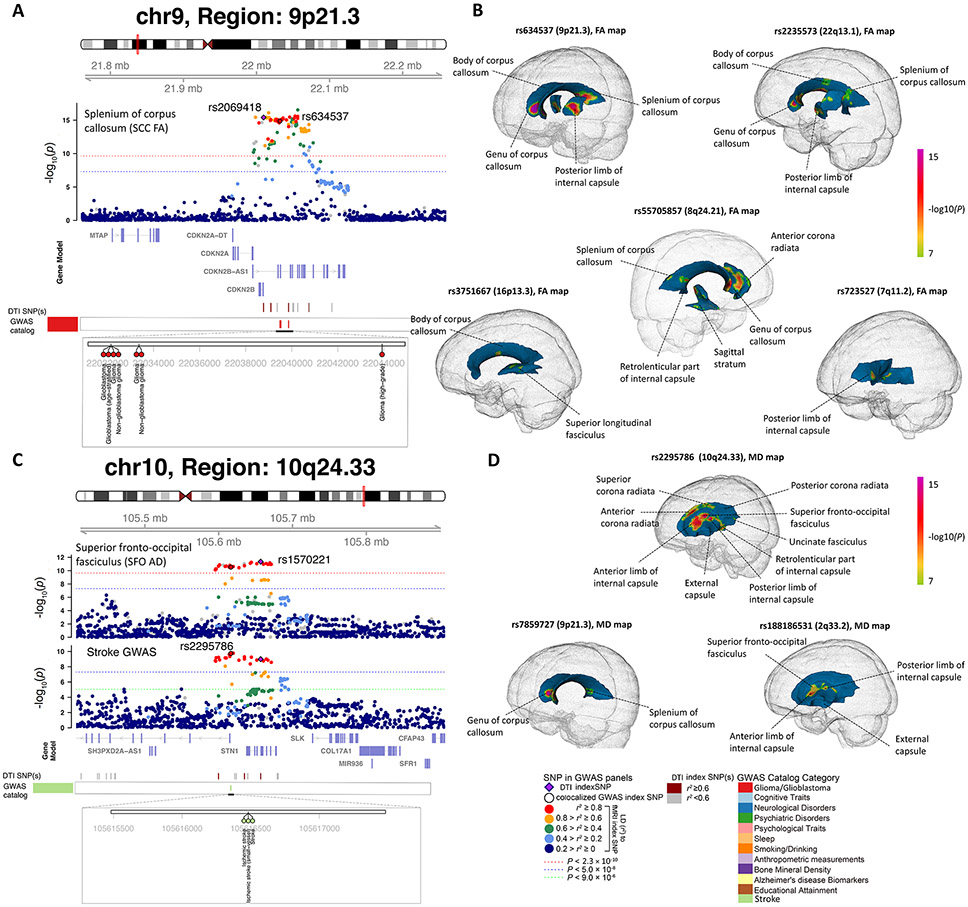
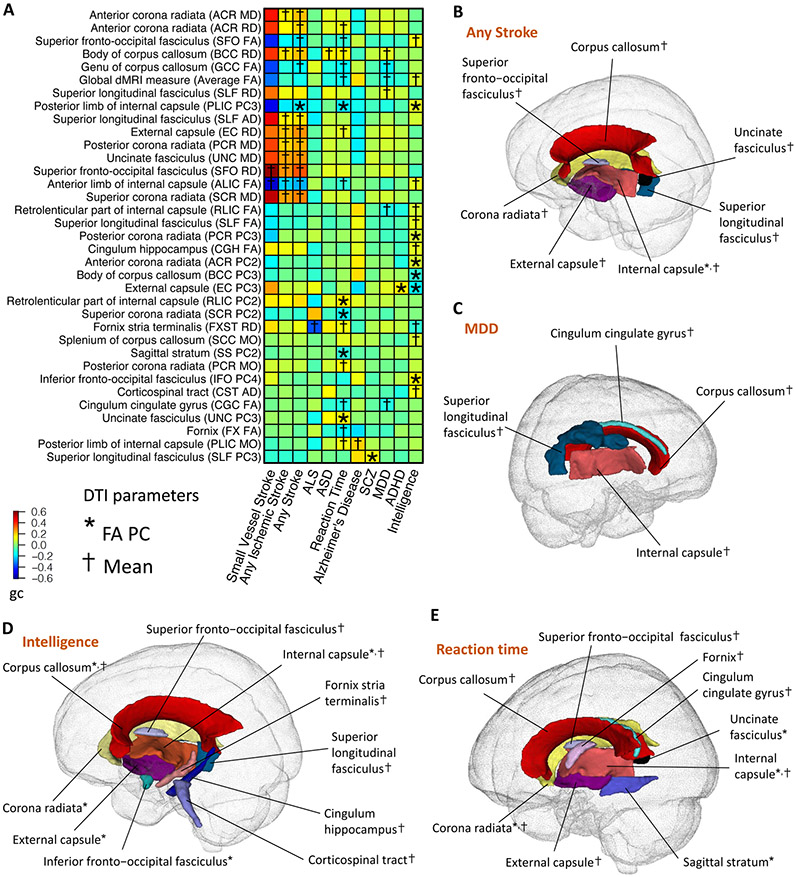
Brain regions communicate with each other through tracts of myelinated axons, commonly referred to as white matter. We identified common genetic variants influencing white matter microstructure using diffusion magnetic resonance imaging of 43,802 individuals. Genome-wide association analysis identified 109 associated loci, 30 of which were detected by tract-specific functional principal components analysis. A number of loci colocalized with brain diseases, such as glioma and stroke. Genetic correlations were observed between white matter microstructure and 57 complex traits and diseases. Common variants associated with white matter microstructure altered the function of regulatory elements in glial cells, particularly oligodendrocytes. This large-scale tract-specific study advances the understanding of the genetic architecture of white matter and its genetic links to a wide spectrum of clinical outcomes.


Figures

Fig. 1
Fig. 1. Illustration of white matter traits and DTI parameters.
(A) Schematic representation of the five diffusion tensor images (DTI)-derived metrics. Axial diffusivity (AD) is the diffusion along the long axis (λ1), radial diffusivity (RD) is the diffusion of two small axes (average of λ2 and λ3), and mean diffusivity (MD) is the average diffusion regardless of direction (mean of λ1 , λ2 , and λ3). Fractional anisotropy (FA) and mode of anisotropy (MO) are two more complicated measures of general directionality. (B) Annotation of the 21 white matter tracts in human brain. (C) Comparison between tract mean FA and tract-specific FA principal components (PCs) on the corpus callosum tract (CC, including GCC, BCC, and SCC). (I) illustrates an example skeletonized FA map within the corpus callosum tract after inter-subject centralization; (II) displays the residual FA map after removing the within-subject tract mean FA; In (III) and (IV), instead of removing the within-subject mean as in (II), we removed the top one and five FA PCs, respectively. (V) illustrates the standard deviation across the voxels in residual FA map for each subject in the UKB (n = 36,624). The standard deviations are similar between the residual FA maps after removing tract mean FA (in (II)) and the first FA PC (in (III)), suggesting that this PC mainly accounts for the mean FA. Comparing (II) with (IV), other four FA PCs can capture more spatial variations that are ignored by the tract mean FA, and thus reduce the standard deviations of residuals in (V). (D) Correlation between the DTI parameters among GCC, BCC, and SCC tracts. Ten parameters are generated in each tract, including the mean FA, mean MD, mean AD, mean RD, mean MO, as well as the top five FA PCs. The five FA PCs are orthogonal to each other and the first FA PC can be highly correlated with mean FA.
Fig. 2
Fig. 2. SNP heritability and the associated genomic regions of DTI parameters.
(A) SNP heritability of 215 DTI parameters, including 110 mean parameters (left panel, mean values of axial diffusivity (AD), radial diffusivity (RD), mean diffusivity (MD), fractional anisotropy (FA), and mode of anisotropy (MO) in 21 tracts and the whole brain, 5 × 22) and 105 FA principal components (PCs) (right panel, top 5 FA PCs of 21 tracts, 5 × 21). Average, global average across 21 tracts; Full names of the 21 white matter tracts can be found in Fig. 1(B). (B) Ideogram of genomic regions influencing DTI parameters (P < 2.3 × 10⁻¹⁰), including 42 previously identified regions and 109 additional regions identified in the present study. The colors represent the 21 white matter tracts (and the global average). Each signal point indicates that at least one of the 10 DTI parameters (5 mean parameters and 5 FA PCs) of this tract is associated with the genomic region. (C) Proportion of SNP heritability of the 215 DTI parameters that can be explained by the 44 genomic regions identified in previous study (11.7%) and 151 regions identified in the current study (32.3%).
Fig. 3
Fig. 3. Selected genetic loci that were associated with both DTI parameters and brain diseases.
(A) In 9p21.3, we observed colocalization (LD r2≥ 0.6) between the mean fractional anisotropy (FA) of splenium of corpus callosum (SCC FA, index variant rs2069418) and glioma (both glioblastoma and non-glioblastoma tumors, index variant rs634537). (B) We illustrated the voxel-wise genetic effects of 5 colocalized glioma GWAS index variants (rs634537, rs2235573, rs55705857, rs3751667, and rs723527) on FA. The genetic effects were obtained by performing voxel-wise target-variant analysis for the 5 colocalized glioma significant variants. We displayed the voxels passing the Bonferroni significant level (P < 8.5 × 10⁻⁸) in the voxel-wise target-variant analysis. White matter tracts that had significant voxels were labelled in each map. (C) In 10q24.33, we observed colocalization between the mean axial diffusivity (AD) of superior fronto-occipital fasciculus (SFO AD, index variant rs1570221) and stroke (index variant rs2295786). (D) We illustrated the voxel-wise genetic effects of 3 colocalized stroke GWAS index variants (rs2295786, rs7859727, and rs18818651) on mean diffusivity (MD).
Fig. 4
Fig. 4. Selected pairwise genetic correlations between DTI parameters of white matter tracts and brain disorders and cognitive functions.
(A) The asterisks (for FA PCs) and daggers (for mean parameters) highlight significant genetic correlations after controlling the FDR at 5% level. The y-axis lists the DTI parameters of white matter tracts and the x-axis provides the names of brain-related traits/disorders. The colors represent genetic correlations (gc). FA, fractional anisotropy; AD, axial diffusivity; MD, mean diffusivity; MO, mode of anisotropy; RD, radial diffusivity; PC, principal component of FA; ALS, amyotrophic lateral sclerosis; ASD, autism spectrum disorder; MDD, major depressive disorder; SCZ, schizophrenia; ADHD, attention-deficit/hyperactivity disorder. (B-E) Location of the white matter tracts whose DTI parameters were genetically correlated with (B) stroke (any subtype); (C) MDD; (D) intelligence; and (E) reaction time. The colors describe different white matter tracts.
Fig. 5
Fig. 5. Selected pairwise genetic correlations between fractional anisotropy (FA) of white matter tracts and regional brain volumes.
(A) The asterisks (for FA PCs) and daggers (for mean parameters) highlight significant genetic correlations after Bonferroni adjustment for multiple testing. The y-axis lists the DTI parameters of white matter tracts and the x-axis provides the name of regional brain volumes. The colors represent genetic correlations (gc). PC, principal component of FA. (B) Location of the lateral ventricle region and its neighboring white matter tracts whose FA parameters were genetically correlated with the volume of lateral ventricle. The colors describe different brain regions (names highlighted in brown color) and white matter tracts. (C) Location of the cortex regions and their neighboring white matter tracts whose FA parameters were genetically correlated with the volume of these regions. (D) Location of the putamen and pallidum regions and their neighboring white matter tracts whose FA parameters were genetically correlated with the volume of these regions.
Fig. 6
Fig. 6. Partitioned heritability enrichment analysis in brain cell types.
(A) Heritability enrichment of global mean fractional anisotropy (FA) and mean diffusivity (MD) in regulatory elements of two brain cell types (neuron and glia) sampled from 14 brain cortical and subcortical regions. DLFPC, dorsolateral prefrontal cortex; VLPFC, ventrolateral prefrontal cortex; OFC, orbitofrontal cortex; ACC, anterior cingulate cortex; INS, insular cortex; ITC, inferior temporal cortex; STC, superior temporal cortex; PMC, primary motor cortex; PVC, primary visual cortex; AMY, amygdala; HIPP, hippocampus; MDT, mediodorsal thalamus; NAC, nucleus accumbens; PUT, putamen. (B) Heritability enrichment of global mean FA and MD in regulatory elements of glial cell subtypes (glia, including oligodendrocyte and microglia/ astrocyte) and neuronal cell subtypes (neurons, including GABAergic and glutamatergic neurons). (C) Heritability enrichment of mean FA of 21 white tracts in regulatory elements of two brain cell types (neuron and glia) sampled from 14 brain cortical and subcortical regions. Full names of the 21 white matter tracts can be found in Fig. 1 (B). The dashed lines indicate the significance level after controlling the FDR at 5% level.

Comment in

  • White matter and human behavior.
    Filley CM. Filley CM. Science. 2021 Jun 18;372(6548):1265-1266. doi: 10.1126/science.abj1881. Science. 2021. PMID: 34140371 No abstract available.

References

    1. van den Heuvel MP, Sporns O, A cross-disorder connectome landscape of brain dysconnectivity. Nature reviews neuroscience 20, 435–446 (2019). - PMC - PubMed
    1. Hagmann P et al., Mapping the structural core of human cerebral cortex. PLoS biology 6, (2008). - PMC - PubMed
    1. Zielinski BA, Gennatas ED, Zhou J, Seeley WW, Network-level structural covariance in the developing brain. Proceedings of the National Academy of Sciences 107, 18191–18196 (2010). - PMC - PubMed
    1. Filley CM, Fields RD, White matter and cognition: making the connection. Journal of neurophysiology 116, 2093–2104 (2016). - PMC - PubMed
    1. Koziol LF, Budding DE, Chidekel D, Adaptation, expertise, and giftedness: towards an understanding of cortical, subcortical, and cerebellar network contributions. The Cerebellum 9, 499–529 (2010). - PubMed

Publication types

MeSH terms