. 2021 Jun 18;372(6548):eabe7729.
doi: 10.1126/science.abe7729.

Neutrophils self-limit swarming to contain bacterial growth in vivo

Affiliations

Neutrophils self-limit swarming to contain bacterial growth in vivo

Korbinian Kienle et al. Science. .

Abstract

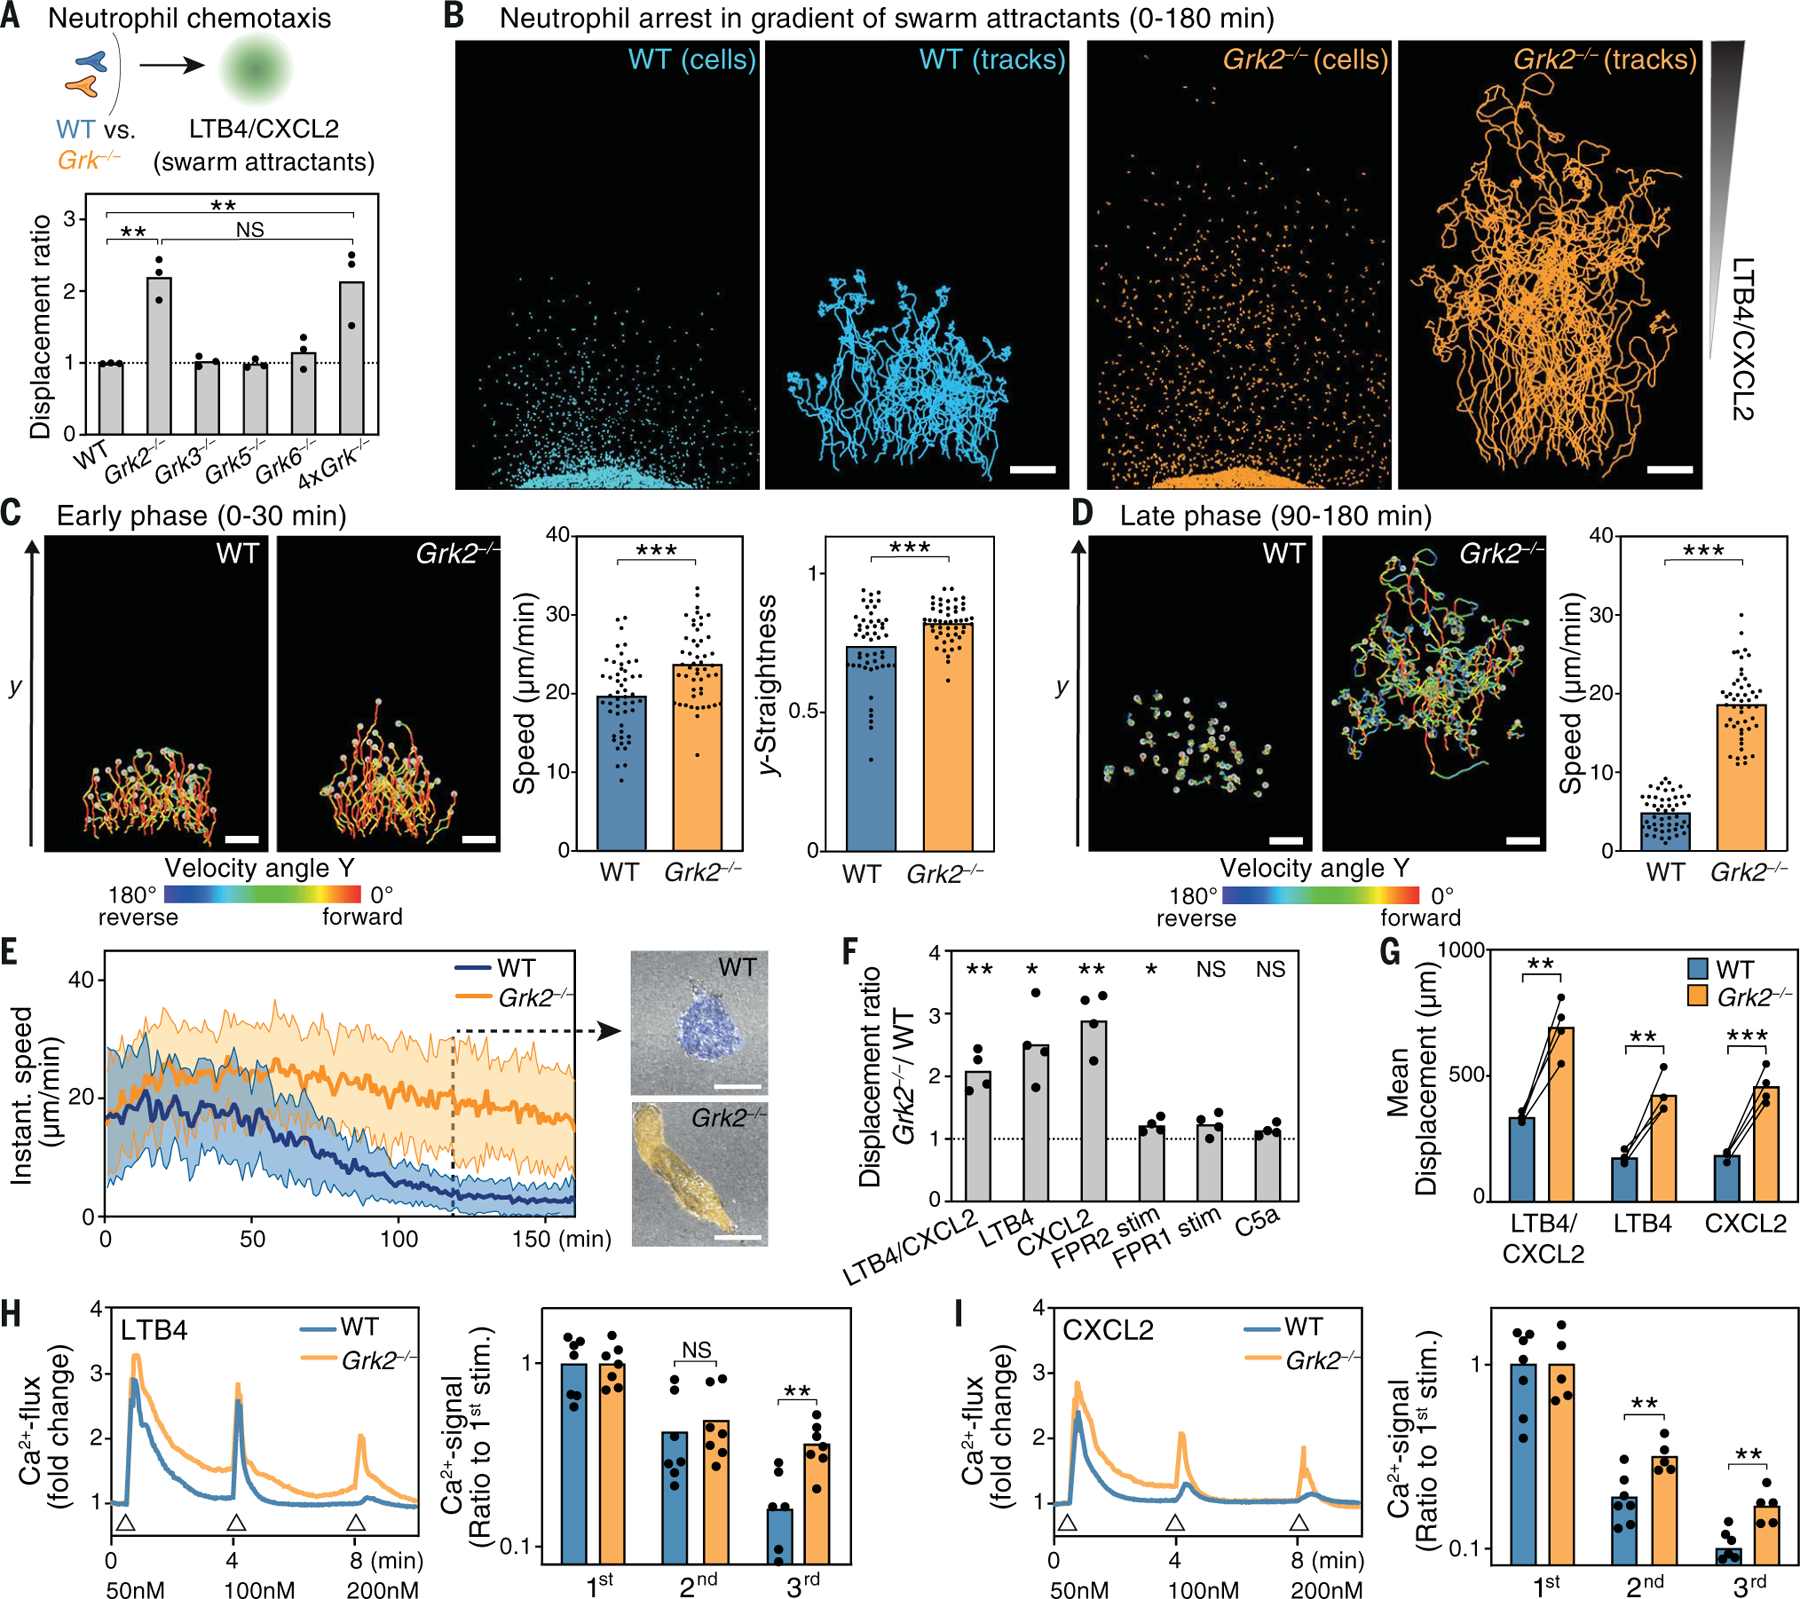
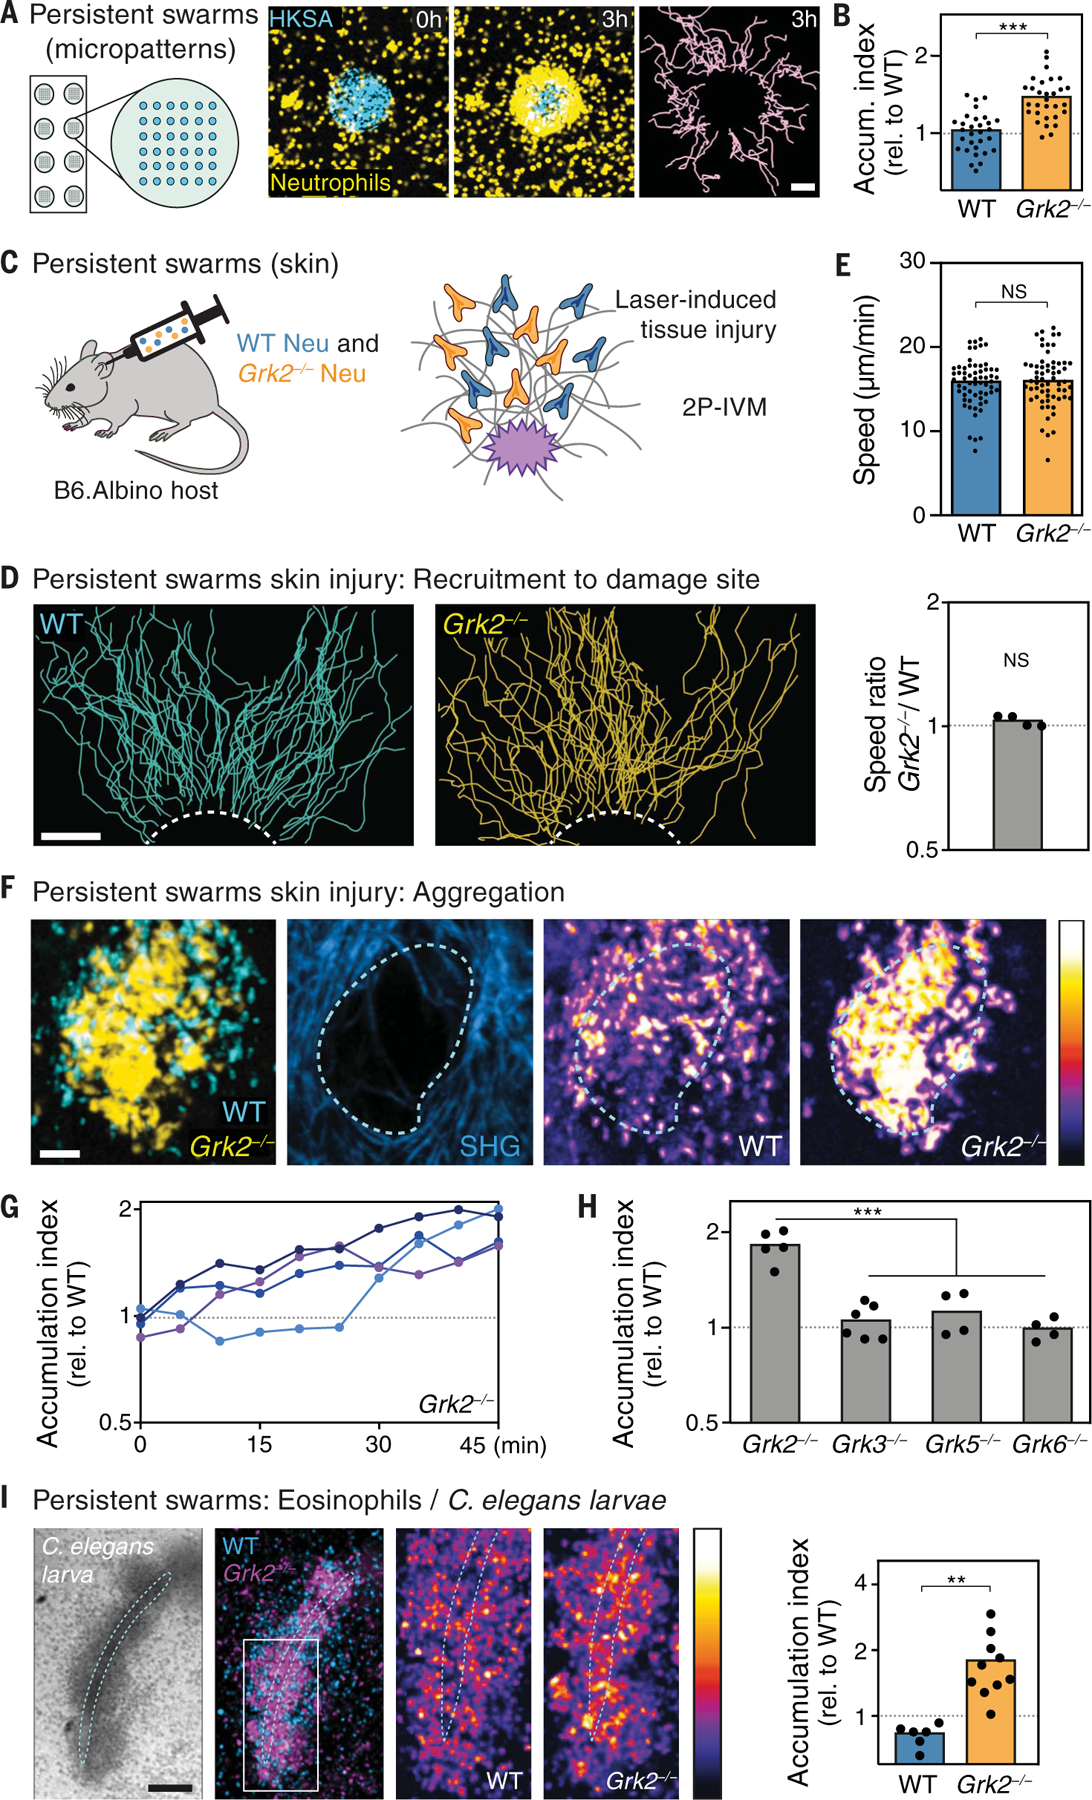
Neutrophils communicate with each other to form swarms in infected organs. Coordination of this population response is critical for the elimination of bacteria and fungi. Using transgenic mice, we found that neutrophils have evolved an intrinsic mechanism to self-limit swarming and avoid uncontrolled aggregation during inflammation. G protein-coupled receptor (GPCR) desensitization acts as a negative feedback control to stop migration of neutrophils when they sense high concentrations of self-secreted attractants that initially amplify swarming. Interference with this process allows neutrophils to scan larger tissue areas for microbes. Unexpectedly, this does not benefit bacterial clearance as containment of proliferating bacteria by neutrophil clusters becomes impeded. Our data reveal how autosignaling stops self-organized swarming behavior and how the finely tuned balance of neutrophil chemotaxis and arrest counteracts bacterial escape.


Conflict of interest statement

Competing interests: The authors declare no competing interests.

Figures

Fig. 1.
Fig. 1.. GRK2-dependent neutrophil arrest in fields of highly concentrated swarm attractants.
(A) Comparative analysis of wild-type (WT) and Grk−/− neutrophils migrating side by side in an under-agarose assay setup along a combined gradient of the swarm attractants CXCL2/LTB4. Grk-deficient cells were lacking either an individual GRK or all four expressed GRKs (4×Grk−/−). After 4 hours, migration endpoints were measured and are displayed as the ratio of Grk−/− to WT mean displacement. Bars display means of n = 3 biological replicates performed as independent experiments for each comparison. **P < 0.01 (post hoc after ANOVA); NS, nonsignificant. (B to E) Migration of WT and Grk2−/− neutrophils toward CXCL2/LTB4 was recorded with live-cell microscopy to obtain cell tracks for 3 hours. From one representative experiment, 50 cells per genotype were tracked; cell displacement and full cell tracks after 3 hours are displayed in (B). The same cells were analyzed for migration and chemotaxis parameters during the early phase (0 to 30 min) (C) and the late phase (90 to 180 min) (D) of movement along the attractant gradient. The velocity angle Y is the angle between the velocity vector and the y axis (the axis of the attractant gradient); the y-straightness is the ratio of the displacement along the y axis (Δy) to the total track length. In speed plot of (C), bars display means; ***P < 0.001 (t test). In y-straightness plot of (C) and speed plot of (D), bars display median values; ***P < 0.001 (U test). (E) Instantaneous velocities with representative cell shapes at t = 120 min (N = 50 cells per genotype, means ± SD). (F) Comparative analysis of WT and Grk2−/− neutrophils migrating for 4 hours toward various attractive GPCR ligands, displayed as displacement ratio of Grk2−/− cells to WT cells. Bars display means of n = 4 biological replicates performed as independent experiments for each comparison. *P < 0.05, **P < 0.01 (one-sample t test against 1). (G) Comparative analysis of WT and Grk2−/− neutrophil mean displacement in gradients of LTB4 and CXCL2, combined and separately. Bars display means of n = 4 biological replicates performed as independent experiments for each side-by-side comparison. **P < 0.01, ***P < 0.001 (ratio paired t test). (H and I) Intracellular calcium flux analysis as a measure of GPCR desensitization. WT and Grk2−/− neutrophils were stimulated sequentially with increasing concentrations (as indicated) of either LTB4 (H) or CXCL2 (I) (triangles). Left panels: Real-time calcium flux of one experiment representative of n = 5 to 7 biological replicates for each genotype. Right panels: Quantification of the decrease in calcium signal after repeated attractant stimulation. Area under the curve (AUC) of the calcium signal was measured for individual stimulation peaks. Desensitization was measured as the ratio of the second and third stimulation values to the first stimulation in each independent experiment. The distribution of AUC values around the normalized average of the first stimulation is also displayed. Bars display means of n = 5 to 7 biological replicates for each genotype. **P < 0.01 (t test). Scale bars, 500 μm [(B) to (D)], 10 µm (E).
Fig. 2.
Fig. 2.. GRK2-dependent arrest in persistent swarms.
(A) In vitro microscale array of patterned heat-killed S. aureus (HKSA) bioparticles (blue) to study persistent neutrophil swarms. Live microscopy of WT neutrophils (yellow) and cell tracking (pink) exemplifies swarming dynamics over 3 hours. (B) Analysis of neutrophil aggregation in clusters of two mixed populations, quantified as the WT/WT and Grk2−/−/WT ratios of cells accumulating on HKSA spots (accumulation index) after 2 hours. Each dot represents one analyzed neutrophil cluster (N = 30) pooled from n = 3 biological replicates. Bars display means; ***P < 0.001 (t test). (C to G) 2P-IVM on ear dermis of anesthetized mice: Comparative analysis of persistent swarming after i.d. co-injection of WT and Grk2−/− neutrophils, which were differentially labeled with fluorescent dyes, into Tyrc-2J/c-2J (B6.Albino) mice. (C) Interstitial cell recruitment toward a laser-induced focal tissue injury. [(D) and (E)] For one representative experiment, the full cell tracks toward the damage site (dashed line) over the first 40 min after the initiation of the tissue damage are displayed (D) and the cell speed analyzed [(E), top]. Each dot represents one tracked neutrophil (N = 62) from the side-by-side comparison of WT and Grk2−/− cells in one experiment. Bars display median values (U test). [(E), bottom] Comparative analysis of WT and Grk2−/− neutrophil speed during side-by-side chemotactic migration, displayed as the ratio of Grk2−/− to WT; n = 4 biological replicates (one-sample t test against 1). (F) Neutrophil aggregation was analyzed by 2P-IVM images at the endpoint of the clustering response when neutrophil recruitment ceases. In the representative example (see Movie 2, first part), neutrophil clustering is displayed 65 min after the initiation of tissue damage. (G) Aggregation in competitive clusters of Grk2−/− and WT cells was also quantified over time. Accumulation index was used as a quantitative parameter for neutrophil entry into the collagen-free wound center [cyan dashed line in (F)], displayed as the ratio of Grk2−/− to WT. Quantification began (t = 0) when small aggregates have already formed, which commonly occurs 5 to 20 min after the initial tissue injury depending on the individual experiment. Time courses of neutrophil clusters from n = 4 biological replicates (lines) are shown. (H) Quantification of endpoint neutrophil clustering after i.d. co-injection of WT cells and neutrophils lacking individual GRK family members into mice. The accumulation index (ratio of Grk−/− to WT) as a measure of aggregation was calculated when neutrophil recruitment had ceased and clusters stabilized. Each dot represents one analyzed neutrophil cluster (N = 4 to 6) pooled from n = 2 or 3 biological replicates. ***P < 0.001 (post hoc after ANOVA). (I) Comparative analysis of WT and Grk2−/− eosinophils forming persistent swarms around C. elegans dauer larvae (dotted line) in vitro. Confocal images illustrate endpoint eosinophil clusters after 2 hours. Each dot represents one analyzed eosinophil cluster (N = 6 to 10) pooled from n = 3 biological replicates. **P < 0.01 (t test). Scale bars, 100 μm [(A) and (I)], 50 μm (D), 30 μm (F). Bars with LUT color grading [(F) and (I)] display fluorescence signal intensities. SHG, second harmonic generation signal.
Fig. 3.
Fig. 3.. GRK2-controlled transient swarming restricts bacterial growth.
(A) Left: Comparative analysis of sequential navigation behavior of WT and Grk2−/− neutrophils by exposing them to a first gradient of LTB4/CXCL2 and adding a second gradient of LTB4/CXCL2 at a 90° angle 3 hours later (right). Right: Cell positions after initial chemotaxis (3 hours) and reorientation (6 hours) were obtained by live-cell microscopy. (B) Mice were infected with bacteria in the footpad, and 2P-IVM of transient neutrophil swarms was then performed on draining popliteal lymph nodes. (C to E) Mice with mixed bone marrow [cyan, WT (Ly6gCre/+ Rosa26LSL:Tom); yellow, Grk2−/− (Mrp8-Cre Grk2fl/fl Lyz2Gfp/+)] were infected with P. aeruginosa (PA)–GFP before endogenous neutrophils were recorded 3 to 5 hours later. (C) Representative time-lapse sequence of neutrophil clusters (magenta arrows) in SCS. Bottom panels show migration tracks of neutrophils redirected to a second cluster (dotted box) with dragontails from t = 0 to 30 min. (D) 2P-IVM images show a representative neutrophil cluster of a transient swarm in the infected lymph node SCS. Quantification of neutrophil accumulation in transient clusters is displayed as the ratio of Grk2−/− to WT (see also materials and methods). Each dot represents one cluster (N = 16) pooled from n = 4 infected lymph nodes. ***P < 0.001 (one-sample t test against 1). (E) Trajectories of individual neutrophils are shown as tracks color-coded for mean track speed of cells (top), which navigate in the interstitial space of lymph nodes between neutrophil clusters (bottom). The color code ranges from 2 to 12 μm/min. Cell track lengths were quantified over 60 min; each dot represents one tracked neutrophil [N = 59 (WT), N = 48 (Grk2−/−)] from one experiment. (F) Bacterial CFU counts of draining lymph nodes 8 hours after Grk2∆PMN and littermate control (WT) mice were infected with P. aeruginosa. Each dot represents one lymph node (N = 16) pooled from n = 8 mice for each genotype. In (E) and (F), bars display median values. ***P < 0.001 (U test). Scale bars, 1 mm (A), 50 µm [(C), top, and (E)], 20 µm [(C), bottom, and (D)]. SHG, second harmonic generation signal.
Fig. 4.
Fig. 4.. Neutrophil arrest is critical for containing bacteria in swarm clusters.
(A) Coculture of neutrophils (blue), macrophages (gray), and P. aeruginosa PAO-1 expressing GFP (PA-GFP) (green) to mimic SCS lymph node infection in vitro. Red nuclei indicate dying macrophages. (B) WT or Grk2−/− neutrophils (Neu, blue) were separately cocultured with macrophages and PA-GFP (green). Fluorescent macrophages are not displayed. (C) After 8 hours of live-cell confocal microscopy, individual neutrophil cluster areas and PA-GFP signal areas were analyzed. For neutrophil cluster size (left), bars display median values; N = 50 to 55 clusters pooled from n = 3 biological replicates. ***P < 0.001 (U test). For PA-GFP signal (right), total bacteria are the sum of neutrophil-contained bacteria (white) and bacteria outside of cell clusters (green, free). Bars display the mean; n = 5 biological replicates performed as independent experiments. *P < 0.05 (ratio paired t test). (D) Neutrophils of one genotype were triple dye–labeled to track neutrophils in cell clusters. Time sequences of representative WT (left) and Grk2−/− (right) neutrophil cluster dynamics are shown. Trajectories of individual cells are shown as dragontails over 60 min and color-coded for instantaneous speed (ranging from 0 to 3.6 µm/min). (E) Arrest coefficient (percentage of instantaneous speed values less than 2 µm/min) was used as a quantitative parameter for neutrophil stopping at clusters. Bars display means; each dot represents one neutrophil cluster (with >7 cells tracked in each cluster) for each genotype from n = 4 biological replicates. **P < 0.01 (t test). (F) Total 4-hour trajectories of individual cells are shown as tracks color-coded for mean track speed (ranging from 0 to 3.6 µm/min) in the neutrophil clusters of (D). (G) Left: Example of PA-GFP phagocytosis in WT neutrophil clusters. Right: PA-GFP was tagged with pHrodo dye to quantify the red signal of internalized bacteria in WT or Grk2−/− neutrophil clusters. Dots show analyzed neutrophil clusters (N = 74) pooled from n = 3 or 4 biological replicates. Bars display median values; ***P < 0.001 (U test). (H) Confocal images of representative WT and Grk2−/− clusters to quantify degrees of containment (red line; continuous = 100%) of PA-GFP (green) at 8 hours. Yellow arrowhead shows site of discontinuous containment. Dots show analyzed neutrophil clusters (N = 30) pooled from n = 3 biological replicates. Bars display median values; ***P < 0.001 (U test). Scale bars, 50 µm (B), 10 µm [(D), (F), (G), and (H)].
Movie 1.
Movie 1.. Grk2−/− neutrophils continue to migrate in areas of highly concentrated swarm attractants.
First part: Wild-type (WT) and Grk2−/− neutrophils were differentially dye-labeled and filled in a 1:1 ratio into one well (left) of an under-agarose chemotaxis assay setup. The swarm-mediating chemoattractants LTB4 (1 µM) and CXCL2 (1 μM) were filled into an opposite well to establish a gradient of increasing attractant concentrations (highest concentration at right). The representative video shows control (pseudo-colored in blue; upper panel) and Grk2−/− (pseudo-colored in orange; lower panel) neutrophils migrating toward the gradient (left to right). Graphic analysis of this experiment (Fig. 1, B to E, and fig. S1F) reveals that Grk2−/− neutrophils do not arrest, but continue to migrate at high concentrations of swarm attractants. Spinning-disk confocal microscopy (x, y = 1070 µm, 870 µm; stitched from multi-tiled images), 10 frames/s. Time is displayed as hours:min. Second part: WT, Grk2−/−, and 4×Grk−/− neutrophils were differentially dye-labeled and filled in a 1:1:1 ratio into one well (left) of an under-agarose chemotaxis assay setup with combined LTB4/CXCL2 gradient as in the experiment before. The representative video shows control (top), Grk2−/− (middle), and 4×Grk−/− (bottom) neutrophils migrating toward the gradient (left to right). Graphic analysis of this experiment (fig. S2F) reveals comparable migration of 4×Grk−/− and Grk2−/− neutrophils in swarm-attractant gradients. Spinning-disk confocal microscopy (x, y = 1119 µm, 959 µm; stitched from multi-tiled images), 12 frames/s. Time is displayed as hours:min.
Movie 2.
Movie 2.. GRK2-dependent neutrophil arrest in cell clusters of persistent swarms.
First part (large neutrophil swarms): WT and Grk2−/− neutrophils were differentially dye-labeled and injected i.d. in a 1:1 ratio into the ventral ear skin of a Tyrc-2J/c-2J (B6.Albino) mouse 3 hours before laser-induced focal tissue damage (white circle at the start of the video). This representative video shows Grk2−/− (pseudo-colored in green) and control neutrophils (pseudo-colored in red) accumulating at the damage site in the skin dermis. Graphic analysis of the recruitment phase of several experiments (Fig. 2, D and E, and fig. S5, B and C) and analysis of the clustering response in this video (Fig. 2, F and G) reveal comparable recruitment of control and Grk2−/− neutrophils to the focal injury at early swarming phases. Over time, Grk2−/− neutrophils remain actively motile in growing clusters and dominate over control cells in the neutrophil cluster center. Two-photon intravital microscopy (x, y, z = 512 µm, 512 µm, 12 µm; merge of z-stack), 18 frames/s. Time is displayed in minutes. Second part (small neutrophil swarms): Primary neutrophils were isolated from the bone marrow of Grk2∆PMN Lifeact-GFP mice and injected i.d. into the ventral ear skin of a CAG-DsRed+/+ Tyrc-2J/c-2J mouse 3 hours before laser-induced focal tissue damage. This representative video shows the accumulation of Grk2−/− neutrophils (pseudo-colored in green) at a small cluster of endogenous WT neutrophils (pseudo-colored in red) that formed at the laser damage site. Analysis of the clustering response of several experiments, including comparison to control WT Lifeact-GFP neutrophil injection (fig. S5E) reveals that the continued motility of Grk2−/− neutrophils displaces control cells in the centers of small neutrophil clusters. Two-photon intravital microscopy (x, y, z = 512 µm, 512 µm, 3 µm; merge of z-stack), 24 frames/s. Time is displayed in minutes. Third part (eosinophil swarms): GRK2 controls the accumulation of swarming eosinophils around worm larvae. WT and Grk2−/− eosinophils from IL-5 cultures of WT and Vav-iCre Grk2fl/fl mouse bone marrow, respectively, were differentially dye-labeled and placed in a 1:1 ratio with 4-day-old C. elegans dauer larvae in Matrigel. This representative video shows the recording of bright-field (top left) and fluorescent microscopy (right) in which Grk2−/− (pseudo-colored in pink) and control (pseudo-colored in blue) eosinophils swarm and accumulate side by side around an individual larva. Analysis of eosinophil clustering of several experiments (Fig. 2I) reveals an increased clustering response of Grk2−/− eosinophils at the worm larva (dotted outline). Spinning-disk confocal microscopy (x, y = 269 µm, 365 µm; stitched from multi-tiled images), 10 frames/s. Time is displayed as hours:min.
Movie 3.
Movie 3.. GRK2 controls neutrophil arrest in transient swarm clusters and limits neutrophil space exploration in infected tissues.
First part (in vitro): GRK2 limits neutrophil space exploration between competing gradients of swarm attractants. WT and Grk2−/− neutrophils were differentially dye-labeled and loaded in a 1:1 ratio into wells of a modified under-agarose assay setup that allows the analysis of neutrophil sequential navigation behavior in response to multiple attractant sources. Neutrophils were exposed to two spatiotemporally separated gradients of the swarm attractants LTB4 (1 µM) and CXCL2 (1 µM). First, Grk2−/− (pseudo-colored in orange) and WT neutrophils (pseudo-colored in blue) respond to a first gradient of LTB4/CXCL2 (gradient direction from top to bottom). The movie sequence shows side-by-side migration of tracked cells and starts 2 hours after the attractants were added. Second, WT and Grk2−/− neutrophils are redirected after 3 hours by an additional gradient of LTB4/CXCL2 at a 90° angle (gradient direction from right to left). This second movie starts immediately after attractants were added. Cell migration was tracked using Imaris spot function. Each circle indicates an individual neutrophil with motion paths as dragontails over the last 10 min (first movie) or 30 min (second movie) in the corresponding pseudo-color. Graphic analysis of this video (Fig. 3A and fig. S6, B and C) reveals that Grk2−/− neutrophils, in contrast to WT cells, were not desensitized by the first gradient and could be redirected by an additional gradient of the same attractants. Spinning-disk confocal microscopy (x, y = 1682 µm, 1391 µm; stitched from multi-tiled images), 12 frames/s. Time is displayed as hours:min. Second part (P. aeruginosa–infected lymph node): GRK2 controls neutrophil arrest in transient swarm clusters in vivo. Mice with mixed bone marrow [Ly6gCre/+ Rosa26LSL:Tom (WT) pseudo-colored in red; Mrp8-Cre Grk2fl/fl Lyz2Gfp/+ (Grk2−/−) pseudo-colored in green] were injected with P. aeruginosa (PA)–GFP (fluorescence not visible here) into the footpad before endogenous neutrophils were recorded 3 to 4 hours later. Two-photon intravital microscopy of transient neutrophil swarms was performed on the SCS of draining popliteal lymph nodes. This representative video shows Grk2−/− (pseudo-colored in green) and control neutrophils (pseudo-colored in red) side by side during the formation and disappearance of transient neutrophil swarm clusters. Arrows indicate neutrophil clusters; the pink arrow highlights neutrophil migration out of one cluster to a newly developing cluster. Static images of this video are presented in Fig. 3C. Graphic analysis of several experiments (Fig. 3D) reveals that Grk2−/− neutrophils dominate over control cells in the central regions of newly forming clusters. Moreover, Grk2−/− neutrophils also migrate rapidly out of clusters again and become redirected to the centers of newly developing clusters. Two-photon intravital microscopy (x, y, z = 504 µm, 404 µm, 14 µm; merge of z-stack), 12 frames/s. Time is displayed in minutes. Third part (S. typhimurium–infected lymph node): Mice with mixed bone marrow [Ly6gCre/+ Rosa26LSL:Tom (WT) pseudo-colored in red; Mrp8-Cre Grk2fl/fl Lyz2Gfp/+(Grk2−/−) pseudo-colored in green] were injected with S. typhimurium into the footpad; endogenous neutrophils were recorded 3 to 4 hours later. Two-photon intravital microscopy of transient neutrophil swarms was performed on the SCS of draining popliteal lymph nodes. This representative video shows Grk2−/− (in green) and control neutrophils (in red) side by side during the formation and disappearance of transient neutrophil swarm clusters (arrows). Static images of this video and graphic analysis of several experiments (fig. S6, E and F) reveal that Grk2−/− neutrophils dominate over control cells in the central regions of newly forming clusters during S. typhimurium infection. Moreover, Grk2−/− neutrophils migrate rapidly out of clusters again, have increased interstitial speed, and become redirected to the centers of newly developing clusters. Two-photon intravital microscopy (x, y, z = 512 µm, 512 µm, 10 µm; merge of z-stack), 12 frames/s. Time is displayed in minutes. Fourth part (P. aeruginosa–infected lymph node): GRK2 limits neutrophil space exploration in infected lymph node tissue. Cell tracking of endogenous WT and Grk2−/− neutrophils that migrate side by side in the interstitial areas of a P. aeruginosa–infected lymph node (image insert, tissue region as in second part of this video). This representative video shows the interstitial scanning behavior of Grk2−/− (pseudo-colored in green) and control neutrophils (pseudo-colored in red) with motion paths over the last 15 min as dragontails in the corresponding pseudo-color. At the end, the total trajectories of individual neutrophils after 60 min are shown as tracks color-coded for average speed. Graphic analysis (Fig. 3E) reveals that neutrophils lacking GRK2 show increased tissue scanning but impaired migration arrest during interstitial movement in infected lymph nodes. Cell tracking based on two-photon intravital microscopy, 10 frames/s. Time is displayed in minutes.
Movie 4.
Movie 4.. GRK2 controls arrest to form stable neutrophil clusters in order to contain bacterial growth.
First part: Swarm-like dynamics of P. aeruginosa precede macrophage death in vitro. Bone marrow–derived macrophages were fluorescently labeled with CellTracker Blue and co-incubated with P. aeruginosa PAO-1 expressing GFP (PA-GFP). This representative video shows macrophages (pseudo-colored in violet) and PA-GFP (pseudo-colored in green) in the presence of propidium iodide as marker for dying cells (pseudo-colored in red), and reveals pack-swarming bacteria that precede macrophage cell death at local sites. Right panels show zoom-in on dying macrophage clusters. Static images of this video and the quantification of macrophage survival of several experiments are shown in fig. S7, B and C. Laser-scanning fluorescence confocal microscopy (x, y, z = 1024 µm, 1024 µm, 4 µm; merge of z-stack), 12 frames/s. Time is displayed in minutes. Second part: Grk2−/− neutrophils form larger clusters but show impaired control of bacterial growth. To mimic a bacterial infection of the lymph node SCS in vitro, we co-incubated bone marrow–derived macrophages with PA-GFP in the presence of either Grk2−/− or WT neutrophils. This video shows representative experiments in which the swarming dynamics of WT and Grk2−/− neutrophils (pseudo-colored in blue) and bacteria (pseudo-colored in green) are shown together at left, and bacteria fluorescence signal alone at right. Macrophages were present but are not displayed here. Graphic analysis of several experiments (Fig. 4, B and C) reveals increased growth of bacteria in experiments with Grk2−/− neutrophils in comparison to control cells, in particular in the extracellular space between neutrophil clusters.Laser-scanning fluorescence confocal microscopy (x, y, z = 513 µm, 513 µm, 4 µm; merge of z-stack), 20 frames/s. Time is displayed as hours:min. Third part: GRK2 controls neutrophil arrest to form stable swarm clusters. Bone marrow–derived macrophages were co-incubated with PA-GFP in the presence of either Grk2−/− or WT neutrophils. Neutrophils of one genotype were split into three fractions and differentially labeled with three dyes (CellTracker Blue, 5-TAMRA, CellTracker Far Red) before they were pooled and added to the coculture. Triple-color labeling allowed the identification and single-cell tracking of neutrophils in dense cell clusters. This video shows representative neutrophil dynamics in one Grk2−/− or WT clusters (left), together with single-cell motion tracks over the last 45 min as red dragontails and tracked cells as white circles (right). Graphic analysis of several experiments (Fig. 4, D to F, and fig. S7F) reveals that Grk2−/− neutrophils lack arrest phases at clusters and move rapidly out of them again, resulting in unstable neutrophil aggregates. Laser scanning confocal microscopy (x, y, z = 89 µm, 78 µm, 6 µm; merge of z-stack), 15 frames/s. Time is displayed as hours:min.

Comment in

  • Swarming motility in host defense.
    Rocha-Gregg BL, Huttenlocher A. Rocha-Gregg BL, et al. Science. 2021 Jun 18;372(6548):1262-1263. doi: 10.1126/science.abj3065. Science. 2021. PMID: 34140369 No abstract available.
  • Neutrophil swarm control: what goes up must come down.
    Uderhardt S, Knopf J, Herrmann M. Uderhardt S, et al. Signal Transduct Target Ther. 2021 Dec 6;6(1):416. doi: 10.1038/s41392-021-00836-5. Signal Transduct Target Ther. 2021. PMID: 34873155 Free PMC article. No abstract available.

References

    1. Breed MD, Guzmán-Novoa E, Hunt GJ, Defensive behavior of honey bees: Organization, genetics, and comparisons with other bees. Annu. Rev. Entomol 49, 271–298 (2004). doi: 10.1146/annurev.ento.49.061802.123155 - DOI - PubMed
    1. Guo X et al., 4-Vinylanisole is an aggregation pheromone in locusts. Nature 584, 584–588 (2020). doi: 10.1038/s41586-020-2610-4 - DOI - PubMed
    1. Mahadeo DC, Parent CA, Signal relay during the life cycle of Dictyostelium. Curr. Top. Dev. Biol 73, 115–140 (2006). doi: 10.1016/S0070-2153(05)73004-0 - DOI - PubMed
    1. Ley K et al., Neutrophils: New insights and open questions. Sci. Immunol 3, eaat4579 (2018). doi: 10.1126/sciimmunol.aat4579 - DOI - PubMed
    1. Neupane ASW et al., Patrolling Alveolar Macrophages Conceal Bacteria from the Immune System to Maintain Homeostasis. Cell 183, 110–125.e11 (2020). doi: 10.1016/j.cell.2020.08.020 - DOI - PubMed

Publication types

MeSH terms