. 2021 Jun 17;12(1):3679.
doi: 10.1038/s41467-021-23758-w.

A single cell characterisation of human embryogenesis identifies pluripotency transitions and putative anterior hypoblast centre

Affiliations

A single cell characterisation of human embryogenesis identifies pluripotency transitions and putative anterior hypoblast centre

Matteo A Molè et al. Nat Commun. .

Abstract

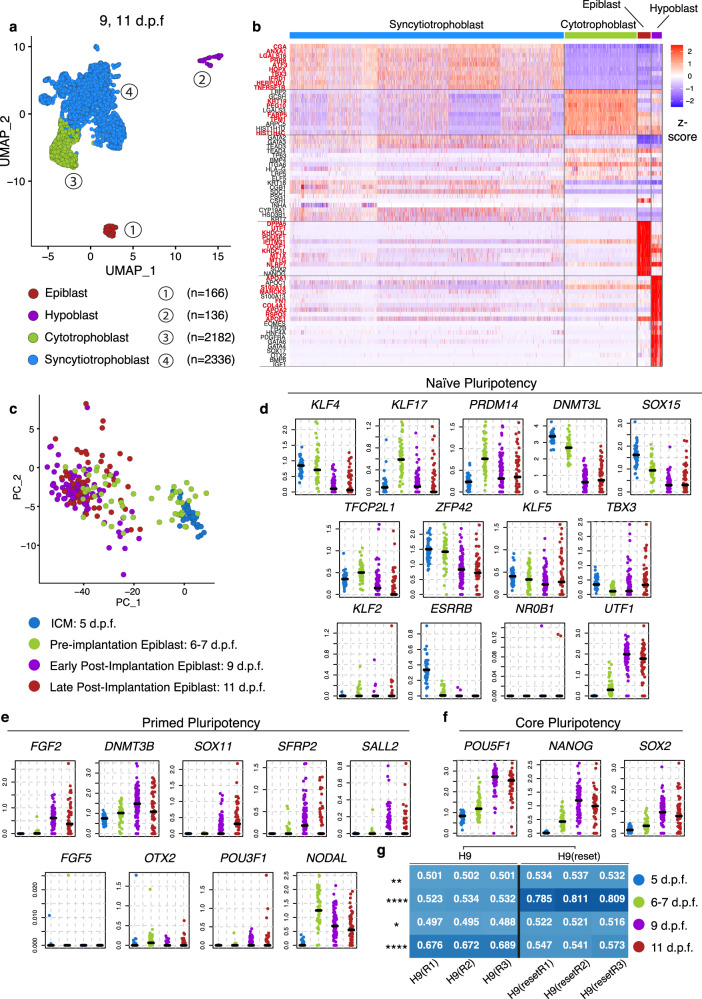
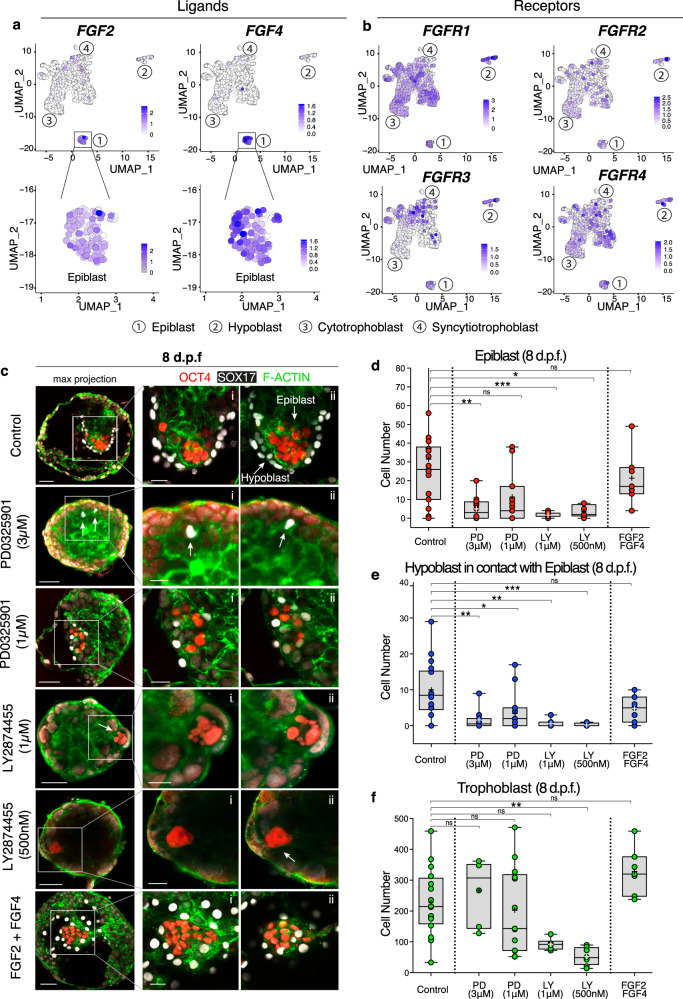
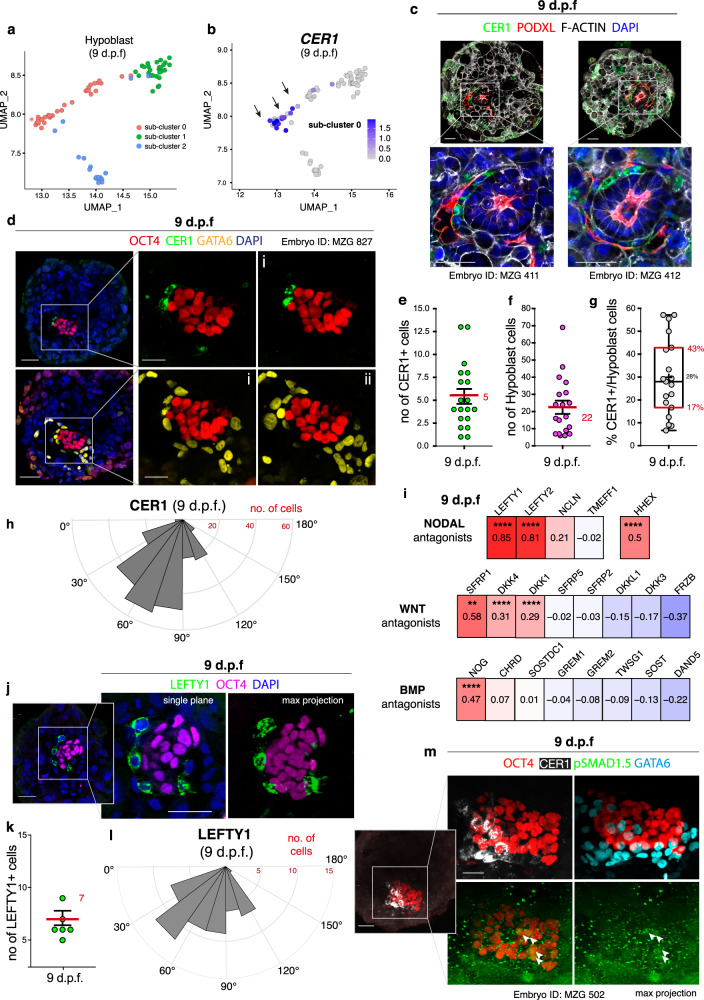
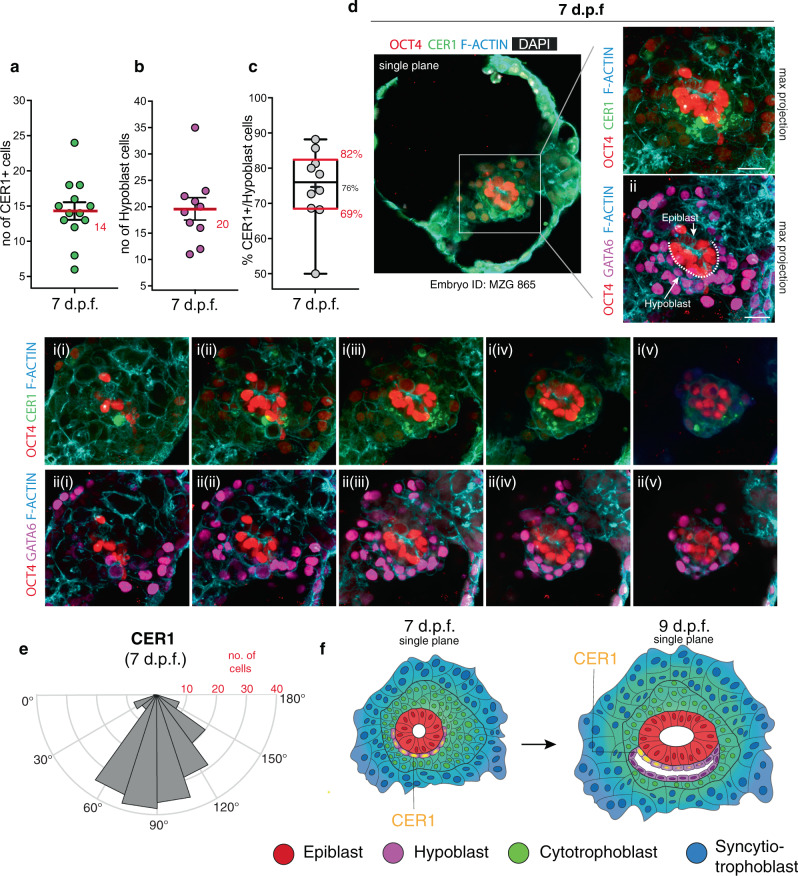
Following implantation, the human embryo undergoes major morphogenetic transformations that establish the future body plan. While the molecular events underpinning this process are established in mice, they remain unknown in humans. Here we characterise key events of human embryo morphogenesis, in the period between implantation and gastrulation, using single-cell analyses and functional studies. First, the embryonic epiblast cells transition through different pluripotent states and act as a source of FGF signals that ensure proliferation of both embryonic and extra-embryonic tissues. In a subset of embryos, we identify a group of asymmetrically positioned extra-embryonic hypoblast cells expressing inhibitors of BMP, NODAL and WNT signalling pathways. We suggest that this group of cells can act as the anterior singalling centre to pattern the epiblast. These results provide insights into pluripotency state transitions, the role of FGF signalling and the specification of anterior-posterior axis during human embryo development.


Conflict of interest statement

The authors declare no competing interests.

Figures

Fig. 1
Fig. 1. Single cell RNA sequencing of post-implantation human embryos and pluripotency transition profile.
a Identification of four major clusters coloured by lineage via UMAP: epiblast (red, 108 cells at 9 d.p.f., 58 cells at 11 d.p.f., total=166), hypoblast (purple, 82 cells at 9 d.p.f., 54 cells at 11 d.p.f., total = 136), cytotrophoblast (green, 1956 cells at 9 d.p.f, 226 cells at 11 d.p.f, total=2182), syncytiotrophoblast (cyan, 1058 cells 9 d.p.f., 1278 cells at 11 d.p.f., total = 2336). Number of embryos: n = 8 at 9 d.p.f., n = 8 at 11 d.p.f. Only embryos with all three lineages were analysed, refer to Supplementary Data 1. b Heatmap displaying z-score values of the most differentially expressed genes between different lineages, alongside known lineage markers. In bold red the top most enriched genes expressed in a particular lineage as shown in Supplementary Data 2. c Comparisons between pre-implantation single-cell sequenced epiblast and ICM cells previously published (cyan inner cell mass (ICM) at 5 d.p.f., green epiblast at 6–7 d.p.f.) versus our post-implantation datasets (purple epiblast at 9 d.p.f, red epiblast at 11 d.p.f.). Comparison of the expression levels of key markers of naïve pluripotency (d), primed pluripotency (e) and core pluripotency (f). Bars represent median. g Logistic regression analysis showing quantitative cell matching scores between human embryo datasets ICM at 5 d.p.f. (blue), pre-Epi at 6–7 d.p.f. (green) and post-Epi at 9 d.p.f. (purple) and at 11 d.p.f. (red) (y-axis) and human embryonic stem cells H9 and H9-Reset (x-axis). Comparison H9 vs H9-Reset by Sidak’s multiple comparisons ad-hoc test for 2 way ANOVA, H9 cells differ from the H9-Reset throughout stages: 5 d.p.f. (p = 0.0015**), 6–7 d.p.f. (p < 0.0001****), 9 d.p.f. (p = 0.0101*) and 11 d.p.f. (p < 0.0001****). This difference is highly significant at 6-7 d.p.f., with H9-Reset cells sharing similarities to 6–7 d.p.f. pre-implantion epiblast, and at 11 d.p.f. with H9 cells sharing similarities with 11 d.p.f. post-implantion epiblast.
Fig. 2
Fig. 2. FGF signalling is required for proliferation during post-implantation development.
a/b UMAPs showing expression levels of main FGF ligands (FGF2/4) (a) and receptors (FGFR1/2/3/4) (b). The epiblast is a source of FGF2/4. FGF receptors (FGFR1/2/3/4) are widely expressed throughout all the lineages, with FGFR1 being the most highly expressed. c Immunofluorescence of human embryos at 8 d.p.f. cultured in DMSO control, in MEK inhibitor PD0325901 at 3 and 1 μM, in pan-FGFR inhibitor LY2874455 at 1 μM and 500 nM, in FGF2/4+heparan sulphate proteoglycans. On the left: zoom-out maximum projection, on the right z-sections. Number of experimental replicates: 9. df Quantification of the cell number for the epiblast marked by OCT4 (d), hypoblast by SOX17 expressing cells in contact with the basal side of epiblast (e), and trophoblast (negative for OCT4/SOX17) (f). Statistical test: two-tailed Kruskal–Wallis test with Dunn’s correction. d Inhibition by PD 3 μM causes significant reduction of OCT4 cells, non-significant at 1 μM: p = 0.0026 (**) control vs PD 3 μM. Inhibition by LY causes a significant reduction both at 1 μM and 500 nM: p = 0.0006 (***) control vs LY 1 μM, p = 0.0109 (*) control vs LY 500 nM. Non-significant difference when supplemented with FGF2/4. e Inhibition by PD causes a significant reduction of SOX17 cells both at 3 μM and 1 μM: p = 0.0023 (**) control vs PD 3 μM, p = 0.0203 (*) control vs PD 1 μM. Inhibition by LY causes a significant reduction both at 1 μM and 500 nM: p = 0.0011 (**) control vs LY 1 μM, p = 0.0002 (***) control vs LY 500 nM. Non-significant difference when supplemented with FGF2/4. f Inhibition by PD does not cause a significant reduction in trophoblast cells, either at 3 μM or 1 μM. Inhibition by LY causes significant reduction only at 500 nM: p = 0.0015 (**) control vs LY. Non-significant difference when supplemented with FGF2/4. Box represents the 25th–75th percentiles interval, middle line the median, cross represents the mean, whiskers show the minimum and maximum values, dots represent individual embryos. Number of embryos: control (n = 19), PD 3 μM (n = 12), PD 1 μM (n = 15), LY 1 μM (n = 8), LY 500 nM (n = 8), FGF2/4 (n = 7). Scale bars: 50 μm (Fig. 2c) and 25 μm (Fig. 2c i–ii, zoom). Source data are provided as a Source Data file.
Fig. 3
Fig. 3. Characterisation of the putative anterior hypoblast in human embryos at 9 d.p.f.
a UMAP of hypoblast cells subdivided into sub-clusters 0-2. Most enriched genes expressed in each sub-cluster are reported in Supplementary Data 8. b Sub-cluster 0 expresses CER1. c, d Immunofluorescence at 9 d.p.f.: CER1 is expressed asymmetrically in a subset of hypoblast cells (GATA6+). N (experimental replicates): 3. N(embryos): 19 e, Quantification CER1+ cells (n = 19 embryos, mean in red ± SEM). f Quantification hypoblast cells (GATA6+) in contact with basal epiblast (n = 19 embryos, mean in red ±SEM). g Percentage of CER1+ cells versus total hypoblast cells per embryo. Boxes represent the 25th/75th percentiles, red line the median, cross the mean, whiskers the min/max, dots individual embryos (n = 19); N(experimental replicates): 3. Source data provided as a Source Data file. h Quantification of angular distribution of CER1+ cells along the hypoblast hemisphere (0° to 180°). N(embryos) n = 28, combined from Supplementary Figure 7f (all embryos included). CER1+ cells show a significant localisation bias towards one side of the hypoblast in 10/28 embryos (Supplementary Figure 7f). i, Correlation analysis of CER1 with WNT, BMP and NODAL antagonists. Co-expression corrected by Benjamini–Hochberg: significant correlations between CER1 and LEFTY1 (p = 4.21E−13), LEFTY2 (p = 2.75E−10), HHEX (p = 1.88E−07), NOG (p = 1.39E−08), DKK4 (p = 4.41E−07), DKK1 (p = 1.65E−05), SFRP1 (p = 0.0047). Correlation with NCLN, CHRD and SOSTDC1 are ns. j Immunofluorescence of LEFTY1 at 9 d.p.f.. N(experimental replicates): 3. N(embryos): 7. k Quantification of LEFTY1+ cells (n = 7 embryos, mean in red ± SEM). l Quantification of angular distribution of LEFTY1 + cells along the hypoblast hemisphere. N(embryos) n = 7, combined from Supplementary Fig. 10a. LEFTY1+ cells showed a statistically significant localisation bias in 2/7 embryos (Supplementary Figure 10a). m Immunofluorescence at 9 d.p.f. of nuclear pSMAD1.5 in a subset of OCT4+ cells (arrows) distant from CER1 domain, where pSMAD1.5 is not detected. N(experimental replicates): 8. N(embryos) stained for pSMAD1.5 = 29; 9/29 embryos (31%) show pSMAD1.5 in OCT4+ cells; 8/9 embryos (89%) display localisation of pSMAD1.5 distant to CER1. Scale bars: 50 μm (Fig. 3c,j, Fig. 3d,m (left)), 25 μm (Fig. 3d,m (right)). Source data are provided as a Source Data file.
Fig. 4
Fig. 4. Characterisation of the putative anterior hypoblast in the human embryos at 7 d.p.f.
a Quantification of the number of CER1 expressing cells (n = 13 embryos, mean in red ± SEM). b Quantification of the number of hypoblast cells as GATA6+ cells lining the basal side of epiblast (n = 10 embryos, mean in red ±SEM). c Percentage of hypoblast cell expressing CER1. Boxes represent the 25th and 75th percentiles, red line the median, cross the mean, whiskers the min and max values, dots individual embryos (n = 10 embryos). N experimental replicates: 5. d Immunofluorescence analysis of embryos at 7 d.p.f. reveals the widespread distribution of CER1 cells along the hypoblast, marked by GATA6 along the basal side of the epiblast epithelium (ii). N experimental replicates: 5. N(embryos) analysed: 13 e Quantification in 3D of the angular distribution of CER1 expressing cells along the hypoblast hemisphere at 7 d.p.f. (0° to 180°). N embryos: 10. f Model of the establishment of the putative anterior hypoblast centre: initially at 7.d.p.f. the putative anterior hypoblast centre is radially expressed throughout most of the cells of the hypoblast and particularly enriched distally. At 9.d.p.f. the putative anterior hypoblast centre becomes localised asymmetrically to one side of the hypoblast, repressing the activity of key signalling pathways such as BMP on the adjacent epiblast. Asymmetric activity may discriminate the future anterior region from the prospective posterior region of the epiblast, where gastrulation will occur. Scale bars: 50 μm (4a, zoom out), 25 μm (4d, i–xii). Source data are provided as a Source Data file.

References

    1. Wamaitha, S. E. & Niakan, K. K. Human pre-gastrulation development.Curr Top Dev Biol. 128, 295–338 (2018). 10.1016/bs.ctdb.2017.11.004. - PubMed
    1. Molè MAMA, Weberling A, Zernicka-Goetz M. Comparative analysis of human and mouse development: from zygote to pre-gastrulation. Curr. Top. Dev. Biol. 2020;136:113–138. doi: 10.1016/bs.ctdb.2019.10.002. - DOI - PubMed
    1. Rossant J, Tam PPL. New insights into early human development: lessons for stem cell derivation and differentiation. Cell Stem Cell. 2017;20:18–28. doi: 10.1016/j.stem.2016.12.004. - DOI - PubMed
    1. Morgani, S. M. & Hadjantonakis, A.-K. Signaling regulation during gastrulation: Insights from mouse embryos and in vitro systems. Curr Top Dev Biol.137, 391–431 (2020). 10.1016/bs.ctdb.2019.11.011. - PubMed
    1. Shahbazi MN. Mechanisms of human embryo development: from cell fate to tissue shape and back. Development. 2020;147:dev190629. doi: 10.1242/dev.190629. - DOI - PMC - PubMed

Publication types

MeSH terms