. 2021 Jun 17;12(1):3689.
doi: 10.1038/s41467-021-23884-5.

Dendritic calcium signals in rhesus macaque motor cortex drive an optical brain-computer interface

Affiliations

Dendritic calcium signals in rhesus macaque motor cortex drive an optical brain-computer interface

Eric M Trautmann et al. Nat Commun. .

Abstract

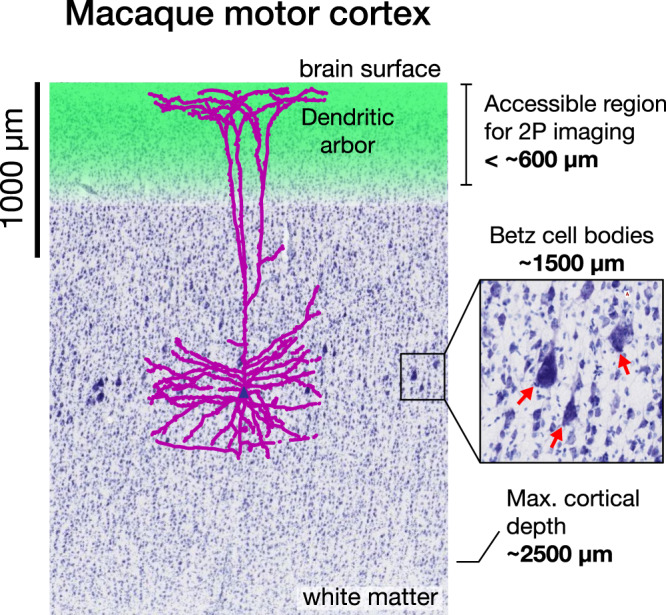
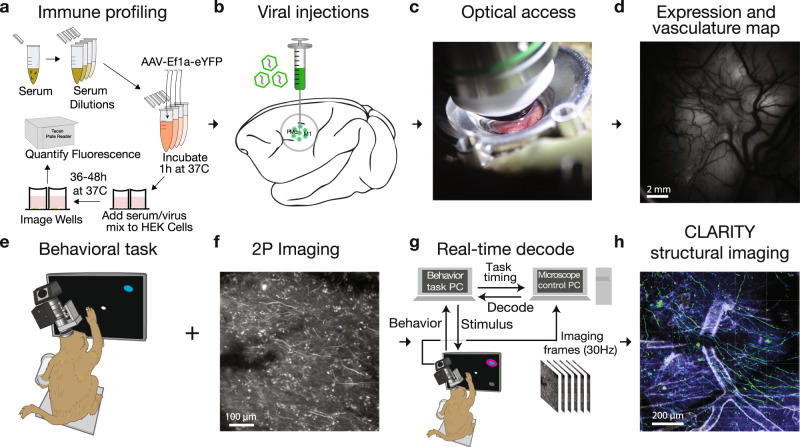
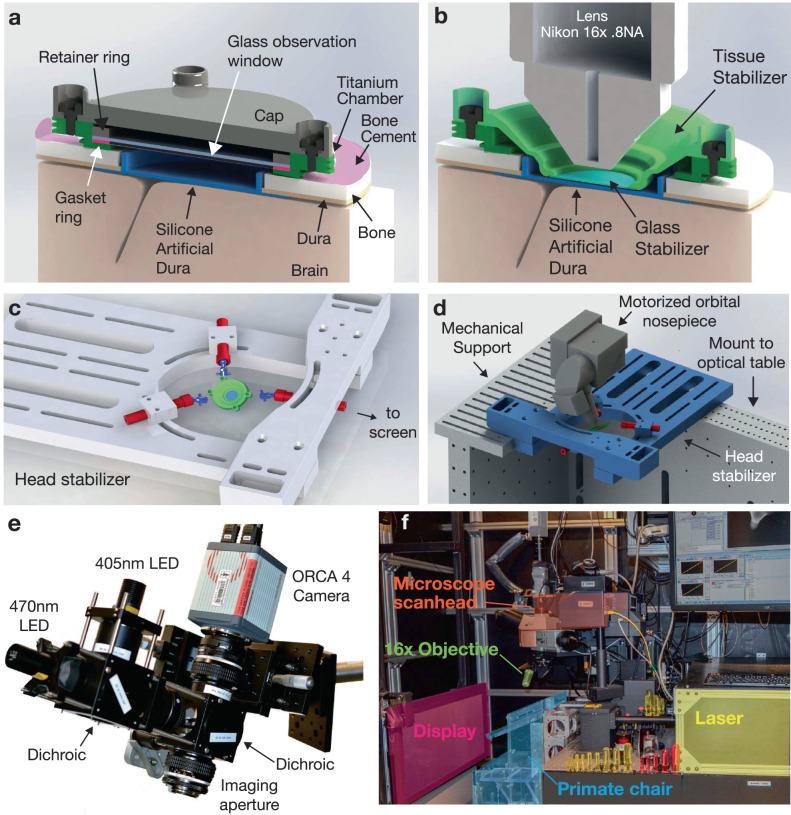
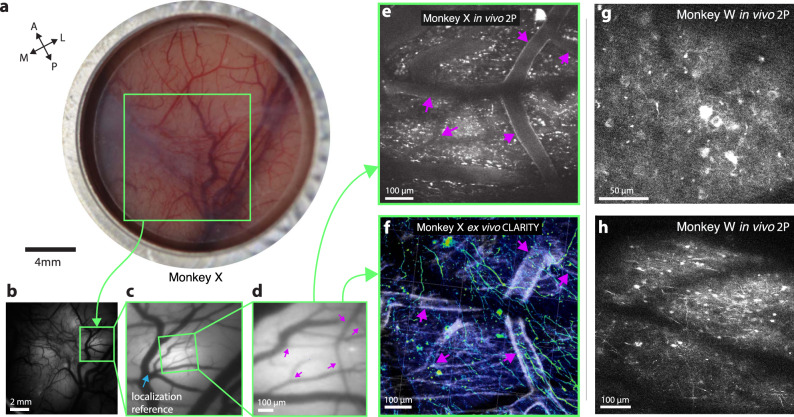
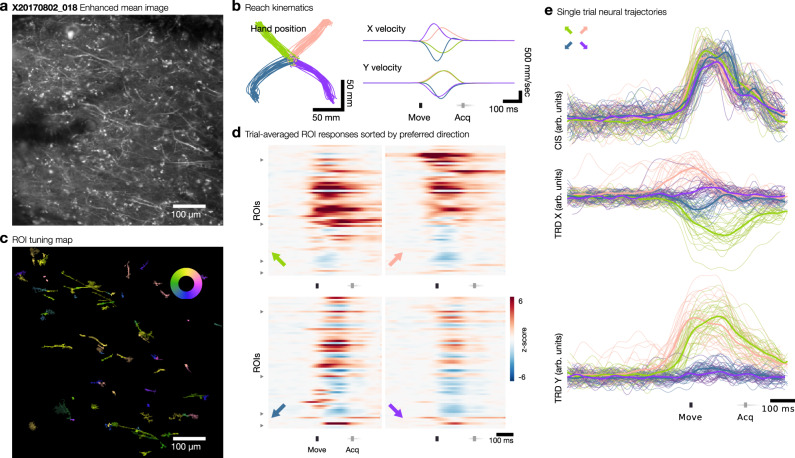
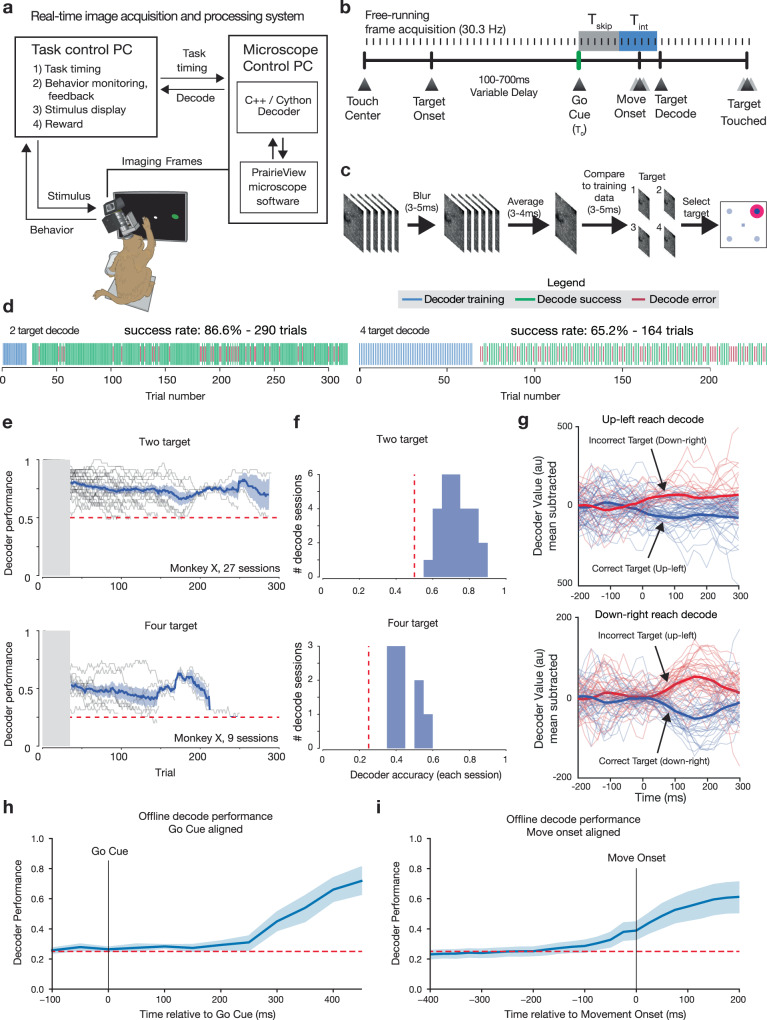
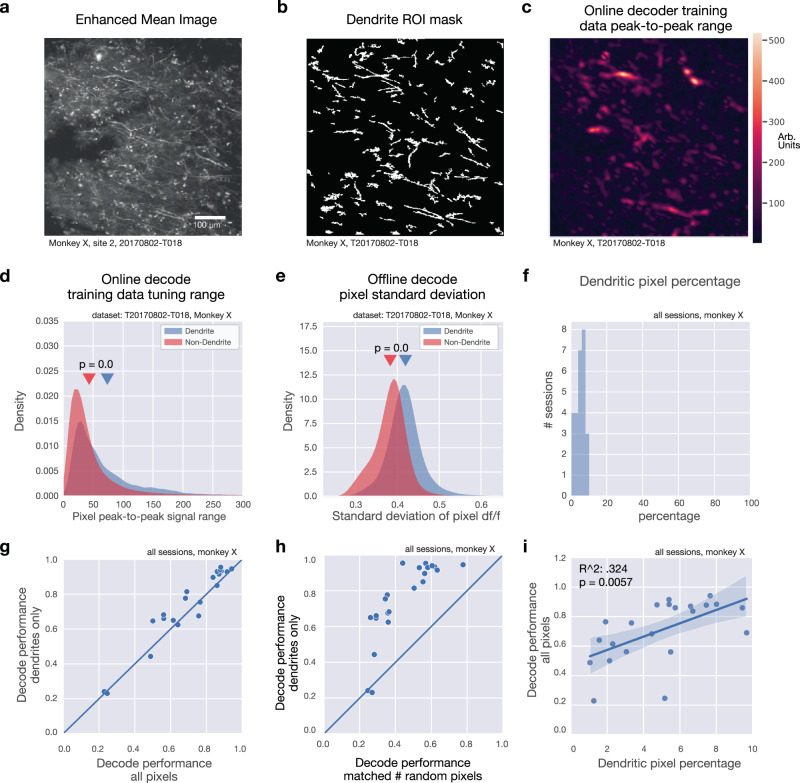
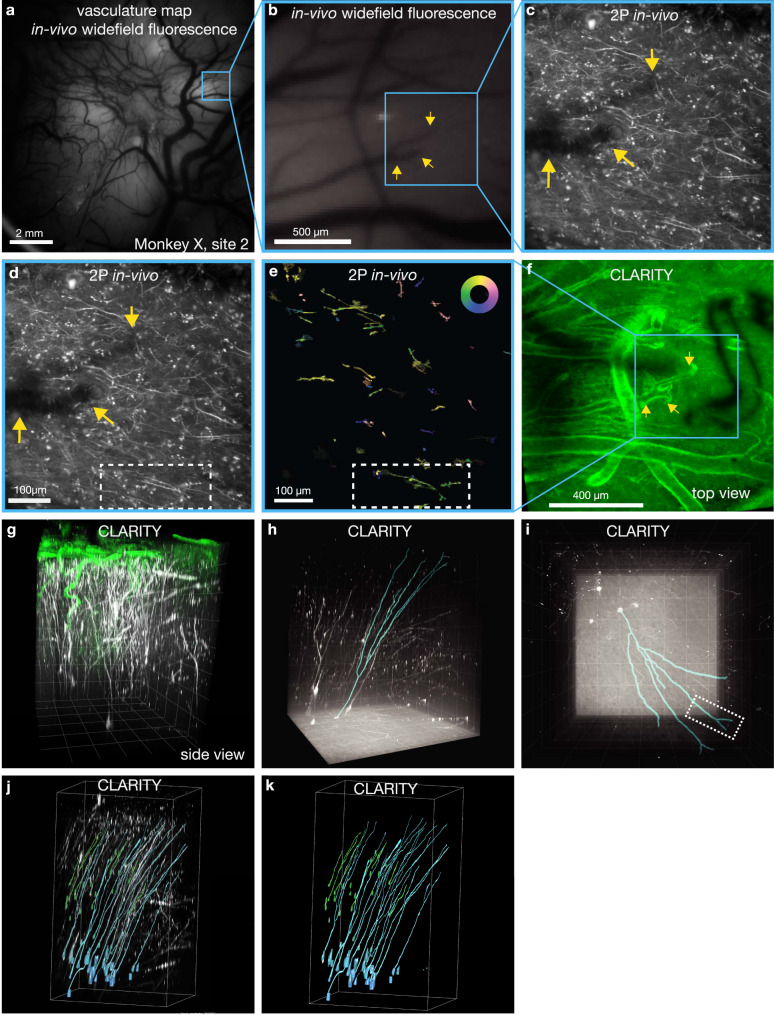
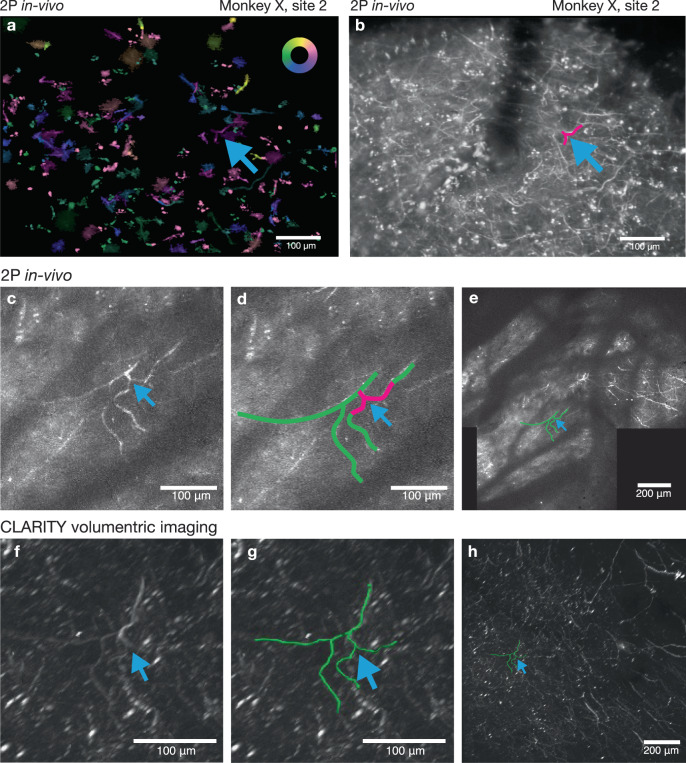
Calcium imaging is a powerful tool for recording from large populations of neurons in vivo. Imaging in rhesus macaque motor cortex can enable the discovery of fundamental principles of motor cortical function and can inform the design of next generation brain-computer interfaces (BCIs). Surface two-photon imaging, however, cannot presently access somatic calcium signals of neurons from all layers of macaque motor cortex due to photon scattering. Here, we demonstrate an implant and imaging system capable of chronic, motion-stabilized two-photon imaging of neuronal calcium signals from macaques engaged in a motor task. By imaging apical dendrites, we achieved optical access to large populations of deep and superficial cortical neurons across dorsal premotor (PMd) and gyral primary motor (M1) cortices. Dendritic signals from individual neurons displayed tuning for different directions of arm movement. Combining several technical advances, we developed an optical BCI (oBCI) driven by these dendritic signalswhich successfully decoded movement direction online. By fusing two-photon functional imaging with CLARITY volumetric imaging, we verified that many imaged dendrites which contributed to oBCI decoding originated from layer 5 output neurons, including a putative Betz cell. This approach establishes new opportunities for studying motor control and designing BCIs via two photon imaging.


Conflict of interest statement

K.V.S. is a consultant to Neuralink Corp. and CTRL-Labs Inc. (now a part of the Facebook Reality Labs division of Facebook) and on the Scientific Advisory Boards of Mind-X Inc., Inscopix Inc. and Heal Inc. K.D. is on the scientific advisory board of Maplight Therapeutics. These entities did not support this work. Following this study, J.H.M. is now a member of the scientific advisory board of Bruker. M.M. is employed by Neuralink Corp. The remainder of the authors declare no competing interests (E.M.T, D.J.O, X.S, G.B., S.I.R, A.C., B.H., S.V., L.C., W.A, I.K., S.Q., M.M., Y.C., M.W. E.S., C.R., and M.S.).

Figures

Fig. 1
Fig. 1. Dendritic calcium signals are readily accessible from layer five neurons.
Two photon (2P) calcium imaging is currently capable of recording neural activity from the surface down to approximately 600 µm (green region), but photon scattering poses a challenge for imaging deeper. In this work, we demonstrate that it is possible to record neural activity of Layer 5 pyramidal neurons with cell bodies approximately 1500 µm below the surface (red arrows, inset) by imaging apical dendrites in superficial layers (purple), in addition to somatic signals from neurons located in layers 2/3 (blue cell bodies). Nissl stain image source: brainmaps.org.
Fig. 2
Fig. 2. Experimental pipeline for combining functional imaging during motor behaviors with structural imaging in macaque monkeys.
a Prior to imaging, we performed a neutralizing antibody assay in order to select an appropriate viral serotype tailored to the immune response of each monkey. b Viral constructs were injected into cortex to deliver the calcium reporter gene. c A chamber designed for chronic 2P imaging in premotor cortex and motor cortex was implanted. d Widefield (1P) imaging was used to assess GCaMP expression and establish vascular fiducial markers for navigating to specific sites on the cortex (representative example, single image collected prior to most recording sessions). e A macaque was trained to perform a reaching task to radially arranged targets. f 2P imaging was used to obtain functional signals at single-cell resolution from motor cortex (contrast-enhanced mean-intensity projection from one representative dataset of 36 sessions). g During training trials, a decoder was trained on the imaging data obtained during reaching movements. Subsequently, during test trials, this decoder was run in real time to decode (predict) the reach target from 2P imaging data. h Ex vivo CLARITY was performed to identify cell morphology, projection patterns and cell type (anti-GCaMP antibody labeling green, vasculature white, and results from single imaging session).
Fig. 3
Fig. 3. Implantable chamber and imaging apparatus.
a Implantable titanium chamber in non-imaging configuration enabled observation through a glass window if the cap is removed. The glass window enabled long-term application of antibiotics and drugs to help maintain the health of the tissue margin. b During imaging, the cap and glass window were removed, and a temporary stabilizer is placed inside the chamber to restrict tissue motion via gentle downwards pressure on the surface of cortex. c, d While imaging, the implant was stabilized using three-point fixation to reduce motion of the tissue to micron levels. e Widefield imaging was performed using a custom microscope (see “Methods” section). f During 2P imaging, a macaque sat in a standard primate chair in front of a stimulus display screen. The 2P imaging system is placed in a cantilevered position off the edge of the optical table to access the primate’s motor cortex.
Fig. 4
Fig. 4. Multiscale, multi-modal imaging.
a Imaging chamber with stabilizer in place under ambient illumination, approximately two weeks after implant. b Cortical surface imaged using widefield (1P) imaging (representative example expression photo taken from the start of each imaging session). c Zoomed in region highlighted in green box in b. Vascular landmark used to calibrate microscope stage positions indicated with blue arrow. d Further zoomed widefield image showing microvascular features used for localizing 2P FOVs and aligning 2P imaging with CLARITY, marked with magenta arrows. e 2P image acquired from the same FOV as d. vascular landmarks marked with purple arrows. f CLARITY volume from the same FOV in d and e (anti-GCaMP antibody labeling green, vasculature white, results from a single ex vivo imaging session). g, h Two example fields of view including neural processes and L2/3 cell bodies ~250 µm below the surface vasculature (monkey W, example images from one of ~20 imaging sessions).
Fig. 5
Fig. 5. Functional responses during reaching behavior.
a Contrast enhanced mean image of example FOV from Monkey X, site 2, one of 36 analyzed imaging sessions. b Reaching kinematics observed during behavioral task. Move indicates movement onset; Acq indicates target acquisition. c ROI tuning map showing preferred direction of ROIs with significant direction tuning. Inset color wheel indicates reach direction. d Trial-averaged responses of dendritic ROIs, normalized to baseline fluorescence, for the four reaching directions indicated by the colored arrow in the bottom left of each raster. ROIs are sorted by preferred direction beginning with rightwards and proceeding counterclockwise; triangular ticks at left edge indicate locations of preferred directions of up-right, up-left, down-left, down-right. e Single-trial (thin lines) and trial-averaged (thick lines) population trajectories aligned to behaviorally-defined movement onset, projected along condition-independent signal (CIS) dimension and condition-dependent TDR X and Y dimensions (see “Methods” section), color coded by reach direction condition.
Fig. 6
Fig. 6. Real-time decode of neural activity from functional imaging in motor cortex.
a Real-time stimulus control was implemented by decoding frames acquired from the microscope directly from memory buffers on the acquisition hardware. This provided rapid low-level access to imaging data to train and implement the decoder. Decode results were sent via ethernet UDP to the task and stimulus control computer. b Frames were acquired by the imaging system and are integrated by the decoder during a fixed time window (Tint) beginning at a fixed latency (Tskip) after the go cue. c The frames acquired during the integration time were lightly blurred, averaged, and decoded using pixel-wise minimal mean squared error (MMSE) relative to training data (see “Methods” section). d Timelines of two example oBCI decode sessions (monkey X). The decoder was trained using the first 20–40 trials in a given block (blue ticks). Subsequent trials were classified using MMSE decoder using raw pixel values as features. e Decode performance over the course of many individual sessions for two target (top) and four target (bottom) tasks, monkey X (mean ± s.e.m.). Decoder performance was stable for up to hundreds of trials. In many cases, sessions were manually halted to record from a different field of view, not due to decreased decoder performance. Chance decoder performance is indicated by the dashed magenta line. f Histogram of mean success rate. Chance decoder performance is indicated by the magenta line. g Offline decoder score (cross-condition mean subtracted mean-squared error) using rolling 6-frame average for single trials, lower values represent images closer to the training set. h Offline decoder performance across sessions (mean ± s.e.m.) using multi-class SVM on go-cue aligned data i Same as h for movement onset aligned data.
Fig. 7
Fig. 7. Dendritic signals drive online decode.
a Mean intensity projection (contrast enhanced) for example imaging session (one of 36 sessions shown), b Dendrite ROI pixel mask for example in a. c Peak-to-peak pixel signal range across four reach directions for the online imaging decoder training data for example in a. Large values indicate large modulation and higher variability across different reach directions. d Comparison of distributions of pixel peak-to-peak range between dendritic pixels and non-dendritic pixels (rank-sum test, U statistic = 78.6356, p = 0.0). e Comparison of distributions of standard deviation of pixel df/f value across all timepoints and across reach directions between dendritic pixels and non-dendritic pixels (rank-sum test, U statistic = 113.6273, p = 0.0). f Histogram of percentage of pixels inside a dendritic ROI for all sessions, monkey X. g Comparison of offline decode performance using dendritic pixels only (ordinate) vs. all pixels (abscissa). h Comparison of offline decode performance using dendritic pixels only (ordinate) vs. a random selection of the same number of pixels as those within dendritic ROIs. i Decode performance as a function of the percentage of pixels associated with a dendritic ROI for each session. Blue line represents regression fit; shaded area indicates 95% confidence interval.
Fig. 8
Fig. 8. Identifying neurons in CLARITY and functional imaging.
a A widefield fluorescence image revealing vasculature landmarks was used to locate and register 2P imaging FOVs (representative example widefield image from the start of each imaging session). b Higher-magnification FOV from a with example vascular landmark indicated with yellow arrows. c Example mean intensity projection of all 2P frames acquired during a decode session using the FOV indicated in b by blue box, representative sample from one of 36 sessions). d The same image as c with selected dendritic processes are outlined in white dashed rectangle. e Pixel-wise tuning map, same FOV and presentation style as in Fig. 4h (Inset color wheel indicates reach direction). f CLARITY volume showing wide-area surface vasculature (lectin stain, green) with FOV from ce in blue box. Vascular fiducial feature from b, c indicated with yellow arrows. The dark feature on the right is an artifact from an occluding object only present during the CLARITY imaging (images acquired in one ex vivo session). g Side-view rendering of CLARITY volume showing a close up of neural processes extending from the FOV in a, b down to areas below the imageable regions using in vivo 2P imaging (green: lectin, white: GCaMP stain). Grid spacing 200 µm. h Rendering of CLARITY volumetric imaging showing a side view of motor cortical tissue spanning cortical lamina with putative Betz cells located in layer 5, approximately 1500 µm below the surface. Blue outline indicates the traced reconstruction of the dendritic process imaged superficially in e, traced from the dendritic arbor down to the cell soma. The location and large size of the soma suggests this cell is likely to be a Betz cell (Grid spacing 200 µm). i Surface image of reconstructed arbor; white dashed rectangle indicates matching region from e (Grid spacing 200 µm). j Cell bodies identified in layers 2/3 (green) and 5 (cyan) with their dendrites extending to the superficial layer, as traced by CLARITY and highlighted in different colors. k Traced neurons only. Data from Monkey X, injection site 2. gk Imaged volume size: 1.27 mm × 1.27 mm × 1.62 mm.
Fig. 9
Fig. 9. A second example of a neural process functionally imaged and reconstructed in the registered CLARITY volume.
a Pixel-wise tuning map, same FOV and presentation style as in Fig. 4h (Inset color wheel indicates reach direction). A neural feature of interest is indicated by the blue arrow. b. Mean intensity projection of FOV in a. The same process is labeled with a blue arrow. This image represents only a thin slice through the tissue volume. c Maximum intensity projection from in vivo volumetric z-stack showing projection of the neural features labeled in a and b. More structure is present in this image than in b, since this image is a maximum intensity projection of images acquired at multiple depths. d Same image as c, with the neural feature of interest from ac traced in green. e Maximum intensity projection of stitched 3D volume assembled from in vivo 2P imaging. f Closeup view of ex vivo imaged CLARITY volume. The neural feature from ae is marked with the blue arrow. g Same as f with the feature from ae traced in green. h Wide view of CLARITY volume. Data from Monkey X, injection site 2.

Comment in

References

    1. Collinger JL, et al. High-performance neuroprosthetic control by an individual with tetraplegia. Lancet. 2013;381:557–564. doi: 10.1016/S0140-6736(12)61816-9. - DOI - PMC - PubMed
    1. Pandarinath C, et al. Neural population dynamics in human motor cortex during movements in people with ALS. eLife. 2015;4:e07436. doi: 10.7554/eLife.07436. - DOI - PMC - PubMed
    1. Shenoy KV, Carmena JM. Combining decoder design and neural adaptation in brain-machine interfaces. Neuron. 2014;84:665–680. doi: 10.1016/j.neuron.2014.08.038. - DOI - PubMed
    1. Taylor DM, Tillery SIH, Schwartz AB. Direct cortical control of 3D neuroprosthetic devices. Science. 2002;296:1829–1832. doi: 10.1126/science.1070291. - DOI - PubMed
    1. Serruya MD, Hatsopoulos NG, Paninski L, Fellows MR, Donoghue JP. Instant neural control of a movement signal. Nature. 2002;416:141–142. doi: 10.1038/416141a. - DOI - PubMed

Publication types

MeSH terms

LinkOut - more resources