. 2021 Jun 17;12(1):3684.
doi: 10.1038/s41467-021-24010-1.

Single-cell RNA sequencing shows the immunosuppressive landscape and tumor heterogeneity of HBV-associated hepatocellular carcinoma

Affiliations

Single-cell RNA sequencing shows the immunosuppressive landscape and tumor heterogeneity of HBV-associated hepatocellular carcinoma

Daniel Wai-Hung Ho et al. Nat Commun. .

Abstract

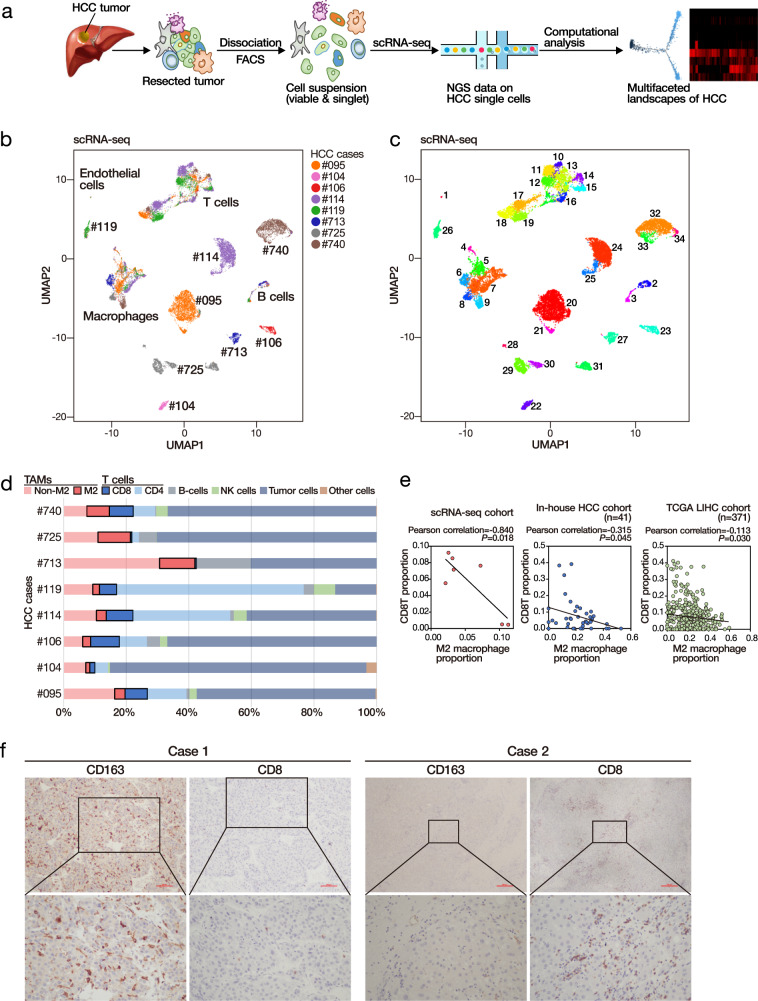
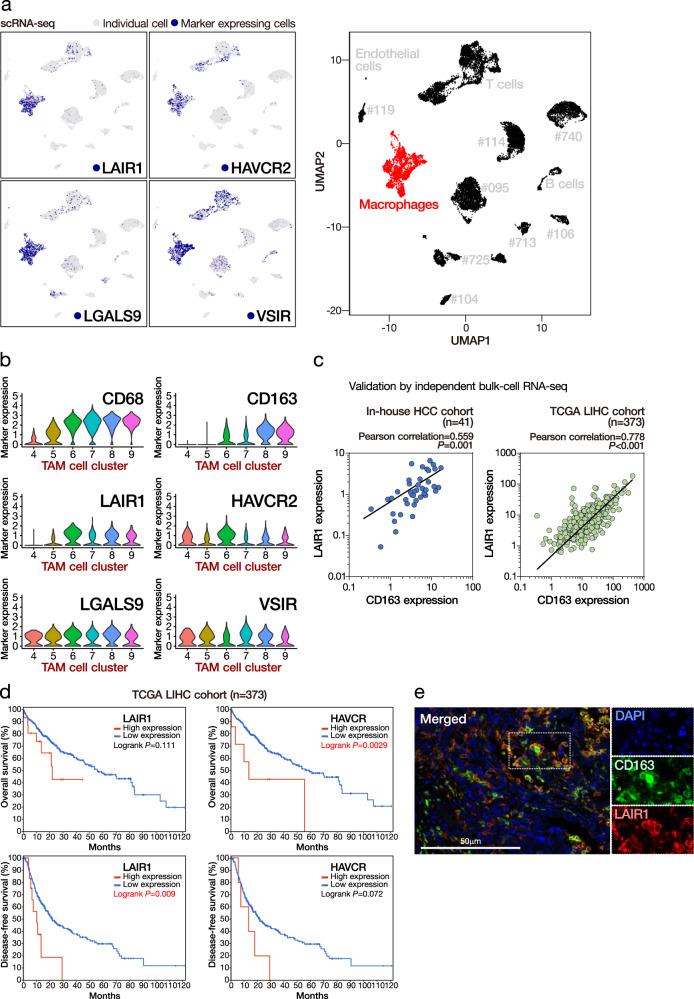
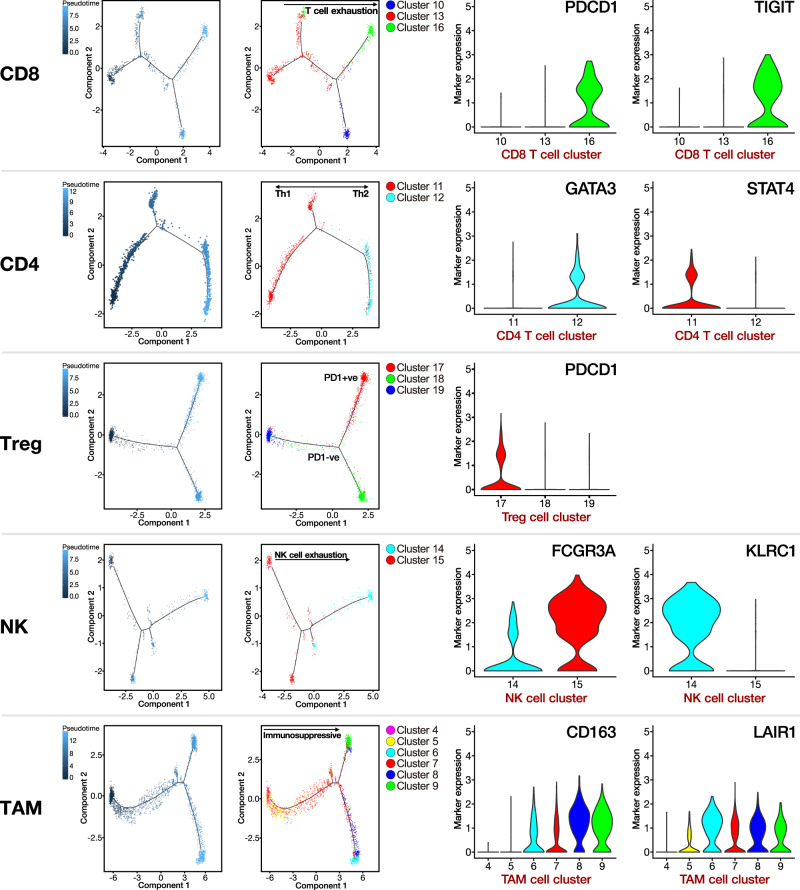
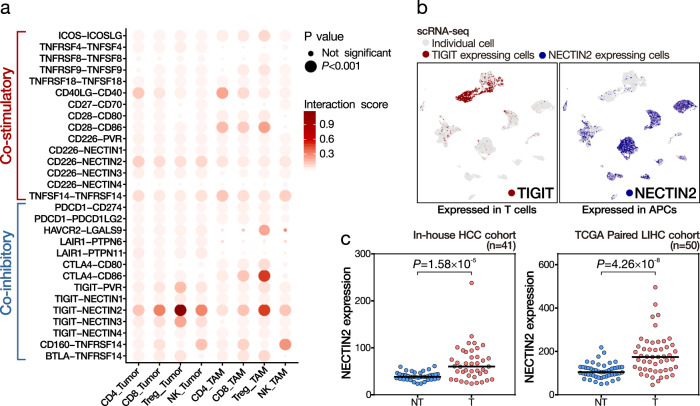
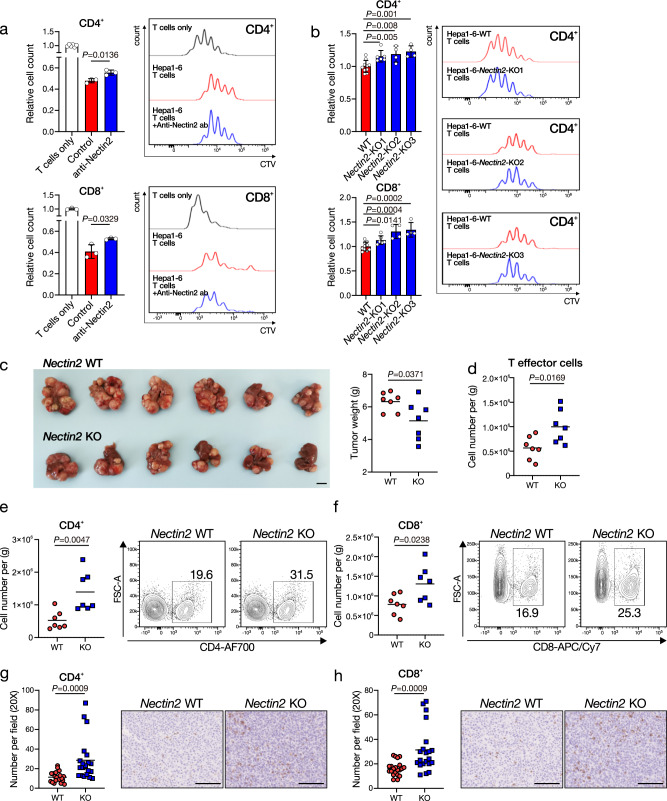
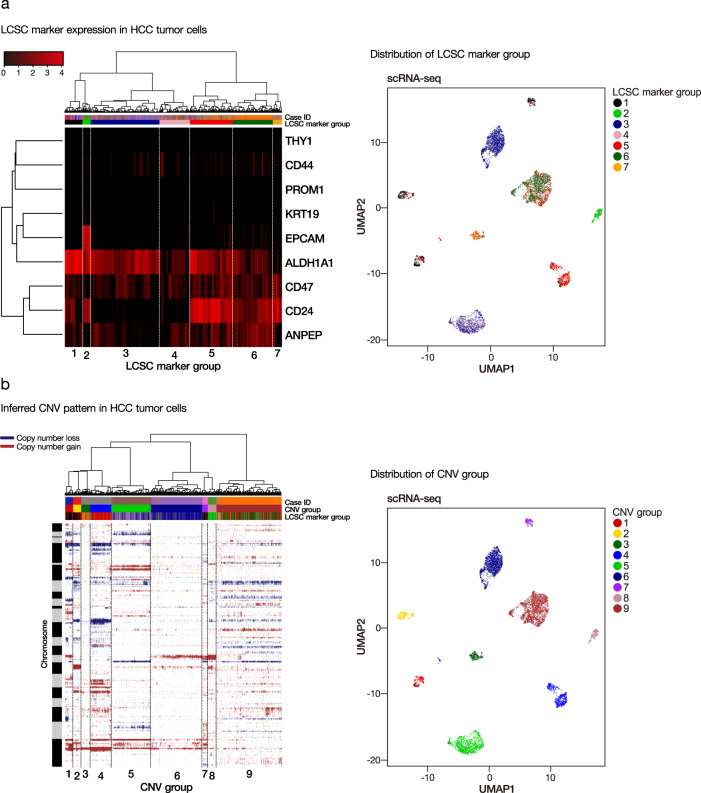
Interaction between tumor cells and immune cells in the tumor microenvironment is important in cancer development. Immune cells interact with the tumor cells to shape this process. Here, we use single-cell RNA sequencing analysis to delineate the immune landscape and tumor heterogeneity in a cohort of patients with HBV-associated human hepatocellular carcinoma (HCC). We found that tumor-associated macrophages suppress tumor T cell infiltration and TIGIT-NECTIN2 interaction regulates the immunosuppressive environment. The cell state transition of immune cells towards a more immunosuppressive and exhaustive status exemplifies the overall cancer-promoting immunocellular landscape. Furthermore, the heterogeneity of global molecular profiles reveals co-existence of intra-tumoral and inter-tumoral heterogeneity, but is more apparent in the latter. This analysis of the immunosuppressive landscape and intercellular interactions provides mechanistic information for the design of efficacious immune-oncology treatments in hepatocellular carcinoma.


Conflict of interest statement

The authors declare no competing interests.

Figures

Fig. 1
Fig. 1. scRNA-seq suggests inverse correlation between TAM and CD8 T cells.
a Workflow of the experiment. b Stratification and cell-type identification of HCC single cells. Malignant cells (labeled by the case identity) and non-malignant cells (labeled by cell types) were grouped into distinctive cell clusters. c Single cells from the 8 HCC cases were stratified into 34 cell clusters using a graph-based Louvain clustering algorithm on the KNN graph (resolution = 1.2). d Summary of different major cell types identified in HCC tumors. e Proportion of tumor-infiltrating macrophages was inversely correlated to the proportion of tumor-infiltrating T cells in scRNA-seq and deconvoluted bulk-cell RNA-seq datasets. Pearson correlation (two-sided). f Immunohistochemistry of CD8 T cells and CD163 M2 macrophages in two representative HCC cases of an independent cohort. Scale bar = 100 µm. More than ten fields each under ×40 and ×100 magnification were examined. Source data are provided as a Source Data file.
Fig. 2
Fig. 2. High expression of TAM markers in HCC tumors suggests poor prognosis.
a TAMs had enriched expression for multiple immunosuppressive markers. b TAM cell clusters expressing cancer-promoting M2 macrophage marker CD163 had concurrent enrichment for LAIR1 expression. c Expressions of CD163 and LAIR1 were significantly correlated in both in-house and TCGA datasets. Student’s t test (two-sided). d High expressions of LAIR1 and HAVCR2 were significant associated with poorer disease-free and overall survivals, respectively. Log-rank test (two-sided). e Overlap of the LAIR1 and M2 macrophages (CD163) using multicolor immunofluorescence staining in Case #713. Scale bar = 50 µm. More than ten fields each under ×40 and ×100 magnification were examined. Source data are provided as a Source Data file.
Fig. 3
Fig. 3. Pseudotime cell trajectory analysis on major immune cell types.
We correlated the cell trajectory analysis with the clustering result on various immune cell types. Representative markers indicate their overall transition to more immunosuppressive and exhausted status.
Fig. 4
Fig. 4. Immune checkpoint analysis in HCC implicates TIGIT–NECTIN2 interaction.
a We examined the immune checkpoint interactions between lymphocytes and APCs (tumor cells and TAMs) and identified the prominent interaction via the TIGITNECTIN2 axis (circle size indicates the statistical significance and circle color indicates the level of interaction). The empirical P value was estimated by 1000 imputations. b The expression of TIGIT and NECTIN2 was respectively enriched in T cells and APCs. c Upregulation of NECTIN2 was detected in HCC tumors, as compared to non-tumorous livers in both in-house and TCGA datasets. Student’s t test (2-sided). Source data are provided as a Source Data file.
Fig. 5
Fig. 5. NECTIN2 in HCC cells suppresses T cell activity.
a CellTrace Violet (CTV)-labeled mouse splenic T cells were isolated and co-cultured with Hepa1–6 cells in the presence or absence of anti-Nectin2 neutralizing antibody (15 µg/mL). Mean ± SD is presented. b CTV-labeled T cells were cocultured with Hepa1–6 (WT), -Nectin2-KO1, -Nectin2-KO2, -Nectin2-KO3 cells. Mean ± SD is presented. c Representative picture and weight of Nectin2 WT (Nectin2WT:Tp53KO:c-MycOE), and Nectin2 KO (Nectin2KO:Tp53KO:c-MycOE) HCC tumors. Scale bar = 1 cm. df Numbers of tumor-infiltrating lymphocytes were analyzed by flow cytometry. g, h Representative pictures, and quantification of CD4 + T cells and CD8 + T cells in HCC tumors by IHC staining. Scale bar = 100μm in IHC representative pictures. ah Student’s t test. The experiment was performed with a variable number of biologically independent samples (n number) (a n = 6, n = 3, and n = 3 for T cells only Ctrl and anti-Nectin2 respectively in CD4+ cells, and n = 3 for all groups in CD8+ cells; b n = 10, n = 6, n = 4, and n = 4 for WT, Nectin2-KO1, Nectin2-KO2, and Nectin2-KO3, respectively in both CD4+ and CD8+ cells; ce, g: n = 7 per group; f, h: n = 21 per group). Source data are provided as a Source Data file.
Fig. 6
Fig. 6. Tumor heterogeneity in terms of LCSC marker and inferred CNV status.
a We stratified the HCC tumor cells according to LCSC marker expression into different LCSC marker groups (left). The distribution of LCSC marker groups was displayed in the UMAP plot (right). b HCC tumor cells were also stratified according to inferred CNV patterns into different CNV groups (left). The distribution of CNV groups was displayed in the UMAP plot (right).

References

    1. Balkwill FR, Capasso M, Hagemann T. The tumor microenvironment at a glance. J. Cell Sci. 2012;125:5591–5596. doi: 10.1242/jcs.116392. - DOI - PubMed
    1. Shen M, Kang Y. Complex interplay between tumor microenvironment and cancer therapy. Front. Med. 2018;12:426–439. doi: 10.1007/s11684-018-0663-7. - DOI - PubMed
    1. Binnewies M, et al. Understanding the tumor immune microenvironment (TIME) for effective therapy. Nat. Med. 2018;24:541–550. doi: 10.1038/s41591-018-0014-x. - DOI - PMC - PubMed
    1. Suvà ML, Tirosh I. Single-cell RNA sequencing in cancer: lessons learned and emerging challenges. Mol. Cell. 2019;75:7–12. doi: 10.1016/j.molcel.2019.05.003. - DOI - PubMed
    1. Zhang Q, et al. Landscape and dynamics of single immune. Cells Hepatocell. Carcinoma Cell. 2019;179:829–-845.e20. - PubMed

Publication types

MeSH terms