. 2021 Jun 17;12(1):3709.
doi: 10.1038/s41467-021-24110-y.

Single-cell RNA-seq reveals fibroblast heterogeneity and increased mesenchymal fibroblasts in human fibrotic skin diseases

Affiliations

Single-cell RNA-seq reveals fibroblast heterogeneity and increased mesenchymal fibroblasts in human fibrotic skin diseases

Cheng-Cheng Deng et al. Nat Commun. .

Abstract

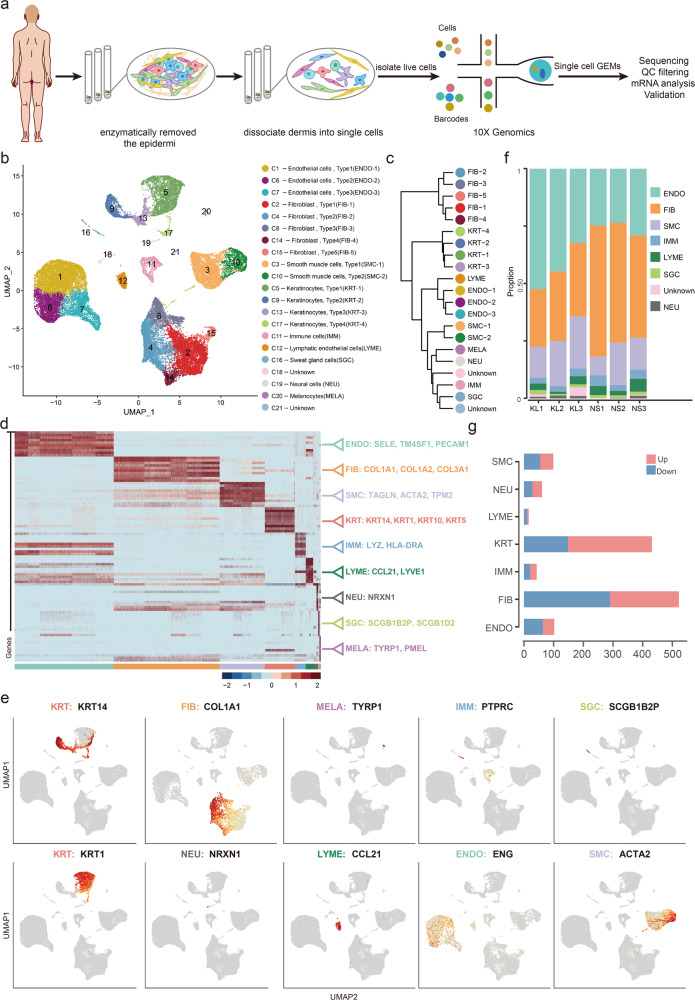
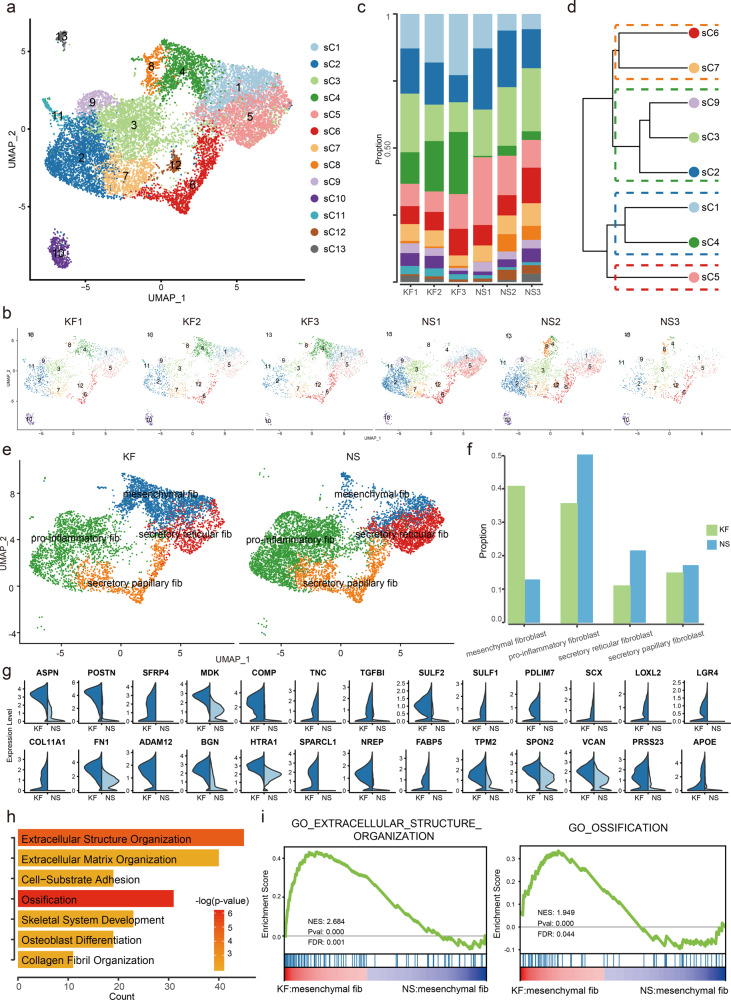
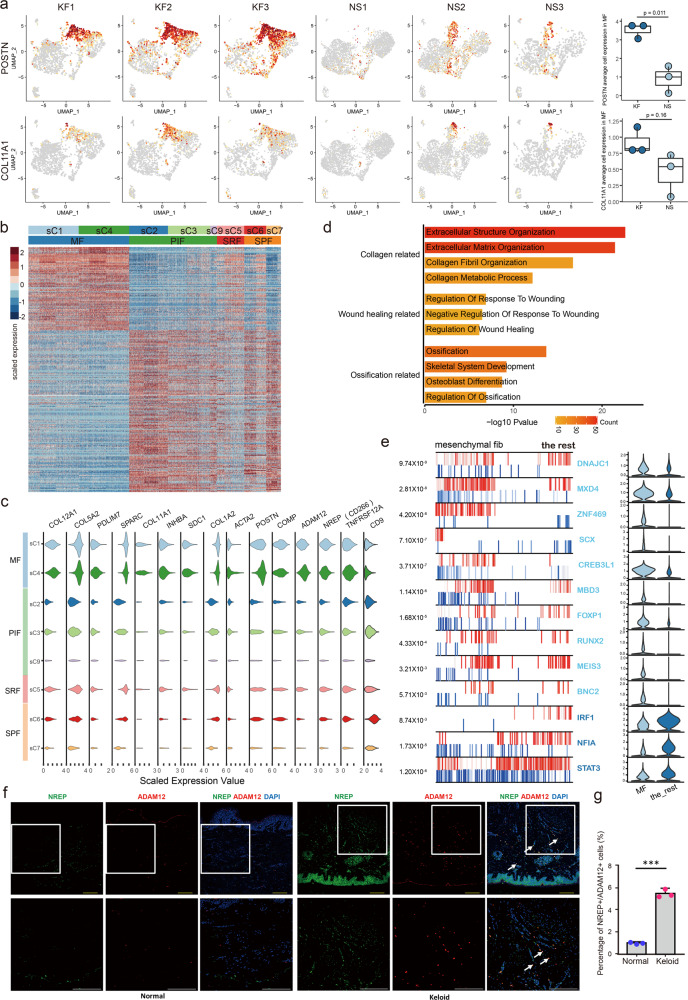
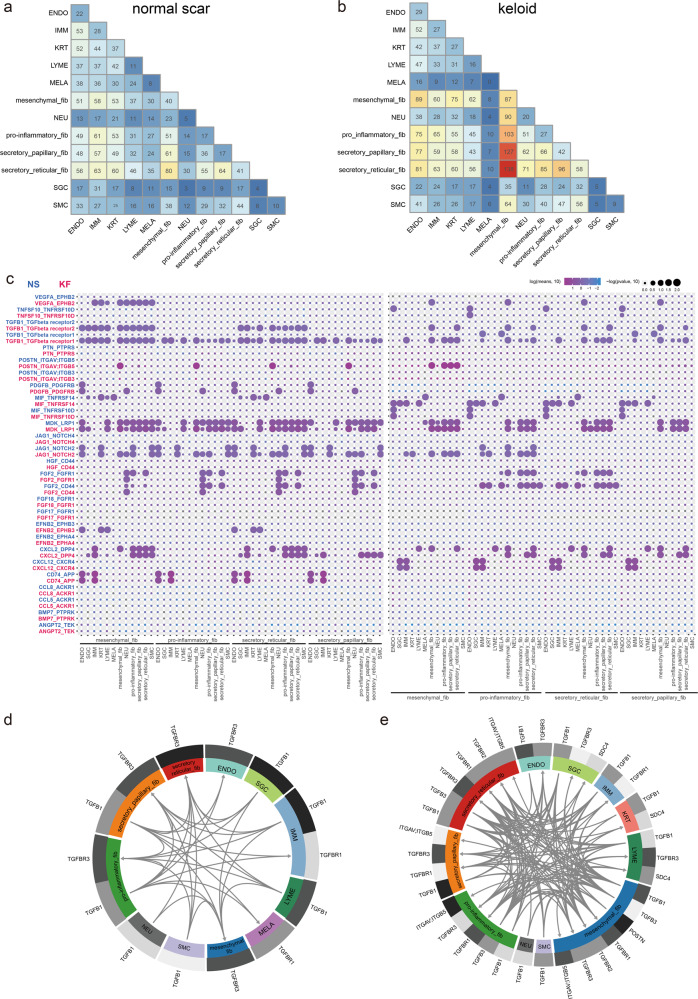
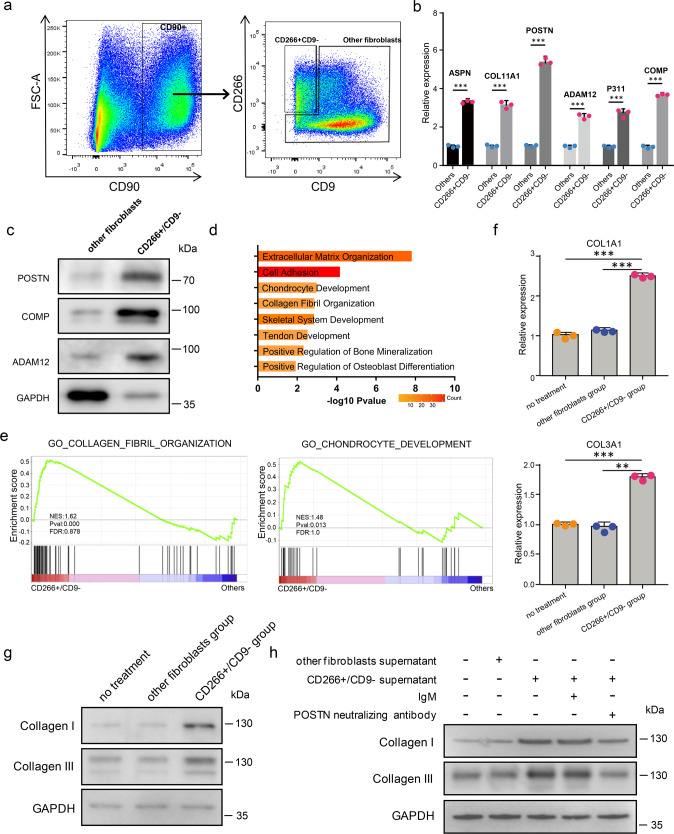
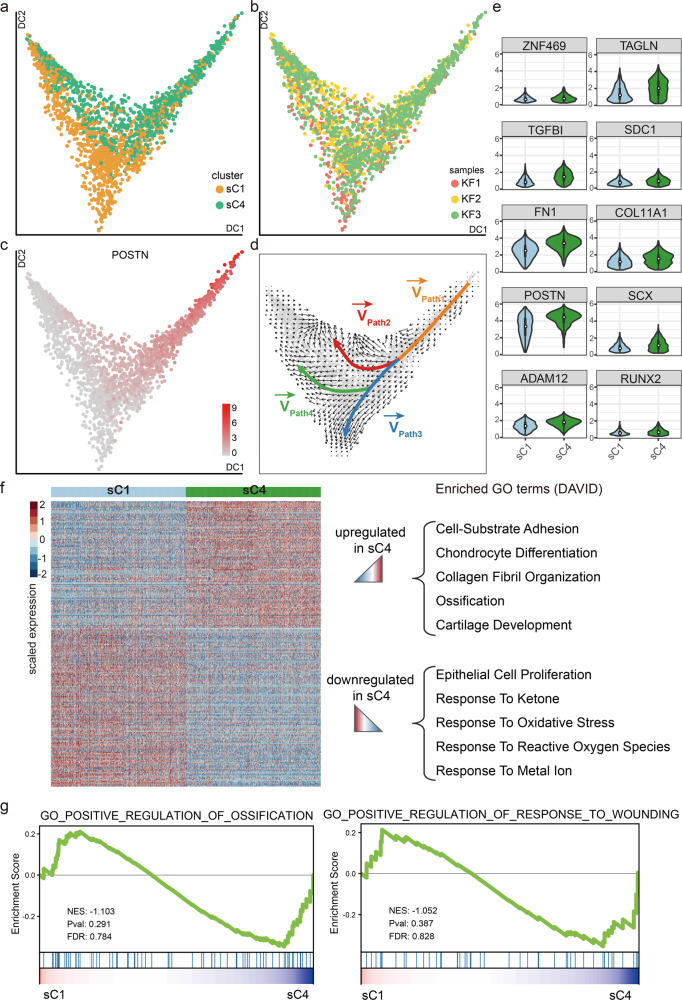
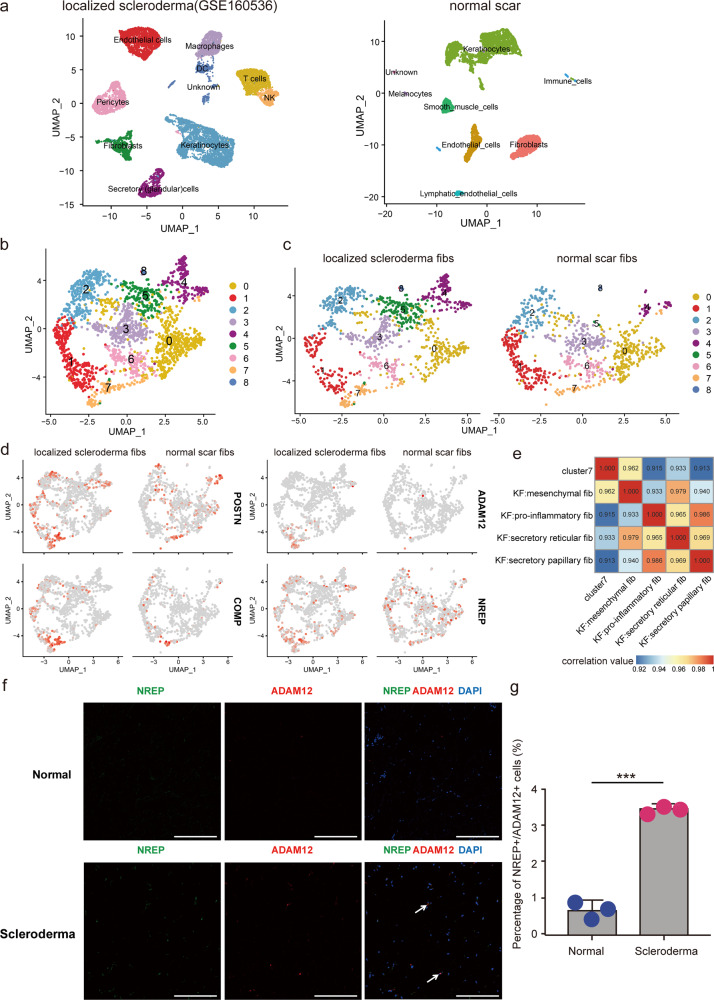
Fibrotic skin disease represents a major global healthcare burden, characterized by fibroblast hyperproliferation and excessive accumulation of extracellular matrix. Fibroblasts are found to be heterogeneous in multiple fibrotic diseases, but fibroblast heterogeneity in fibrotic skin diseases is not well characterized. In this study, we explore fibroblast heterogeneity in keloid, a paradigm of fibrotic skin diseases, by using single-cell RNA-seq. Our results indicate that keloid fibroblasts can be divided into 4 subpopulations: secretory-papillary, secretory-reticular, mesenchymal and pro-inflammatory. Interestingly, the percentage of mesenchymal fibroblast subpopulation is significantly increased in keloid compared to normal scar. Functional studies indicate that mesenchymal fibroblasts are crucial for collagen overexpression in keloid. Increased mesenchymal fibroblast subpopulation is also found in another fibrotic skin disease, scleroderma, suggesting this is a broad mechanism for skin fibrosis. These findings will help us better understand skin fibrotic pathogenesis, and provide potential targets for fibrotic disease therapies.


Conflict of interest statement

The authors declare no competing interests.

Figures

Fig. 1
Fig. 1. Single-cell RNA-seq reveals heterogeneity of normal scar and fibrotic skin disease dermis tissues.
a Illustration of workflow of scRNA-seq in human normal scar and fibrotic skin disease dermis samples. b Unbiased clustering of 40655 cells reveals 21 cellular clusters. Clusters are distinguished by different colors. The general identity of each cell cluster is shown on the right. c Unsupervised hierarchical clustering of average gene expression showing relatedness of cell clusters (correlation distance metric, average linkage). d Heatmap of differentially expressed genes. For each cluster, the top 10 genes and their relative expression levels in all sequenced cells are shown. Selected genes for each cluster are color-coded and shown on the right. e Feature plots of expression distribution for selected cluster-specific genes. Expression levels for each cell are color-coded and overlaid onto the UMAP plot. f The proportion of cell lineages in keloids (KL) and normal scars (NS). g Number of differentially expressed (DE) genes in each cell type with >100 cells available in keloid and normal scars (two-sided Wilcoxon Rank Sum test, Bonferroni correction, log fold change (FC) cutoff of 0.5, and adjusted P-value of <0.05). Red bars indicate upregulated genes, and blue bars indicate downregulated genes in keloid.
Fig. 2
Fig. 2. Keloid and normal scar fibroblasts subcluster into distinct cell populations.
a, b Subclustering of keloid and normal scar fibroblasts (cells from clusters C2, C4, C8, C14, and C15 shown in Fig. 1) further identified 13 distinct subtypes. Color-coded UMAP plot is shown and each fibroblast subcluster (sC1 through sC13) is defined on the right. KF: keloid fibroblasts, NS: normal scar fibroblasts. c Cell proportions of fibroblast subclusters in keloids and normal scars. Cells of sC4 were significantly increased in keloid samples compared to normal scar samples. d Unsupervised hierarchical clustering showing relatedness of fibroblast subclusters (Euclidean distance metric, average linkage). e Keloid and normal scar fibroblasts could be divided into 4 subpopulations: secretory-papillary, secretory-reticular, mesenchymal, and pro-inflammatory. f The proportions of 4 fibroblast subpopulations in keloid and normal scar. g Violin plots showing representative differentially expressed genes between keloid mesenchymal fibroblasts and normal scar mesenchymal fibroblasts. h GO Biological Process enrichment analysis of differentially expressed genes in mesenchymal fibroblasts between keloid and normal scars. i GSEA enrichment plots for representative signaling pathways upregulated in keloid mesenchymal fibroblasts compared to normal scars.
Fig. 3
Fig. 3. Characteristics of mesenchymal fibroblasts in fibrotic skin disease.
a Feature plots of the expression distribution for POSTN and COL11A1 in keloid fibroblasts (KF) and normal scar fibroblasts (NS). Expression levels for each cell are color-coded and overlaid onto the UMAP plot. The average cell expression of each gene in mesenchymal fibroblasts between KF and NS were shown in the right panel (Two-sided unpaired t-test). n = 3 biologically independent samples. In box plots, lines in the middle of boxes correspond to median values. Lower and upper hinges correspond to the first and third quartiles, and the upper whisker extends from the hinge to the largest value no further than 1.5 × IQR (inter-quartile range) from the hinge. The lower whisker extends from the hinge to the smallest value at most 1.5 × IQR of the hinge. b Heatmap of differentially expressed genes in each fibroblast subpopulations. MF: mesenchymal fibroblast, PIF: pro-inflammatory fibroblast, SRF: secretory-reticular fibroblast, SPF: secretory-papillary fibroblast. c Violin plots illustrating the expression of some marker genes in each fibroblast subpopulations. d Functional enrichment of upregulated genes in mesenchymal fibroblasts [Fisher exact-test, corrected for multiple comparisons using Benjamini and Hochberg method, adjusted P-value of <0.05]. e The top 13 candidate master regulators for mesenchymal fibroblasts identified by an algorithm for master regulator analysis algorithm (MARINa). Violin plots showing the relative expression levels of each master regulator in the right panel. f Immunofluorescence staining of NREP and ADAM12 in normal and keloid tissues. Lower panels are the insets of upper panels. Arrowheads indicate NREP+/ADAM12+ cells. Scale bar = 200 μm. g Percentage of NREP+/ADAM12+ cells in normal and keloid tissues. Data are presented as mean values ± SD (n = 5 images examined over 3 independent experiments). Two-sided unpaired t-test, ***P = 0.00013.
Fig. 4
Fig. 4. Potential ligand–receptor interactions analyses in fibroblast subpopulations.
a, b Heatmap showing the numbers of inter-populations communications with each other in normal scars (a) and in keloid tissues (b). c The ligand–receptor pairs exhibit significant changes in specificity between any one of the population and any one type of fibroblast in normal scars versus keloid. The left panel shows that one type of fibroblast expresses receptors and receives ligand signals from other populations. The right panel shows that one other population expresses receptors and receives ligand signals from one type of fibroblast. d, e Putative TGFβ and POSTN relative signaling within fibroblasts and other cell populations in normal scars (d) and in keloid tissues (e). All arrows are pointing to the receptors. Average expression levels for each ligand/receptor are presented as a heatmap plot. Black indicates maximum relative expression and white indicates low or no expression of a particular gene.
Fig. 5
Fig. 5. The supernatant of mesenchymal fibroblasts promotes collagen expression in keloid fibroblasts.
a Isolation of CD266+CD9 and other fibroblasts from keloid dermis by flow cytometry. b qRT-PCR assay of some mesenchymal fibroblast marker genes expression in CD266+/CD9 fibroblasts and other fibroblasts from keloid dermis. Data are presented as mean values ± SD (n = 3 biologically independent experiments.). Two-sided unpaired t-test, ***P < 0.001(ASPN:P = 0.00003, COL11A1:P = 0.00019, POSTN:P = 0.00004, ADAM12:P = 0.00015, P311:P = 0.00019, COMP:P = 0.00002). c Western blot assay of mesenchymal fibroblast marker genes expression in CD266+/CD9 fibroblasts and other fibroblasts from keloid dermis. The experiments were repeated three times with three different fibroblast donors, and here a representative result was shown. d GO Biological Process enrichment analysis of differentially expressed genes between keloid CD266+/CD9 fibroblasts and other fibroblasts. e GSEA enrichment plots for representative signaling pathways upregulated in keloid CD266+/CD9 fibroblasts compared to other fibroblasts. (NES normalized enrichment score, corrected for multiple comparisons using FDR method, P-value were showed in plots). f, g Keloid other fibroblasts were treated with the supernatant of CD266+/CD9 or other fibroblasts. The expression of collagen I and collagen III was analyzed by qRT-PCR (f) or western blot (g). Data are presented as mean values ± SD (n = 3 biologically independent experiments). Two-sided unpaired t-test, **P < 0.01, ***P < 0.001. (COL1A1: P = 0.000009 and P = 0.000015, respectively; COL3A1: P = 0.00006 and P = 0.00214, respectively). The experiments were repeated three times with three different fibroblast donors, and here a representative result was shown. h Keloid other fibroblasts were treated as indicated in the figure. The expression of collagen I and collagen III was analyzed by western blot. The POSTN antibody neutralizing experiments were repeated three times with three different fibroblast donors, and here a representative result was shown.
Fig. 6
Fig. 6. sC4 fibroblasts are more mesenchymal-like than sC1 fibroblasts.
a, b Results of diffusion-pseudotime analysis of keloid mesenchymal fibroblasts, colored by subcluster (a) and by keloid samples (b). c Diffusion map showing the expression levels of POSTN in keloid mesenchymal fibroblasts. Red indicates maximum relative expression, and gray indicates low or no expression of this gene. d RNA velocity analysis distinguished four sets of velocity vectors across the diffusion-pseudotime: Path1 (orange), Path2 (red), Path3 (blue), and Path4 (green). e The difference in the expression levels of mesenchymal fibroblasts population-specific genes (n = 1047 cells in keloid sC1 cluster, n = 1048 cells in keloid sC4 cluster). In embedded box plots, the white dot in the middle of boxes corresponds to median values. Lower and upper hinges correspond to the first and third quartiles, and the upper whisker extends from the hinge to the largest value no further than 1.5 × IQR (inter-quartile range) from the hinge. The lower whisker extends from the hinge to the smallest value at most 1.5 × IQR of the hinge. f Heatmap showing differentially expressed genes among the subclusters in mesenchymal fibroblasts, and functional annotations of those dysregulated genes are shown in the right panel. g GSEA enrichment plots for representative signaling pathways upregulated in the sC4 subcluster (NES normalized enrichment score, corrected for multiple comparisons using FDR method, P-value were showed in plots).
Fig. 7
Fig. 7. Mesenchymal fibroblasts are increased in scleroderma.
a UMAP visualization of dermal skin cell populations of patients with scleroderma (data from NCBI Gene Expression Omnibus (GSE160536)) in the left panel, and a normal scar (NS3) sample from our data is showed on the right. b Integration analysis of two sources of fibroblasts, one from scleroderma, and the other one from a normal scar. c Divided UMAP visualization of the integration results. d Feature plots of the expression distribution of mesenchymal signature genes in scleroderma and normal scar fibroblasts. e Correlation analysis of the average expression level of cluster 7 cells (scleroderma) and four types of fibroblasts from keloid samples. f Immunofluorescence staining of NREP and ADAM12 in normal and scleroderma tissues. Arrowheads indicate NREP+/ADAM12+ cells. Scale bar = 200 μm. g Percentage of NREP+/ADAM12+ cells in normal and scleroderma tissues. Data are presented as mean values ± SD (n = 5 images examined over 3 independent experiments). Two-sided unpaired t-test, ***P = 0.00013.

References

    1. Wynn TA, Ramalingam TR. Mechanisms of fibrosis: therapeutic translation for fibrotic disease. Nat. Med. 2012;18:1028–1040. doi: 10.1038/nm.2807. - DOI - PMC - PubMed
    1. Zhao X, Kwan JYY, Yip K, Liu PP, Liu FF. Targeting metabolic dysregulation for fibrosis therapy. Nat. Rev. Drug Discov. 2020;19:57–75. doi: 10.1038/s41573-019-0040-5. - DOI - PubMed
    1. Griffin, M. F., desJardins-Park, H. E., Mascharak, S., Borrelli, M. R. & Longaker, M. T. Understanding the impact of fibroblast heterogeneity on skin fibrosis. Dis. Models Mech.13, dmm044164 (2020). - PMC - PubMed
    1. Do NN, Eming SA. Skin fibrosis: Models and mechanisms. Curr. Res. Transl. Med. 2016;64:185–193. doi: 10.1016/j.retram.2016.06.003. - DOI - PubMed
    1. Bayat A, McGrouther DA, Ferguson MW. Skin scarring. BMJ. 2003;326:88–92. doi: 10.1136/bmj.326.7380.88. - DOI - PMC - PubMed

Publication types

MeSH terms