. 2021 Jun 17;11(1):12756.
doi: 10.1038/s41598-021-91798-9.

Cold and dry winter conditions are associated with greater SARS-CoV-2 transmission at regional level in western countries during the first epidemic wave

Affiliations

Cold and dry winter conditions are associated with greater SARS-CoV-2 transmission at regional level in western countries during the first epidemic wave

Jordi Landier et al. Sci Rep. .

Abstract

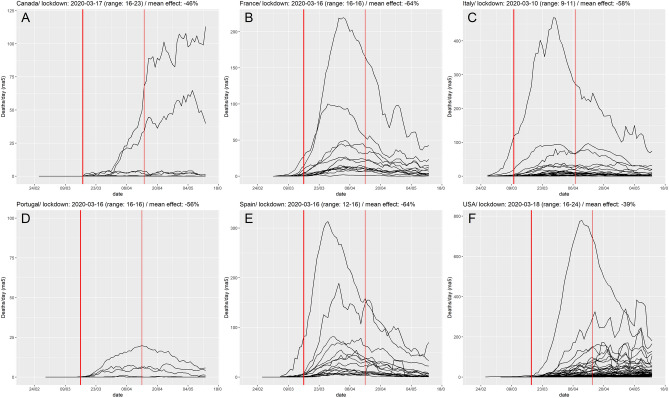
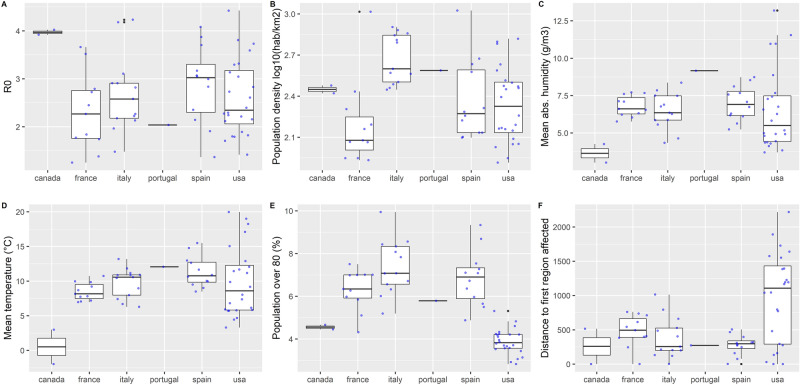
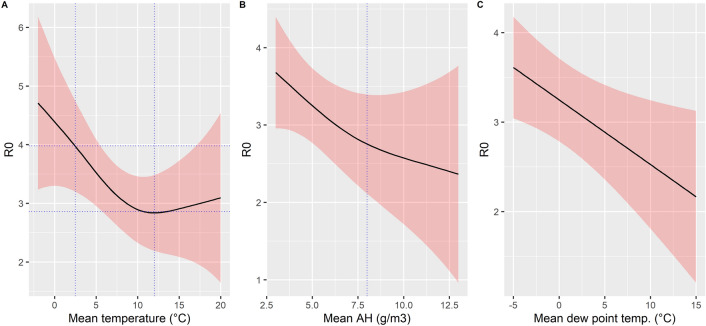
Higher transmissibility of SARS-CoV-2 in cold and dry weather conditions has been hypothesized since the onset of the COVID-19 pandemic but the level of epidemiological evidence remains low. During the first wave of the pandemic, Spain, Italy, France, Portugal, Canada and USA presented an early spread, a heavy COVID-19 burden, and low initial public health response until lockdowns. In a context when testing was limited, we calculated the basic reproduction number (R0) in 63 regions from the growth in regional death counts. After adjusting for population density, early spread of the epidemic, and age structure, temperature and humidity were negatively associated with SARS-CoV-2 transmissibility. A reduction of mean absolute humidity by 1 g/m3 was associated with a 0.15-unit increase of R0. Below 10 °C, a temperature reduction of 1 °C was associated with a 0.16-unit increase of R0. Our results confirm a dependency of SARS-CoV-2 transmissibility to weather conditions in the absence of control measures during the first wave. The transition from summer to winter, corresponding to drop in temperature associated with an overall decrease in absolute humidity, likely contributed to the intensification of the second wave in north-west hemisphere countries. Non-pharmaceutical interventions must be adjusted to account for increased transmissibility in winter conditions.


Conflict of interest statement

The authors declare no competing interests.

Figures

Figure 1
Figure 1
Study flow chart.
Figure 2
Figure 2
Deaths per day, by region and by country. The thick red line figures the median date of lockdown by each country, and the thin red line the median date + 28 days.
Figure 3
Figure 3
Map of regional values for R0 and selected covariates, panels are presented by continent. (A, B) R0, (C, D) population density (inhabitants per km2) and first region affected with 10 cumulative deaths, (D, E) mean temperature, (F, G) mean absolute humidity (AH). Map generated using ArcGIS v10.7.1 (ESRI, Redlands, CA).
Figure 4
Figure 4
Distribution of R0 and selected covariates by country. (A) R0, (B) population density (log10 inhabitants/km2). (C) Mean AH (g/m3). (D) Mean temperature (°C). (E) Population over 80 years old (%), (F) distance to the first region affected (km). The box represents the interquartile range and the median; whiskers correspond to the minimum between highest value and 1.5 IQR; black dots to outliers. All observations are ploted in light grey.
Figure 5
Figure 5
Change in R0 on an additive scale estimated from the univariable model assuming a linear relationship between R0 and the different variables over their entire range.
Figure 6
Figure 6
Non-linear effects for weather parameters obtained in the multivariable model for R0 analysis (see Table 1 for linear effects). (A) Temperature, model 1. (B) Distance to first region affected, model 1. (C) AH, model 2. (D) Distance to first region affected, model 2. (E) DP, model 3. (F) Distance to first region affected, model 3.
Figure 7
Figure 7
Summary of estimated effect of temperature (A), AH (B) or DP (C) on R0 assuming a region with average population density (248 persons/km2) and percentage of inhabitants > 80 years (5.6%), and corresponding to the first region first affected (distance = 0 km).

References

    1. Jefferies S, French N, Gilkison C, Graham G, Hope V, Marshall J, et al. COVID-19 in New Zealand and the impact of the national response: A descriptive epidemiological study. Lancet Public Heal. 2020;5:e612–e623. doi: 10.1016/S2468-2667(20)30225-5. - DOI - PMC - PubMed
    1. Dighe A, Cattarino L, Cuomo-Dannenburg G, Skarp J, Imai N, Bhatia S, et al. Response to COVID-19 in South Korea and implications for lifting stringent interventions. BMC Med. 2020;18:1–12. doi: 10.1186/s12916-020-01791-8. - DOI - PMC - PubMed
    1. Pollán M, Pérez-Gómez B, Pastor-Barriuso R, Oteo J, Hernán MA, Pérez-Olmeda M, et al. Prevalence of SARS-CoV-2 in Spain (ENE-COVID): A nationwide, population-based seroepidemiological study. Lancet. 2020;396:535–544. doi: 10.1016/S0140-6736(20)31483-5. - DOI - PMC - PubMed
    1. Lai C, Wang J, Hsueh P. Population-based seroprevalence surveys of anti-SARS-CoV-2 antibody: An up-to-date review. Int. J. Infect. Dis. 2020;101:314–322. doi: 10.1016/j.ijid.2020.10.011. - DOI - PMC - PubMed
    1. Dietz K. The estimation of the basic reproduction number for infectious diseases. Stat. Methods Med. Res. 1993;2:23–41. doi: 10.1177/096228029300200103. - DOI - PubMed