. 2021 Jun 17;11(1):12814.
doi: 10.1038/s41598-021-92256-2.

Global land cover trajectories and transitions

Affiliations

Global land cover trajectories and transitions

Taher M Radwan et al. Sci Rep. .

Abstract

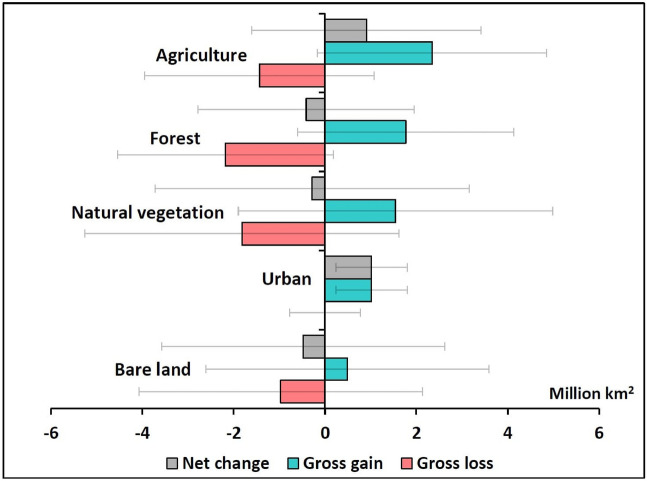
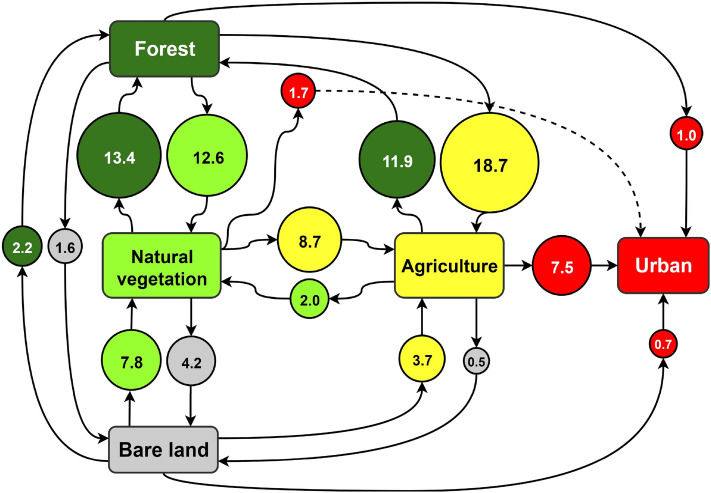
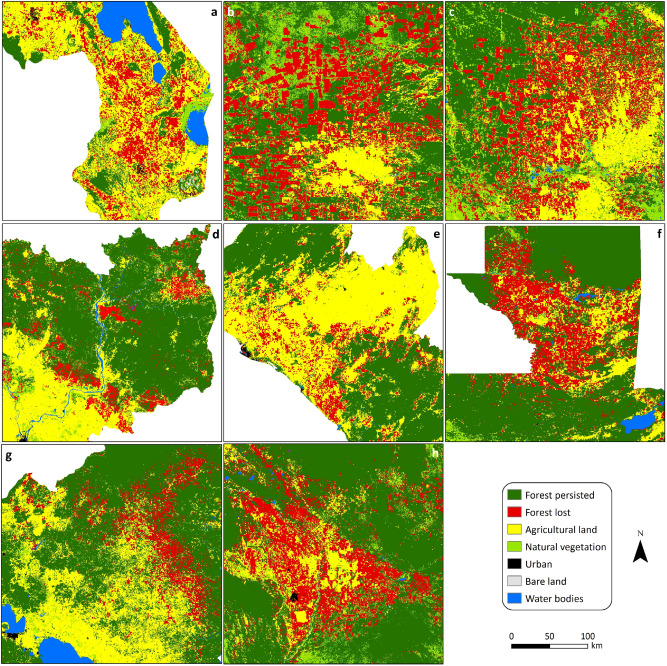
Global land cover (LC) changes threaten sustainability and yet we lack a comprehensive understanding of the gains and losses of LC types, including the magnitudes, locations and timings of transitions. We used a novel, fine-resolution and temporally consistent satellite-derived dataset covering the entire Earth annually from 1992 to 2018 to quantify LC changes across a range of scales. At global and continental scales, the observed trajectories of change for most LC types were fairly smooth and consistent in direction through time. We show these observed trajectories in the context of error margins produced by extrapolating previously published accuracy metrics associated with the LC dataset. For many LC classes the observed changes were found to be within the error margins. However, an important exception was the increase in urban land, which was consistently larger than the error margins, and for which the LC transition was unidirectional. An advantage of analysing the global, fine spatial resolution LC time-series dataset is the ability to identify where and when LC changes have taken place on the Earth. We present LC change maps and trajectories that identify locations with high dynamism, and which pose significant sustainability challenges. We focused on forest loss and urban growth at the national scale, identifying the top 10 countries with the largest percentages of forest loss and urban growth globally. Crucially, we found that most of these 'worst-case' countries have stabilized their forest losses, although urban expansion was monotonic in all cases. These findings provide crucial information to support progress towards the UN's SDGs.


Conflict of interest statement

The authors declare no competing interests.

Figures

Figure 1
Figure 1
Total area of gains and losses of the different LC types across the globe between 1992 and 2018. Error bars represent the margin of error at the 95% confidence interval.
Figure 2
Figure 2
Total area of gains and losses of the different LC types in each continent between 1992 and 2018. Error bars represent the margin of error at the 95% confidence interval.
Figure 3
Figure 3
Spatial distribution of LC changes between 1992 and 2018. (a) agricultural land and (b) forest cover. The original data were aggregated to a 3 km spatial resolution for visualisation. Black areas are terrestrial zones where the LC type was absent in both 1992 and 2018. ArcGIS Desktop 10.5 (https://desktop.arcgis.com/en/) was used to generate this map.
Figure 4
Figure 4
Time-series of the cumulative net change in total global area of each LC type between 1992 and 2018. The colours of the lines representing each LC type are consistent with Figs. 6 and 10. The dashed lines represent the upper and lower bounds of error at the 95% confidence interval.
Figure 5
Figure 5
Time-series of the area of each LC type in each continent between 1992 and 2018, expressed as a percentage of the initial area of each LC type. To avoid over-complicating the figure, error bars are provided for the continent showing greatest change in each plot, as an example, representing the margin of error at the 95% confidence interval. Note that in these percentage change plots, for each LC type, the error margin is the same as the example shown, for all other continents.
Figure 6
Figure 6
Schematic representation of global LC transitions between 1992 and 2018. The transitions are expressed in percentage terms relative to the total global LC area that changed over this period. Note that the sum of the percentages equals 98.2% as the minor LC transitions involving water bodies were not included. For visualisation purposes, the size of each circle is proportional to the magnitude of the LC transition it represents and exact figures are provided within the circle.
Figure 7
Figure 7
Historical trajectories between 1992 and 2018 for the top 10 global countries in (a) forest, (b) agriculture and (c) urban. Values are expressed as a percentage of the initial area of each LC type. To avoid over-complicating the figure, error bars are provided for the top and bottom lines in each plot, as examples, representing the margin of error at the 95% confidence interval. Note that in these percentage change plots, for each LC type, the error margin is the same for all countries.
Figure 8
Figure 8
Spatial distribution of forest cover in selected countries with the highest percentages of forest loss between 1992 and 2018: (a) Southern Malawi, (b) North-western Paraguay, (c) Northern Argentina, (d) North-eastern Cambodia, (e) Central Liberia, (f) Northern Guatemala, (g) Central Nicaragua, (h) Central Bolivia. Note that a consistent map scale has been adopted across all countries. ArcGIS Desktop 10.5 (https://desktop.arcgis.com/en/) was used to generate this figure.
Figure 9
Figure 9
Spatial distribution of urban land in selected major urban cities within eight of the 10 countries with the largest percentages of urban expansion between 1992 and 2018: (a) Lahore, Pakistan (b) Tashkent, Uzbekistan (c) Shanghai, China (d) Ho Chi Minh, Vietnam (e) New Delhi, India (f) Bangkok, Thailand (g) Greater Cairo, Egypt (h) Lagos, Nigeria. Note that a consistent map scale has been adopted across all countries. ArcGIS Desktop 10.5 (https://desktop.arcgis.com/en/) was used to generate this figure.
Figure 10
Figure 10
Global distribution of LC types in 2018. ArcGIS Desktop 10.5 (https://desktop.arcgis.com/en/) was used to generate this figure.

References

    1. Rindfuss RR, Walsh SJ, Turner BL, Fox J, Mishra V. Developing a science of land change: Challenges and methodological issues. Proc. Natl. Acad. Sci. U. S. A. 2004;101:13976–13981. doi: 10.1073/pnas.0401545101. - DOI - PMC - PubMed
    1. Verburg PH, Neumann K, Nol L. Challenges in using land use and land cover data for global change studies. Glob. Change Biol. 2011;17:974–989. doi: 10.1111/j.1365-2486.2010.02307.x. - DOI
    1. Liu X, et al. High-spatiotemporal-resolution mapping of global urban change from 1985 to 2015. Nat. Sustain. 2020 doi: 10.1038/s41893-020-0521-x. - DOI
    1. Radwan TM, Blackburn GA, Whyatt JD, Atkinson PM. Dramatic loss of agricultural land due to urban expansion threatens food security in the Nile Delta, Egypt. Remote Sens. 2019;11:332. doi: 10.3390/rs11030332. - DOI
    1. Radwan TM. Monitoring agricultural expansion in a newly reclaimed area in the western nile delta of Egypt using landsat imageries. Agriculture. 2019;9:137. doi: 10.3390/agriculture9070137. - DOI

Publication types