. 2021 Jun 17;11(1):12758.
doi: 10.1038/s41598-021-92215-x.

Expression of a maize SOC1 gene enhances soybean yield potential through modulating plant growth and flowering

Affiliations

Expression of a maize SOC1 gene enhances soybean yield potential through modulating plant growth and flowering

Xue Han et al. Sci Rep. .

Abstract

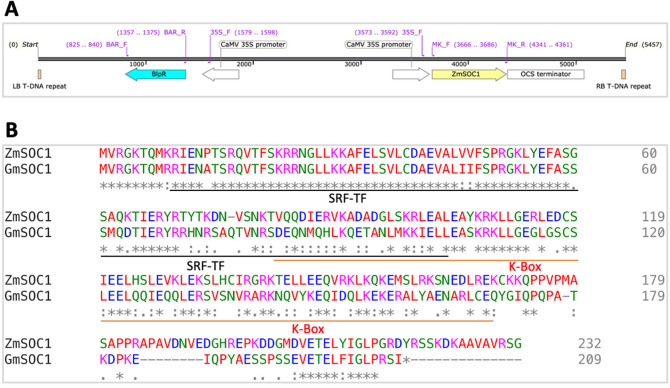
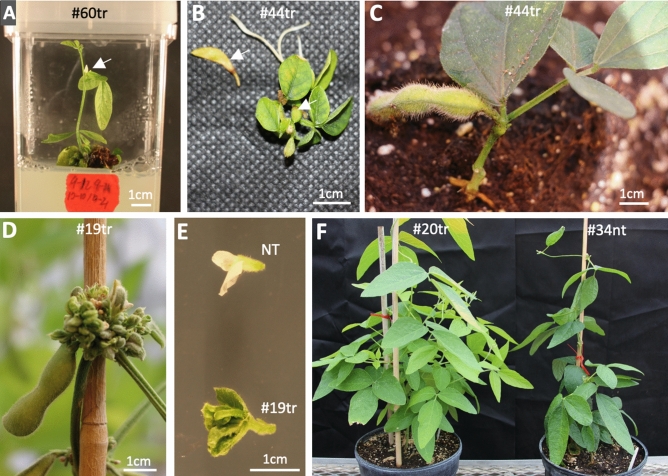
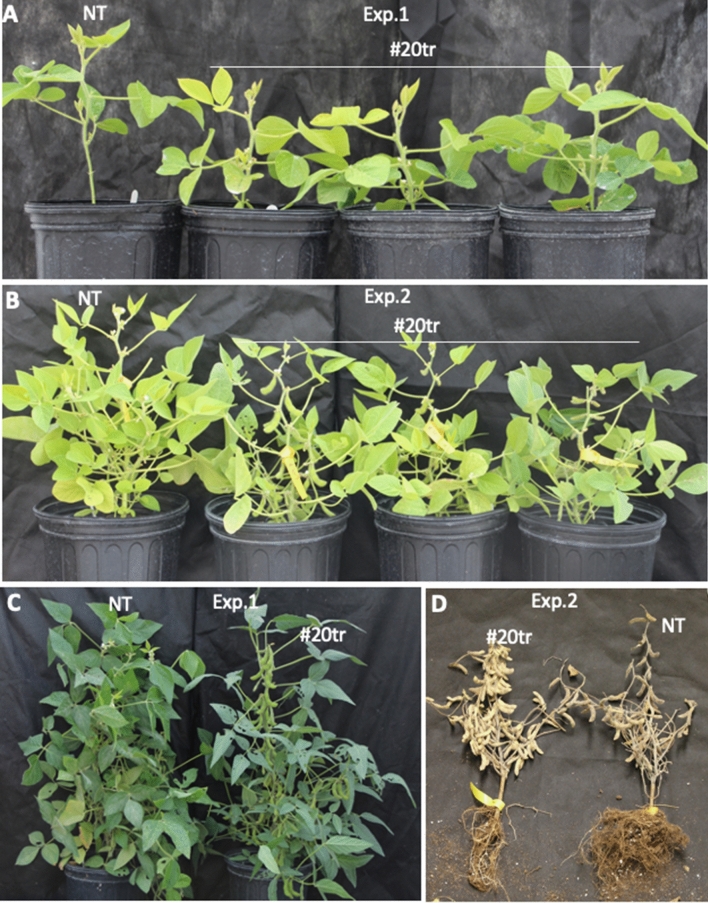
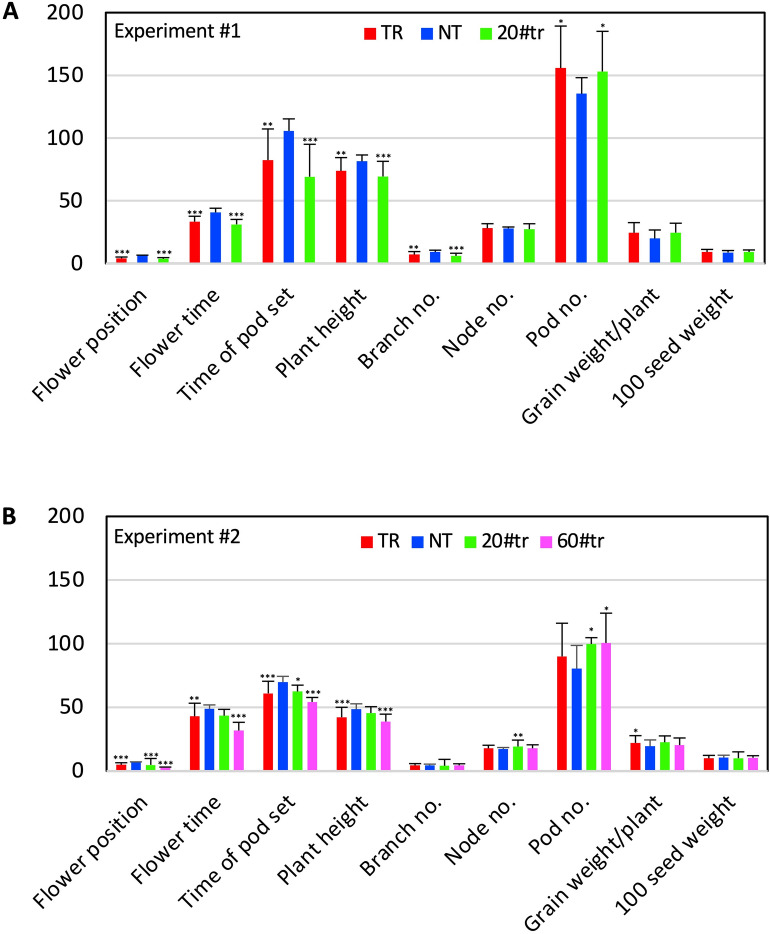
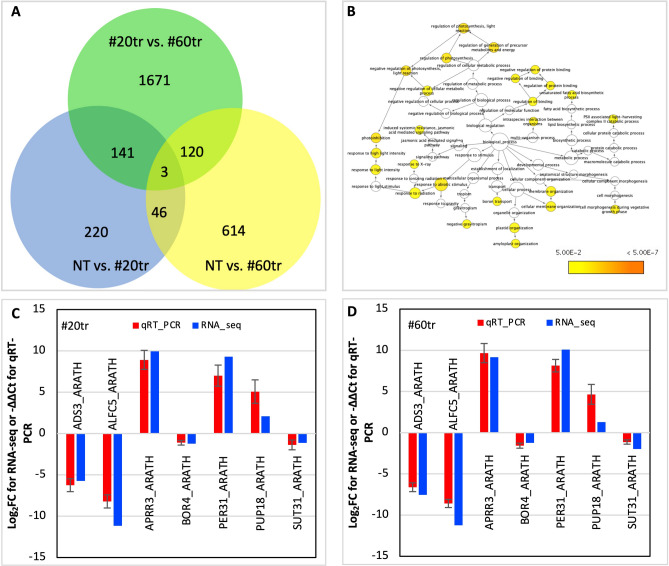
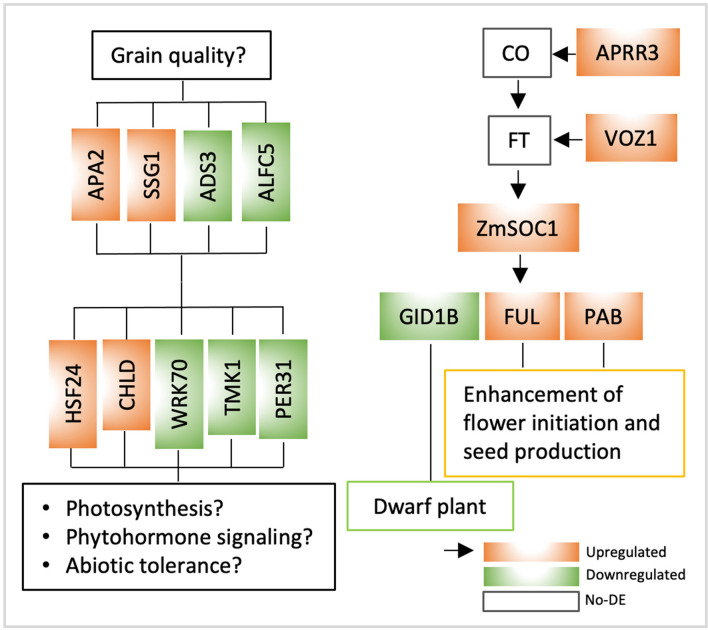
Yield enhancement is a top priority for soybean (Glycine max Merr.) breeding. SUPPRESSOR OF OVEREXPRESSION OF CONSTANS 1 (SOC1) is a major integrator in flowering pathway, and it is anticipated to be capable of regulating soybean reproductive stages through its interactions with other MADS-box genes. Thus, we produced transgenic soybean for a constitutive expression of a maize SOC1 (ZmSOC1). T1 transgenic plants, in comparison with the nontransgenic plants, showed early flowering, reduced height of mature plants, and no significant impact on grain quality. The transgenic plants also had a 13.5-23.2% of higher grain weight per plant than the nontransgenic plants in two experiments. Transcriptome analysis in the leaves of 34-day old plants revealed 58 differentially expressed genes (DEGs) responding to the expression of the ZmSOC1, of which the upregulated FRUITFULL MADS-box gene, as well as the transcription factor VASCULAR PLANT ONE-ZINC FINGER1, contributed to the promoted flowering. The downregulated gibberellin receptor GID1B could play a major role in reducing the plant height. The remaining DEGs suggested broader effects on the other unmeasured traits (e.g., photosynthesis efficiency and abiotic tolerance), which could contribute to yield increase. Overall, modulating expression of SOC1 in soybean provides a novel and promising approach to regulate plant growth and reproductive development and thus has a potential either to enhance grain yield or to change plant adaptability.


Conflict of interest statement

The authors declare no competing interests.

Figures

Figure 1
Figure 1
(A) Diagram of the T-DNA region of the pTF101.1-ZmSOC1 vector. The primer positions are included in the diagram. LB left border, RB right border. (B) Protein sequence alignment of the ZmSOC1 and soybean’s GmSOC1 (iTAK: Glyma.18G224500.2_CDS). The protein sequence of the cloned ZmSOC1 is identical to that derived from either the HQ858775.1 or a part of the NM_001111682.1. GmSOC1 is the same as the sequence detected in the soybean transcriptome reference (cultivar Jack) (DN17539_c0_g1).
Figure 2
Figure 2
Phenotypic variations of T0 transgenic ZmSOC1-OX (TR) and nontransgenic (NT) soybean plants cv. Jack grown under in vitro and greenhouse conditions. (A) Flowering of a TR line #60tr growing on the elongation medium. (B) Seed pod production from a TR line #34tr growing on the rooting medium. (C) The #34tr plant showed dwarfing, no branches, and produced a seed pod in 27 days after transferred to soil. (D,E) A representative TR line (#19tr) showing abnormal flowers. (F) A TR line #20tr produced more branches than a NT line #34nt. Arrows show flowers or seed pods.
Figure 3
Figure 3
Growth of nontransgenic (NT) and transgenic soybean plants from a representative, T1 transgenic (TR) line expressing the ZmSOC1. All the plants were grown under natural environmental conditions. (A) Flowering of the 35-day old plants in the experiment #1. (B) Pod formation in the 67-day old plants in the experiment #2. (C) Seed pod production in the 134-day old plants in the experiment #1. (D) Seed pod production in the harvested plants in the experiment #2.
Figure 4
Figure 4
Phenotypic changes in T1 transgenic (TR) soybean plants expressing the ZmSOC1 in the two experiments, where the seeds were sowed on May 4th in the experiment #1 and June 4th in the experiment #2, respectively. #20tr and #60tr are two independent TR lines. Y-axis showed mean value and STDEV of 16 nontransgenic (NT), 52 TR, and 16 #20tr plants in the experiment #1 (A) and 32 NT, 44 TR, 11 #20tr, and 7 #60tr lines in the experiment #2 (B). Flower position: The node number where the first flower appeared. Flowering time: Days when the first flowered appeared after the seeds were sowed. Time of pod set: Days when the first pod was set after the seeds were sowed. Plant height (cm): The height of the mature plant. Branch no., Node no., and Pod no.: The numbers for each mature plant were counted. Grain weight/plant (g): Weight of dry seed. 100 seed weight (g): 100 seed weight for each plant. For each of the nine traits, statistical analysis was conducted between NT and TR (or any of the individual TR line) separately. Significance codes: ***P < 0.001, **P < 0.01, *P < 0.05.
Figure 5
Figure 5
Transcriptome analysis in leaves among T1 nontransgenic (NT) and two soybean transgenic lines of #20tr and #60tr. (A) Venn diagram illustrating overlap of the three transcriptomic comparisons of the annotated, differentially expressed transcripts (DETs). (B) Gene networks of differentially expressed genes shared in leaf tissues of transgenic lines of #20tr and #60tr. The ontology file of GO_full in BiNGO was used to identify overrepresented GO terms (p < 0.05). Bubble size and color indicate the frequency of the GO term and the P-value, respectively. (C,D) Comparison of the RT-qPCR analysis result and the RNA-seq data of the selected DETs. − ∆∆Ct is an average of three biological and three technical replicates for each DET. GmActin 1 (SAC1_ARATH) was used to normalize the RT-qPCR results.
Figure 6
Figure 6
Potential effects of the expression of the ZmSOC1 on soybean plant growth and development revealed by the shared differential expressed genes (DEGs) identified in leaves of two transgenic lines (i.e., #20tr and #60tr) (Table 2).

References

    1. Pastor AV, et al. The global nexus of food-trade-water sustaining environmental flows by 2050. Nat. Sustain. 2019;2:499–507. doi: 10.1038/s41893-019-0287-1. - DOI
    1. Bhattarai MD, Secchi S, Schoof J. Projecting corn and soybeans yields under climate change in a Corn Belt watershed. Agric. Syst. 2017;152:90–99. doi: 10.1016/j.agsy.2016.12.013. - DOI
    1. Ray DK, et al. Climate change has likely already affected global food production. PLoS One. 2019;14:e0217148. doi: 10.1371/journal.pone.0217148. - DOI - PMC - PubMed
    1. Pareek A, Dhankher OP, Foyer CH. Mitigating the impact of climate change on plant productivity and ecosystem sustainability. J. Exp. Bot. 2020;71:451–456. doi: 10.1093/jxb/erz518. - DOI - PMC - PubMed
    1. Koester RP, Skoneczka JA, Cary TR, Diers BW, Ainsworth EA. Historical gains in soybean (Glycinemax Merr.) seed yield are driven by linear increases in light interception, energy conversion, and partitioning efficiencies. J. Exp. Bot. 2014;65:3311–3321. doi: 10.1093/jxb/eru187. - DOI - PMC - PubMed

Publication types