. 2021 Sep;16(9):1019-1029.
doi: 10.1038/s41565-021-00926-z. Epub 2021 Jun 17.

Viscoelastic surface electrode arrays to interface with viscoelastic tissues

Affiliations

Viscoelastic surface electrode arrays to interface with viscoelastic tissues

Christina M Tringides et al. Nat Nanotechnol. 2021 Sep.

Abstract

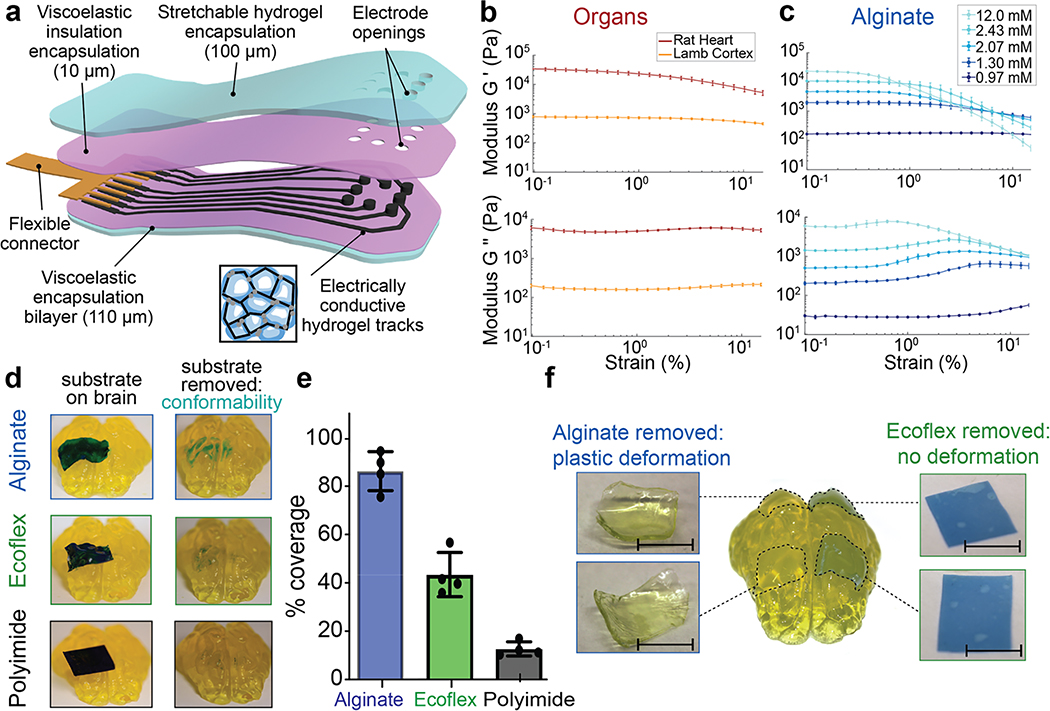
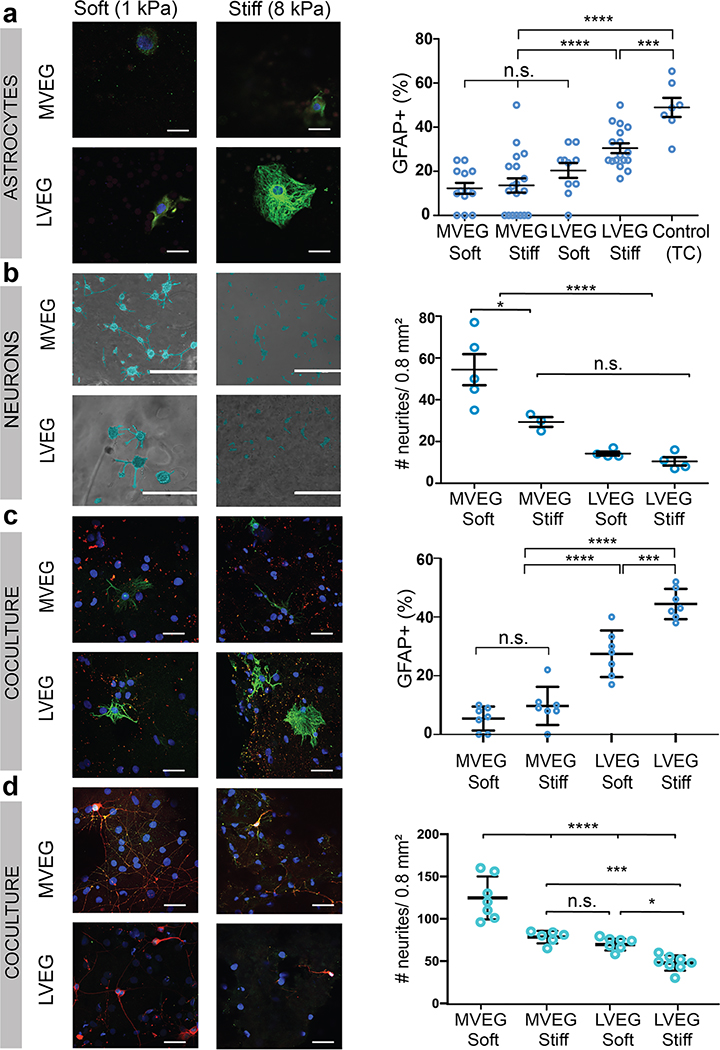
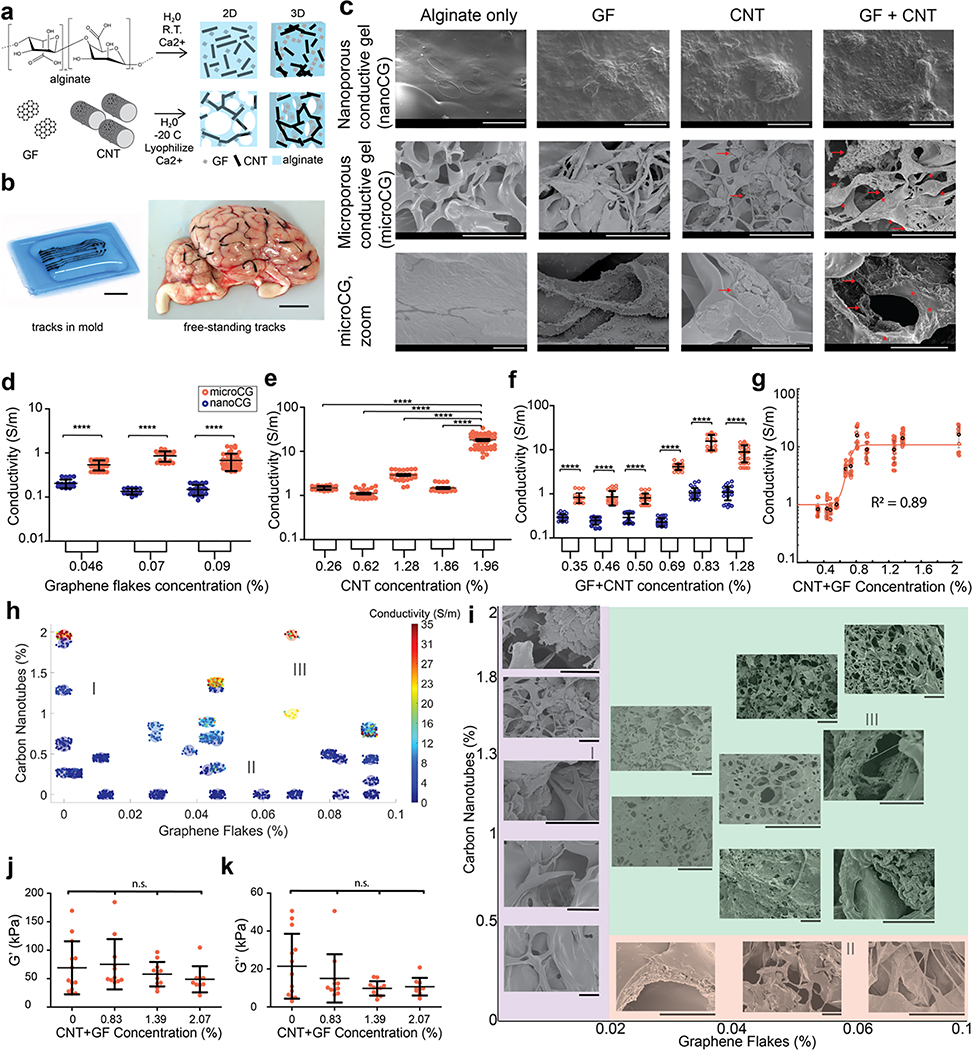
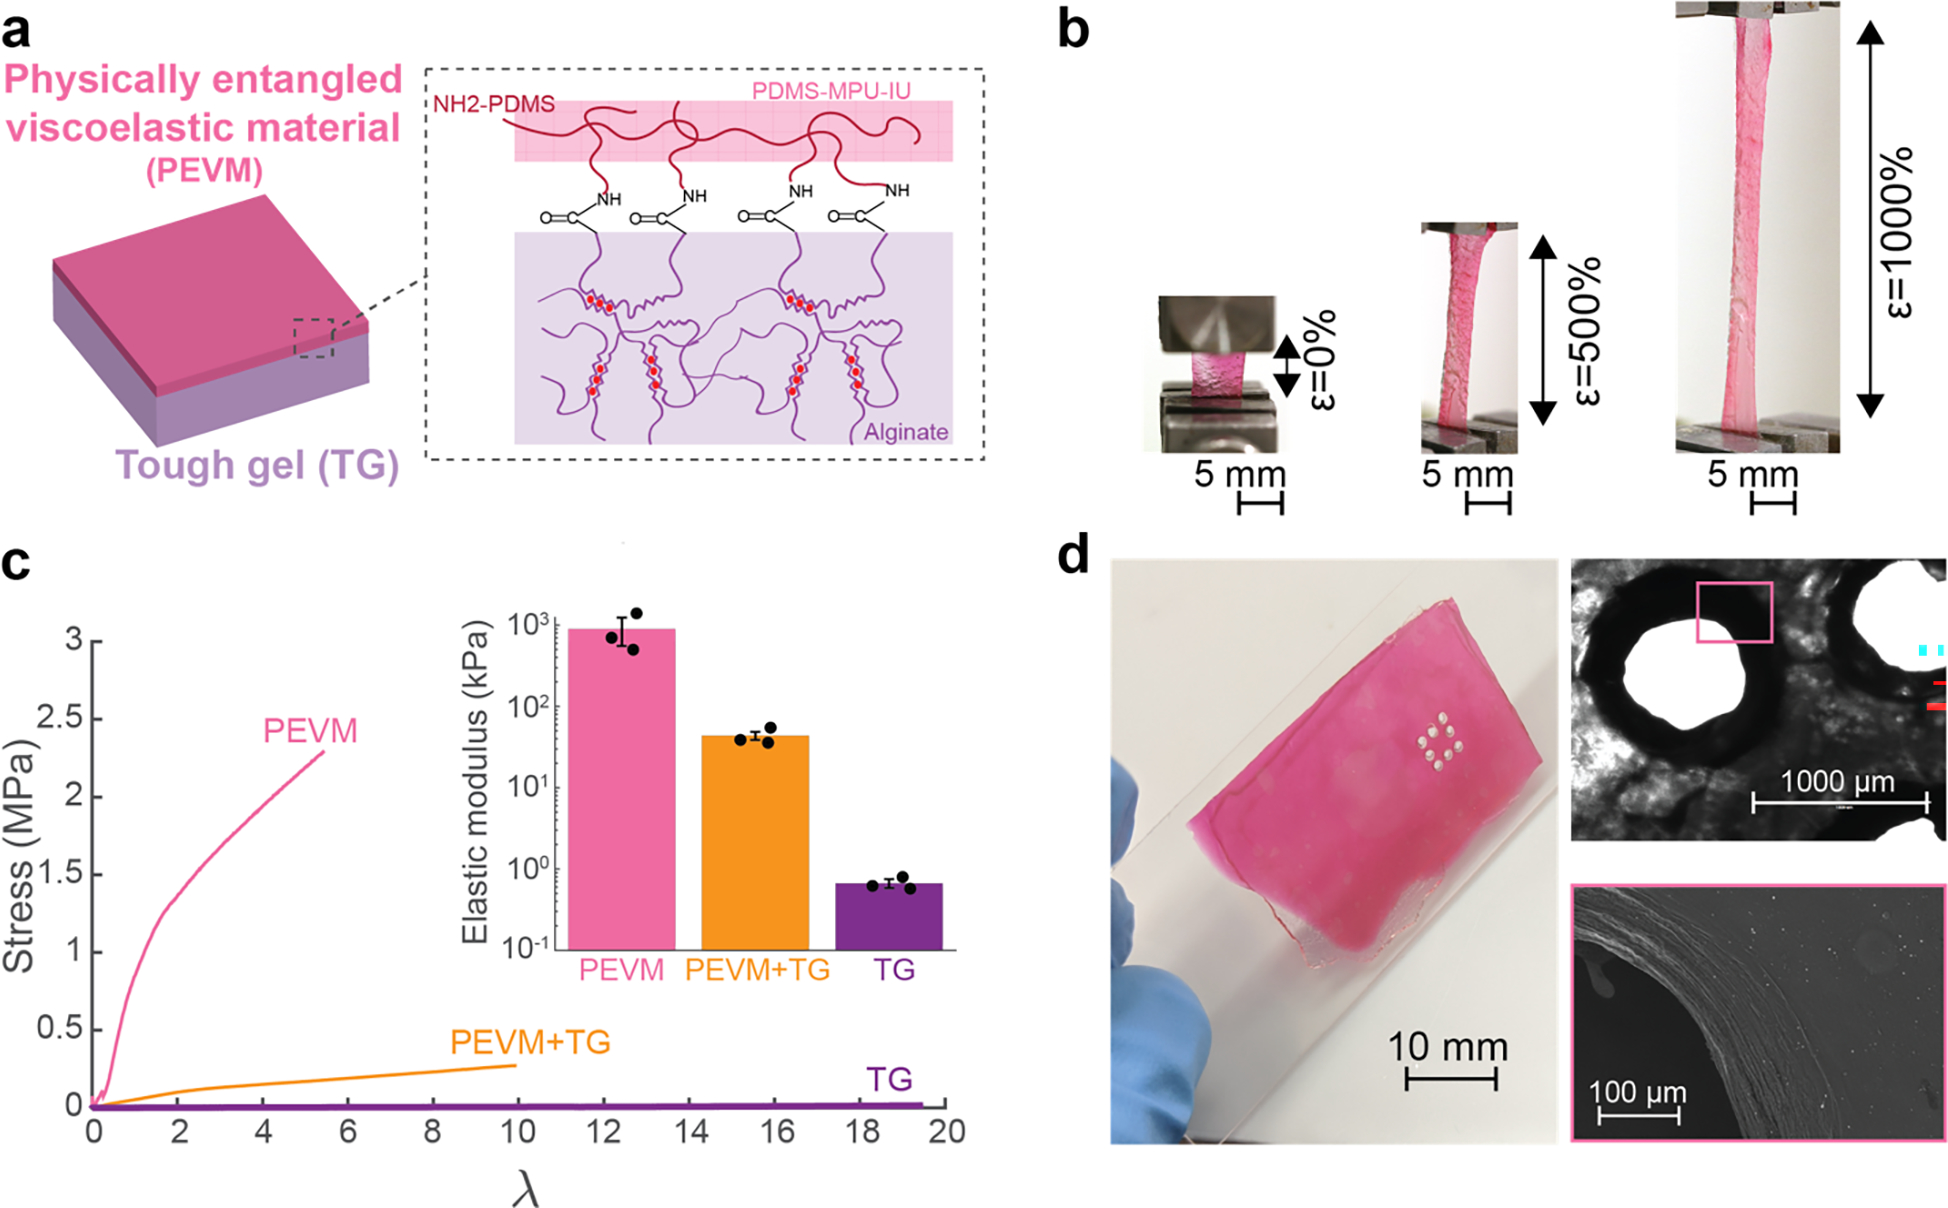
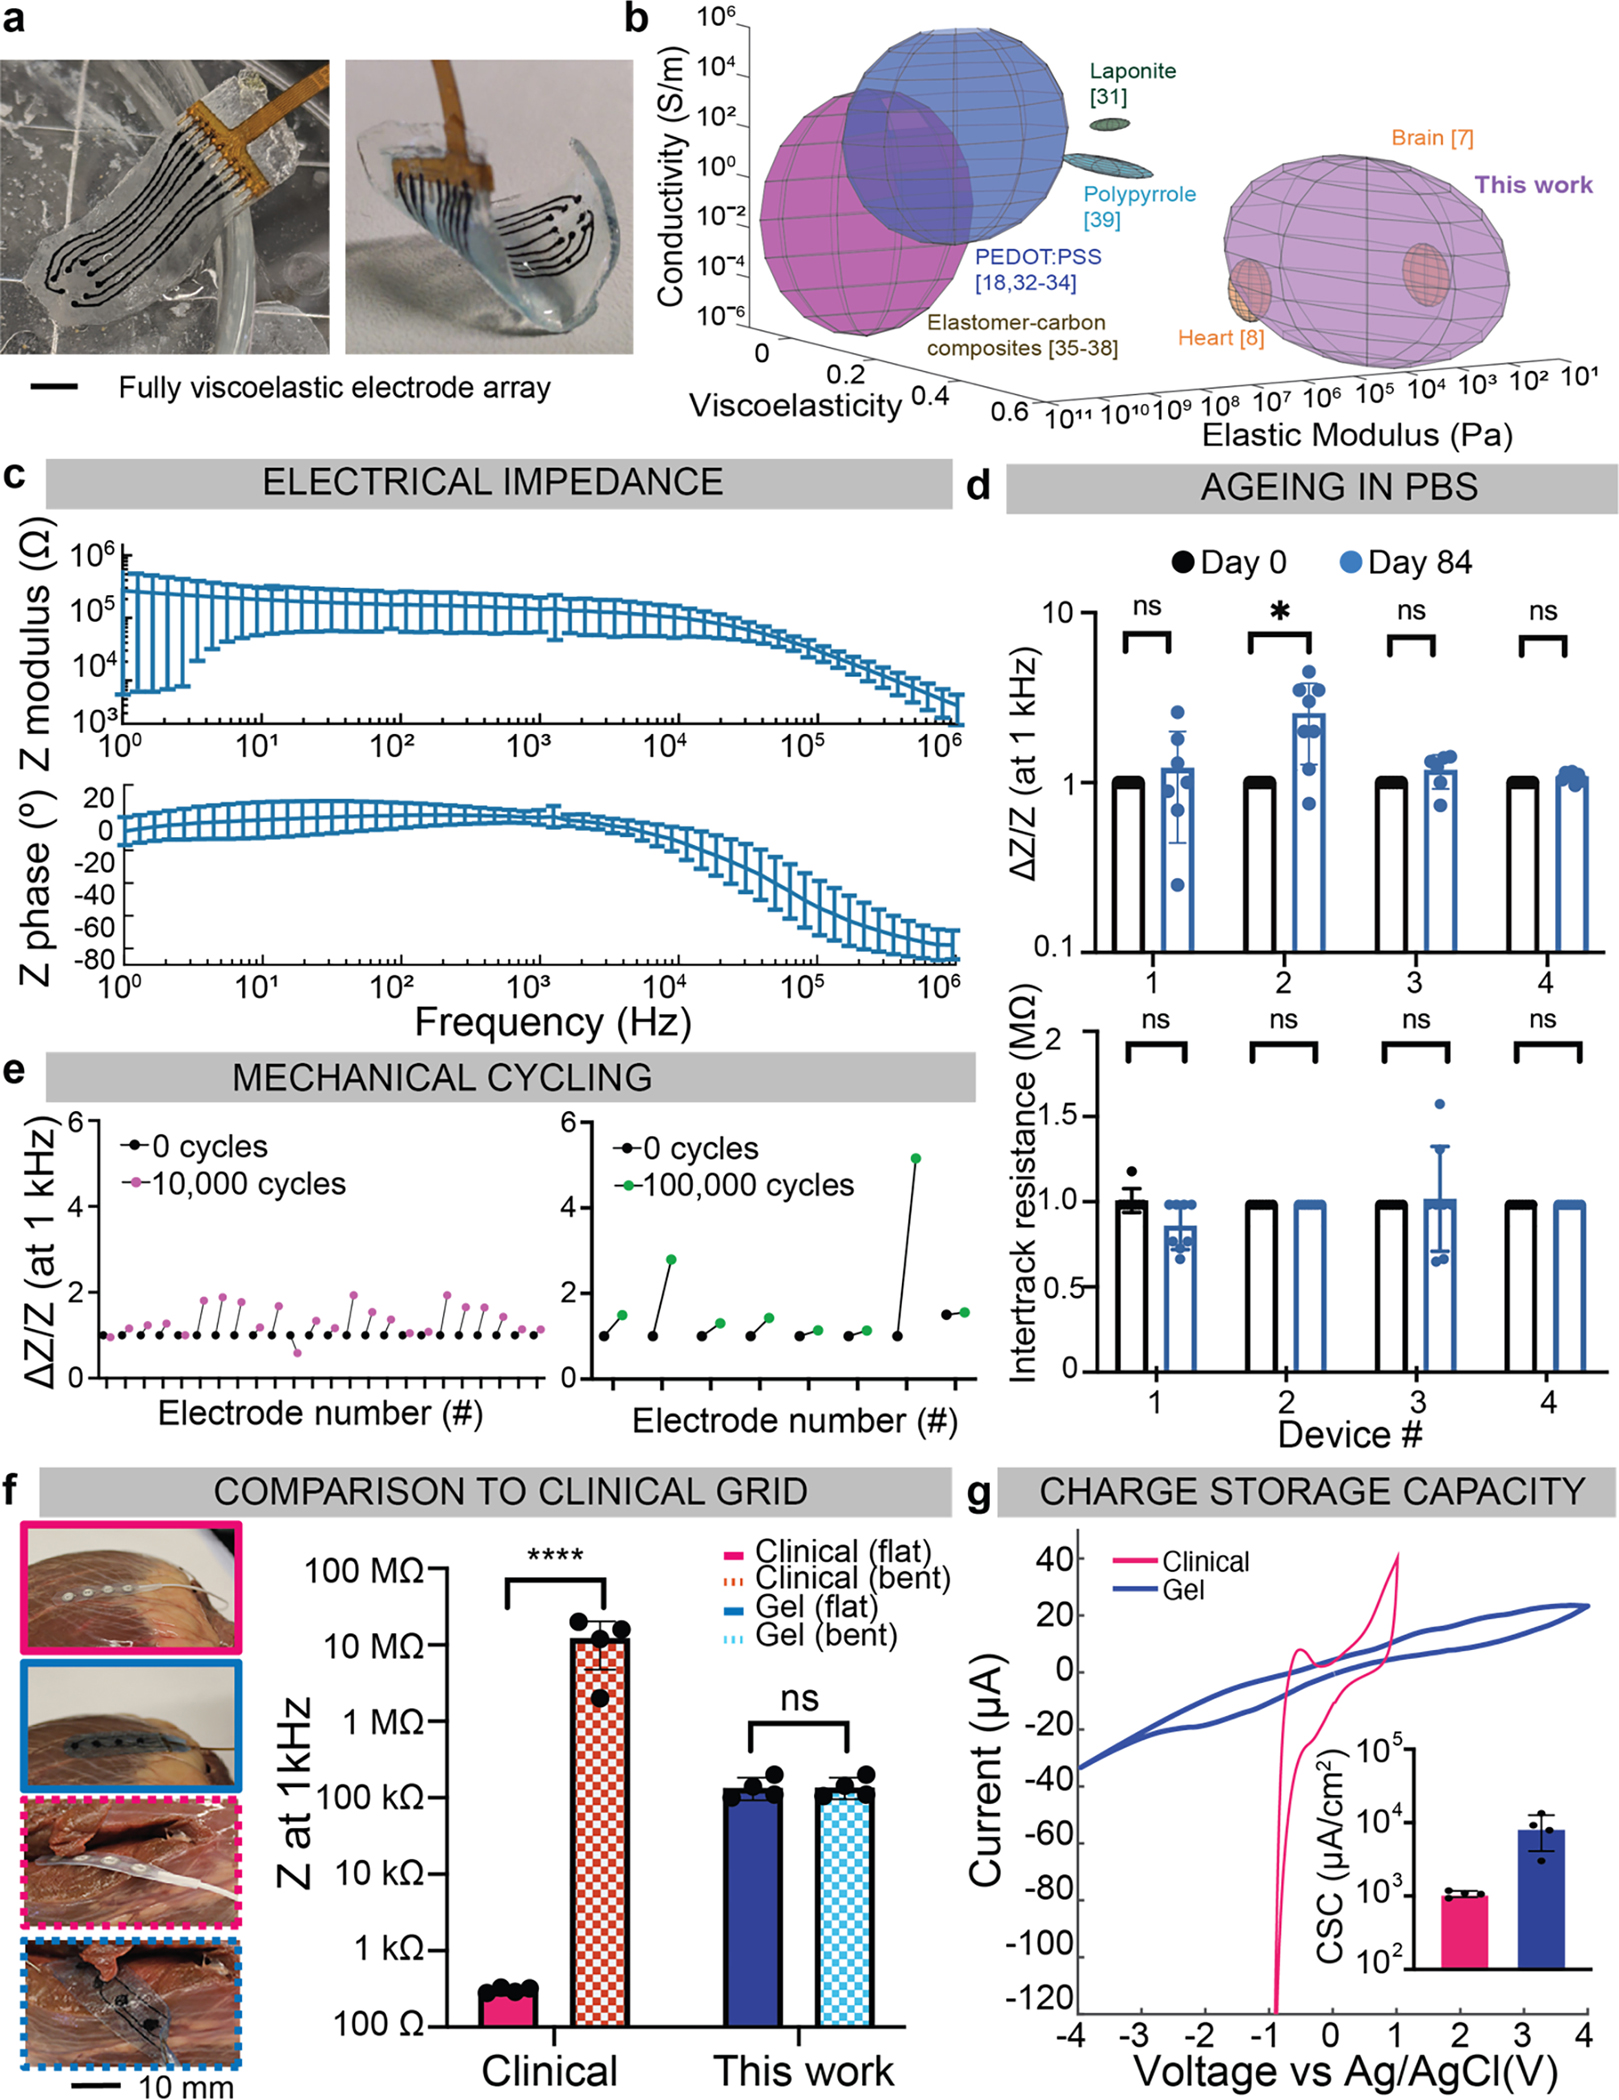
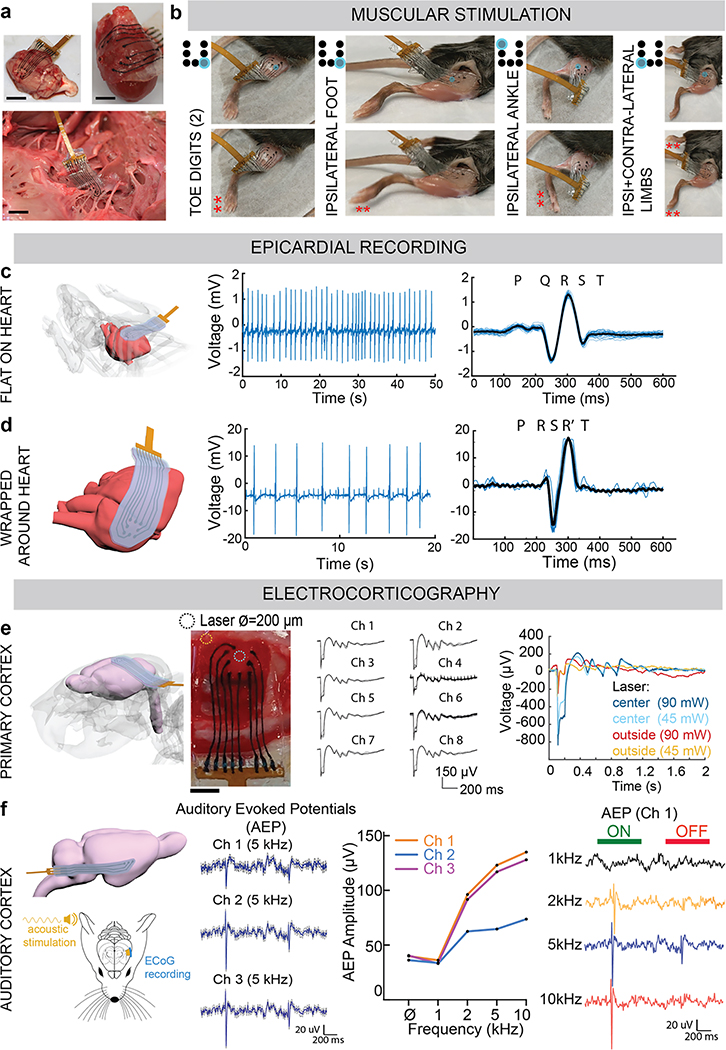
Living tissues are non-linearly elastic materials that exhibit viscoelasticity and plasticity. Man-made, implantable bioelectronic arrays mainly rely on rigid or elastic encapsulation materials and stiff films of ductile metals that can be manipulated with microscopic precision to offer reliable electrical properties. In this study, we have engineered a surface microelectrode array that replaces the traditional encapsulation and conductive components with viscoelastic materials. Our array overcomes previous limitations in matching the stiffness and relaxation behaviour of soft biological tissues by using hydrogels as the outer layers. We have introduced a hydrogel-based conductor made from an ionically conductive alginate matrix enhanced with carbon nanomaterials, which provide electrical percolation even at low loading fractions. Our combination of conducting and insulating viscoelastic materials, with top-down manufacturing, allows for the fabrication of electrode arrays compatible with standard electrophysiology platforms. Our arrays intimately conform to the convoluted surface of the heart or brain cortex and offer promising bioengineering applications for recording and stimulation.


Conflict of interest statement

The authors declare no competing interests.

Figures

Figure 1:
Figure 1:. Alginate hydrogels match the viscoelastic properties of mammalian tissues and conform to complex substrates.
(a) Schematic of the proposed device and its various components. The encapsulation layer is made from a stretchable hydrogel (blue) to which a viscoelastic electrically insulating polymer (pink) is covalently coupled. The conductive tracks (black) are fabricated from a macroporous hydrogel with carbon additives (inset), and interface with a flexible connector (gold). As all the components of the device are viscoelastic, the assembled array can be designed to match the modulus, and flow to conform to follow the tissue on which it is implanted. (b) Rheological properties of fresh lamb cortical tissue and fresh rat cardiac tissue. Storage moduli (G’) (top), and loss moduli (G”) (bottom) shown as a function of strain (ε), at a frequency of 1 Hz, n=10 independent tissue sample sections. Mean and s.d. are plotted. (c) Rheological properties of alginate hydrogels with varying levels of crosslinking agent indicated in the legend. Storage moduli (G’) (top), and loss moduli (G”) (bottom) shown as a function of strain (ε), at a frequency of 1 Hz, n=8 independent gels of each formulation. Mean and s.d. are plotted. (d) Photographs of plastic (5 mm × 15 mm × 25 μm sheet of polyimide, bottom), elastomer (5 mm × 15 mm × 100 μm sheet of Ecoflex, centre), and viscoelastic (5 mm × 15 mm × 250 μm sheet of alginate, top) substrates, with the thickness adjusted so that the bending stiffnesses were comparable. Substrates were coated with blue dye prior to application, and images (left) demonstrate the shapes taken by each material immediately following placement onto the agarose brain model and images (right) after removal of the substrates, and the dye transferred from each substrate to the tissue demonstrated regions of close contact. (e) Quantification of the area on model brains to which dye was transferred for each material (plastic, elastic, viscoelastic), as a metric of direct contact between the substrates and the porcine brain model. Values are normalized to that of the viscoelastic alginate substrate (n=3 substrates of each material). (f) Photographs of viscoelastic (alginate sheets, 5 mm × 5 mm × 200 μm) and elastic (Ecoflex sheets, right: 5 mm × 5 mm × 100 μm) substrates, both when present on the porcine brain model and immediately after removal. The two substrates had matched bending stiffness and were placed on the brain models for two weeks prior to removal and immediate imaging. Scale bar represents 5 mm.
Figure 2:
Figure 2:. Alginate hydrogels can be tuned to optimize compatibility with both astrocytes, neurons, and a coculture.
(a) Photomicrographs of primary cortical astrocytes seeded on gels of different viscoelasticity (more viscoelastic gels, MVEG; less viscoelastic gels, LVEG) and stiffness (soft, 1 kPa, and stiff, 8 kPa), after 120 hours. Cells stained for GFAP (green)/nuclei (blue), scale bar represents 10 μm (left). Quantification of % cells positive for GFAP on each substrate (right) (n=4/sample, 14 random fields/sample) (p(***)=0.0021). (b) Photomicrographs of primary cortical neurons seeded on alginate-Matrigel interpenetrating networks (IPNs) of different viscoelasticity (MVEG, LVEG) and stiffness (soft, 1 kPa, and stiff, 8 kPa), after 72 hours. Cell bodies and neurites are falsely coloured blue to provide better contrast from the underlying gel. Scale bar represents 400 μm (left). Quantification of the number of neurites in a 0.8 mm2 area (right) (n=4/sample, 5 random fields/sample) (p(*)=0.0194). (c) Photomicrographs of a coculture of primary cortical astrocytes and primary cortical neurons, seeded on alginate-Matrigel IPNs of different viscoelasticity (MVEG, LVEG) and stiffness (soft, 1 kPa, and stiff, 8 kPa), after 120 hours. Cells stained for GFAP (green)/MAP2 (red)/nuclei (blue), scale bar represents 40 μm (left). Quantification of % cells positive for GFAP on each substrate (right) (n=4/sample, 8 random fields/sample) (p(***)=0.0018). (d) Photomicrographs of a coculture of primary cortical astrocytes and primary cortical neurons, seeded on alginate-Matrigel IPNs of different viscoelasticity (MVEG, LVEG) and stiffness (soft, 1 kPa, and stiff, 8 kPa), after 120 hours. Cells stained for NeuN (green)/β3-tubulin (red)/nuclei (blue), scale bar represents 40 μm (left). Quantification of the number of neurites in a 0.8 mm2 area (right) (n=4/sample, 7 random fields/sample) (p(*)=0.0238, p(***)=0.0035). All numerical data are presented as mean ± s.d. (one-way ANOVA and Tukey’s HSD post hoc test, ****p<0.0001, 0.0001<***p<0.001, 0.001<**p<0.01, 0.01<*p<0.05, and non-significant, n.s., p>0.05).
Figure 3:
Figure 3:. Viscoelastic electronics formed from an alginate matrix with electrically active carbon-based fillers.
(a) Schematic showing the fabrication of nanoporous conductive gels (nanoCG) and microporous conductive gels (microCG). An alginate solution, graphene flakes (GF), and/or carbon nanotubes (CNT) were mixed, and immediately crosslinked to create nanoCG (top) (pore diameter ~ 10s nm. When the mixed solution was frozen and lyophilized, a microCG (bottom) (pore diameter ~ 100s μm) was formed, with a higher density of carbon additives in the gel walls. (b) Photograph demonstrating casting of the tracks in a flexible mold (left), and their ability to follow the vasculature of a fresh lamb brain. Scale bars represent 10 mm. (c) Scanning electron microscope (SEM) photomicrographs comparing nanoCG (top row, scale bar: 100 μm), and microCG (middle row, scale bar: 50 μm), with no additives, GF-only, CNT-only, and GF+CNT. Higher magnification of microCG (bottom row, scale bar: 5 μm). Red arrows point to CNT, and * regions indicate regions containing GF. (d-f) Quantification of the conductivity (S/m) of nanoCG (blue) and microCG (red), comparing the behaviour of GF-only (d), CNT-only (e), and GF+CNT (f) compositions at increasing concentrations of carbon (n=38 independent gels) and s.d (error bars) shown in black, with all p(****)<0.0001. (g) Quantification of conductivity of microCG as a function of total carbon (GF+CNT) compositions, fit with a sigmoidal curve (R2=0.89). (h) Graphical evaluation of the relative contribution of GF (x-axis) and CNT (y-axis) on the conductivity of microCG. Resulting gel conductivity shown by color, ranging from low (blue) to high (red), as indicated in legend. (I), (II), and (III) marks regions of mostly CNT, mostly GF, and a mix of GF+CNT, respectively. Each small solid circle represents an independent gel measurement, and the coloration of the groupings of solid circles represents mean conductivity (n=20–30/composition). (i) SEM photomicrographs comparing the structure of microCG at varying concentrations of only CNT, only GF, and a mix of GF+CNT. (I, purple), (II, red), and (III, green) marks regions of mostly CNT, mostly GF, and a mix of GF+CNT, respectively. Scale bar represents 20 μm in all images. (j-k) Quantification of the storage modulus (G’) (i) and loss modulus (G”) (j) of GF+CNT microCG using nanoindentation (n=10 independent gels). All conditions were n.s. All numerical data are presented as mean ± s.d. (one-way ANOVA and Tukey’s HSD post hoc test, ****p<0.0001 and non-significant, n.s., p>0.05). Micrographs were repeated with at least 3 independent gels.
Figure 4:
Figure 4:. Fabrication of highly flexible and stretchable viscoelastic encapsulation layers.
(a) Schematic of the two individual components that comprise the encapsulation layers of the device. A stretchable alginate tough gel, TG (purple), was covalently coupled to a self-healing, PDMS-based, physically entangled viscoelastic material, PEVM (pink), via carboxyl-amine chemistry. (b) Photographs of the composite encapsulation layer stretched under tension to 0, 500 and 1000% of the original length. The PEVM (pink) can be observed to begin to fracture at the greatest strain, while the TG (clear) remained intact. Scale bar represents 5 mm. (c) Quantification of the stress (σ) vs elongation (λ) behaviour until the first point of film fracture. Representative curve shown for each encapsulation layer tested: PEVM-only, TG-only, and PEVM-TG (left). The elastic modulus for each material was extracted from the linear regime. Values represent mean (n=3 independent materials of each condition) and s.d. (right, inset). (d) Photographs of the encapsulation layer following cutting with a CO2 laser (left), bright field microphotograph (right, top) and scanning electron microscopy (SEM) view (right, bottom) of the cut after exposure to the laser. Scale bar represents 10 mm (left), 1 mm (right, top) and 100 μm (right, bottom).
Figure 5:
Figure 5:. Device characterization and in vitro validation of the fully viscoelastic device.
(a) Photographs of the fully assembled array, 6 mm × 20 mm × 250 μm, with 8 electrodes of d=700 μm and a 1.5 mm pitch, flat in PBS (left), and bent (right). Scale bar represents 3 mm. (b) Quantification of the elastic modulus (Pascals), conductivity (S/m), and viscoelasticity (tan(δ)), of various tissues and conductive composites. Rat heart and brain tissue in orange, represent the targeted physiologic stiffness and viscoelasticity. The alginate-based conductors fabricated in this study are shown in purple. Values for other conductive composites reported in the literature are also represented, using the reported ranges for each variable. Citations are provided for the values in the illustration, which are taken from the literature in Supplementary Table 2. (c) Electrical impedance spectroscopy (EIS) data of five devices, from five distinct batches, measured in PBS showing the impedance modulus (left) and impedance phase (right) over a frequency sweep from 1 MHz to 1 Hz. Mean and s.d. of each device plotted, over n=40 of the electrodes. (d) Comparison of electrode impedance of 4 arrays at 1 kHz, before and after ageing in PBS for 84 days (top). Impedance for each electrode is normalized to the impedance value before ageing. Intertrack resistance between adjacent electrodes, plotted before and after ageing in PBS (bottom), for n=4 independent devices. Numerical data presented as mean ± s.d. (one-way ANOVA and Tukey’s HSD post hoc test, *p<0.05 (p=0.02) and non-significant, n.s., p>0.05. (e) Multiaxial mechanical cycling of viscoelastic arrays, at an equivalent 11% biaxial strain, with the relative change in impedance (DZ/Z) at 1 kHz plotted for each electrode. Three devices were cycled 10,000 times (left, pink) and one device was cycled 100,000 times (right, green). (f) Photographs of a commercial clinical grid (pink) with a similar-dimensioned viscoelastic array (blue), on a bovine heart (left). Scale bar represents 10 mm. The grids were placed on smooth regions of the tissue (solid line) and bent 90° around the heart (dashed lines). Impedance at 1 kHz is extracted for each electrode (n=4/device) and compared for the flat and bent configurations (right). Mean and s.d. are plotted, with ****p<0.0001 and non-significant, n.s., p>0.05. (g) Cyclic voltammetry of an electrode from the commercial grid (pink), and from the viscoelastic array described in this work (blue). Inset bar graph shows the charge storage capacity (CSC) extracted from each electrode (n=4/device) and compared over the four electrodes from each array (inset). Mean and s.d. of each electrode plotted.
Figure 6:
Figure 6:. In vivo validation of the fully viscoelastic device for stimulation and for recording, even under extreme deformation.
(a) Photographs of the assembled viscoelastic array on a rat cortical surface (top, left), conformed around a rat heart (top, right), and wrapped around the nerves of a bovine heart (bottom). Scale bar: 3 mm. (b) Photographs, taken from videos, of the viscoelastic array stimulating the exposed muscle of a mouse hindlimb. By positioning the array or changing the electrode applying the stimulation pulses, the toes only (far left), the foot only (left), the ankle (right), or both the contralateral and ipsilateral limbs (far right) are triggered. Red asterisks (**) mark the portion of the limb responding to stimulation. Schematic to the left of each image shows the representative electrode (blue) that is stimulating the tissue. (c) Schematic of the viscoelastic array, flat and conformed to the surface of a mouse heart (left). Acute electrical activity recorded in vivo from the mouse heart with three electrodes, with the filtered electrocardiogram (EKG) (middle), and superimposed average (black) of all the beats (right). Individual cycles are shown in light blue. (d) Schematic of the viscoelastic array, wrapped almost 360° around the surface of a mouse heart (left), and remaining conformed. Acute electrical activity recorded in vivo from the mouse heart with three electrodes, with the filtered electrocardiogram (EKG) (middle), and superimposed average (black) of all the beats (right). Individual cycles are shown in light blue. (e) Schematic of the viscoelastic array, placed on the cortical surface of a rat brain (far left). Photograph of the viscoelastic array on top of the exposed dura of a Thy1 rat cortex (left, scale bar: 4 mm), with added circles to show where stimulation from a laser was applied (either at the blue circle: centre of device, or brown circle: lateral edge of device). Acute electrical activity recorded in vivo, epidurally from the cortical surface after stimulation by blue light laser, at centre or lateral edge of array. Each electrode depolarization is shown by each respective electrode tracing, as the average and standard deviation over the recording session (top, right). Comparison of the electrical activity recorded by a single channel (Ch) as the laser position changed from the centre of the device (blue curves) to the lateral edge, and as the laser power changed from 90 mW (dark blue and brown traces) to 45 mW (light blue and brown traces). (f) Schematic of the viscoelastic array, bent more than 90° to reach the auditory cortex of a rat brain (top, left). Schematic of the set-up for recording from the auditory cortex (bottom, left). Acute electrical activity recorded in vivo, epidurally from the auditory cortical surface from each of the 3 electrodes (channels) of the array, when an acoustic tone of 5 kHz was applied. In addition to recording auditory evoked potentials (AEP) from each Ch, an independent frequency tuning profile of each Ch was obtained. Tone burst stimulation (duration of 1 second) applied, and AEP recorded from Ch 1, over 4 applied acoustic tones (1, 2, 5, 10 kHz). ‘ON’ (green) and ‘OFF’ (red) of the tone burst are indicated above AEP.

References

    1. Tolstosheeva E et al. A multi-channel, flex-rigid ECoG microelectrode array for visual cortical interfacing. Sensors (Switzerland) 15, 832–854 (2015). - PMC - PubMed
    1. Luan L et al. Ultraflexible nanoelectronic probes form reliable, glial scar–free neural integration. Sci. Adv. 3, (2017). - PMC - PubMed
    1. Tybrandt K et al. High-Density Stretchable Electrode Grids for Chronic Neural Recording. Adv. Mater. 30, (2018). - PMC - PubMed
    1. Konerding WS, Froriep UP, Kral A & Baumhoff P New thin-film surface electrode array enables brain mapping with high spatial acuity in rodents. Sci. Rep. 8, 1–14 (2018). - PMC - PubMed
    1. Lacour SP, Courtine G & Guck J Materials and technologies for soft implantable neuroprostheses. Nat. Rev. Mater 1, (2016).

Publication types