. 2021 Jul;53(7):955-961.
doi: 10.1038/s41588-021-00882-3. Epub 2021 Jun 17.

PHYTOCHROME-INTERACTING FACTORs trigger environmentally responsive chromatin dynamics in plants

Affiliations

PHYTOCHROME-INTERACTING FACTORs trigger environmentally responsive chromatin dynamics in plants

Björn C Willige et al. Nat Genet. 2021 Jul.

Erratum in

Abstract

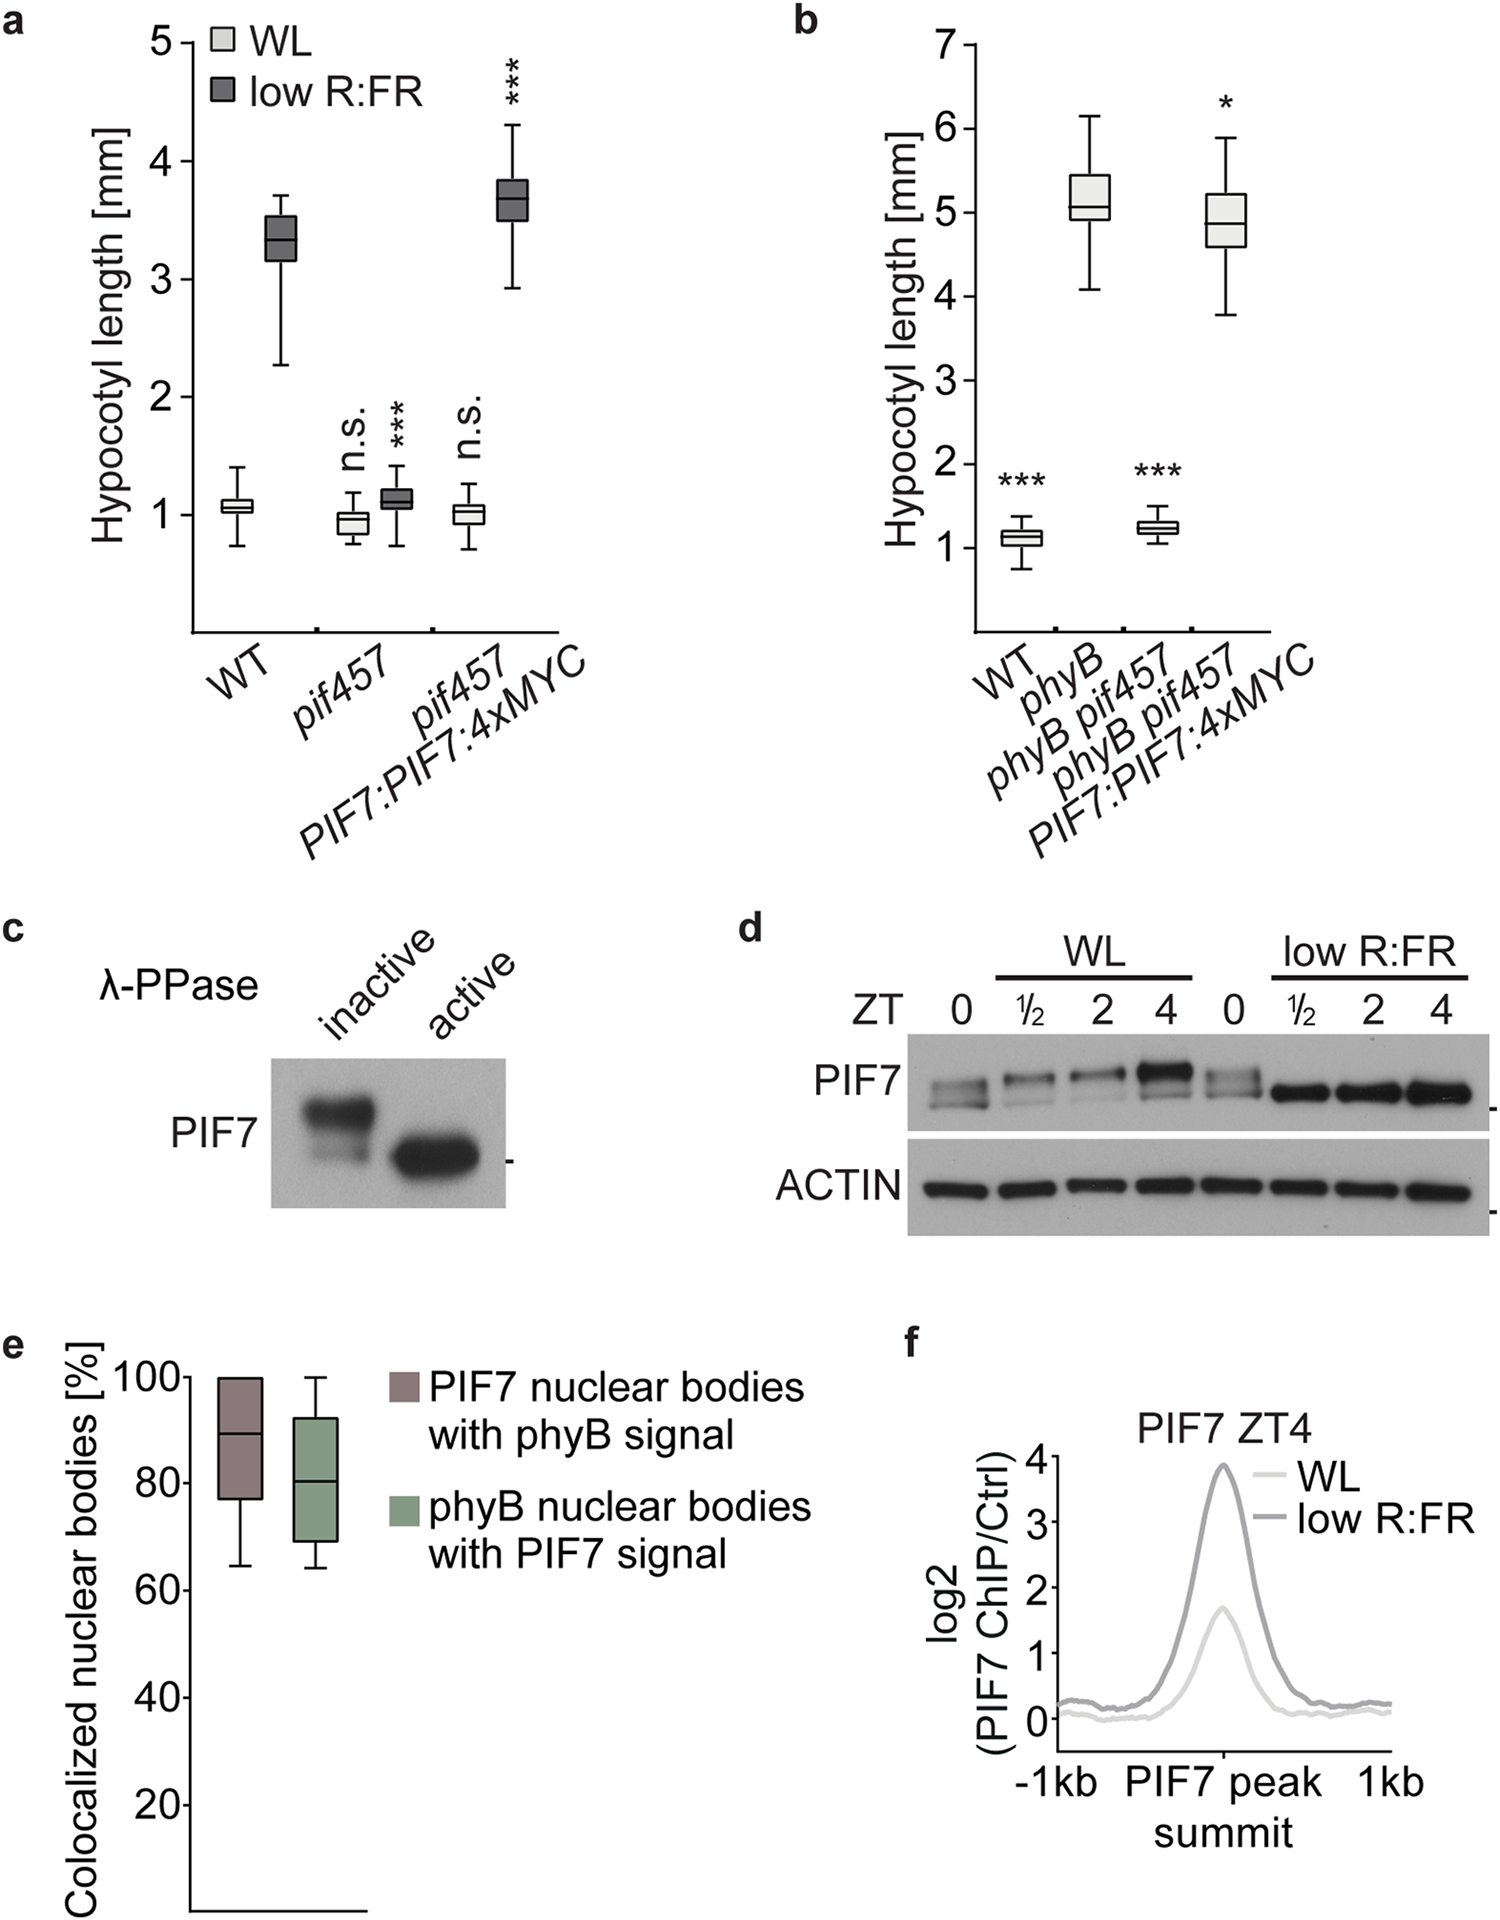
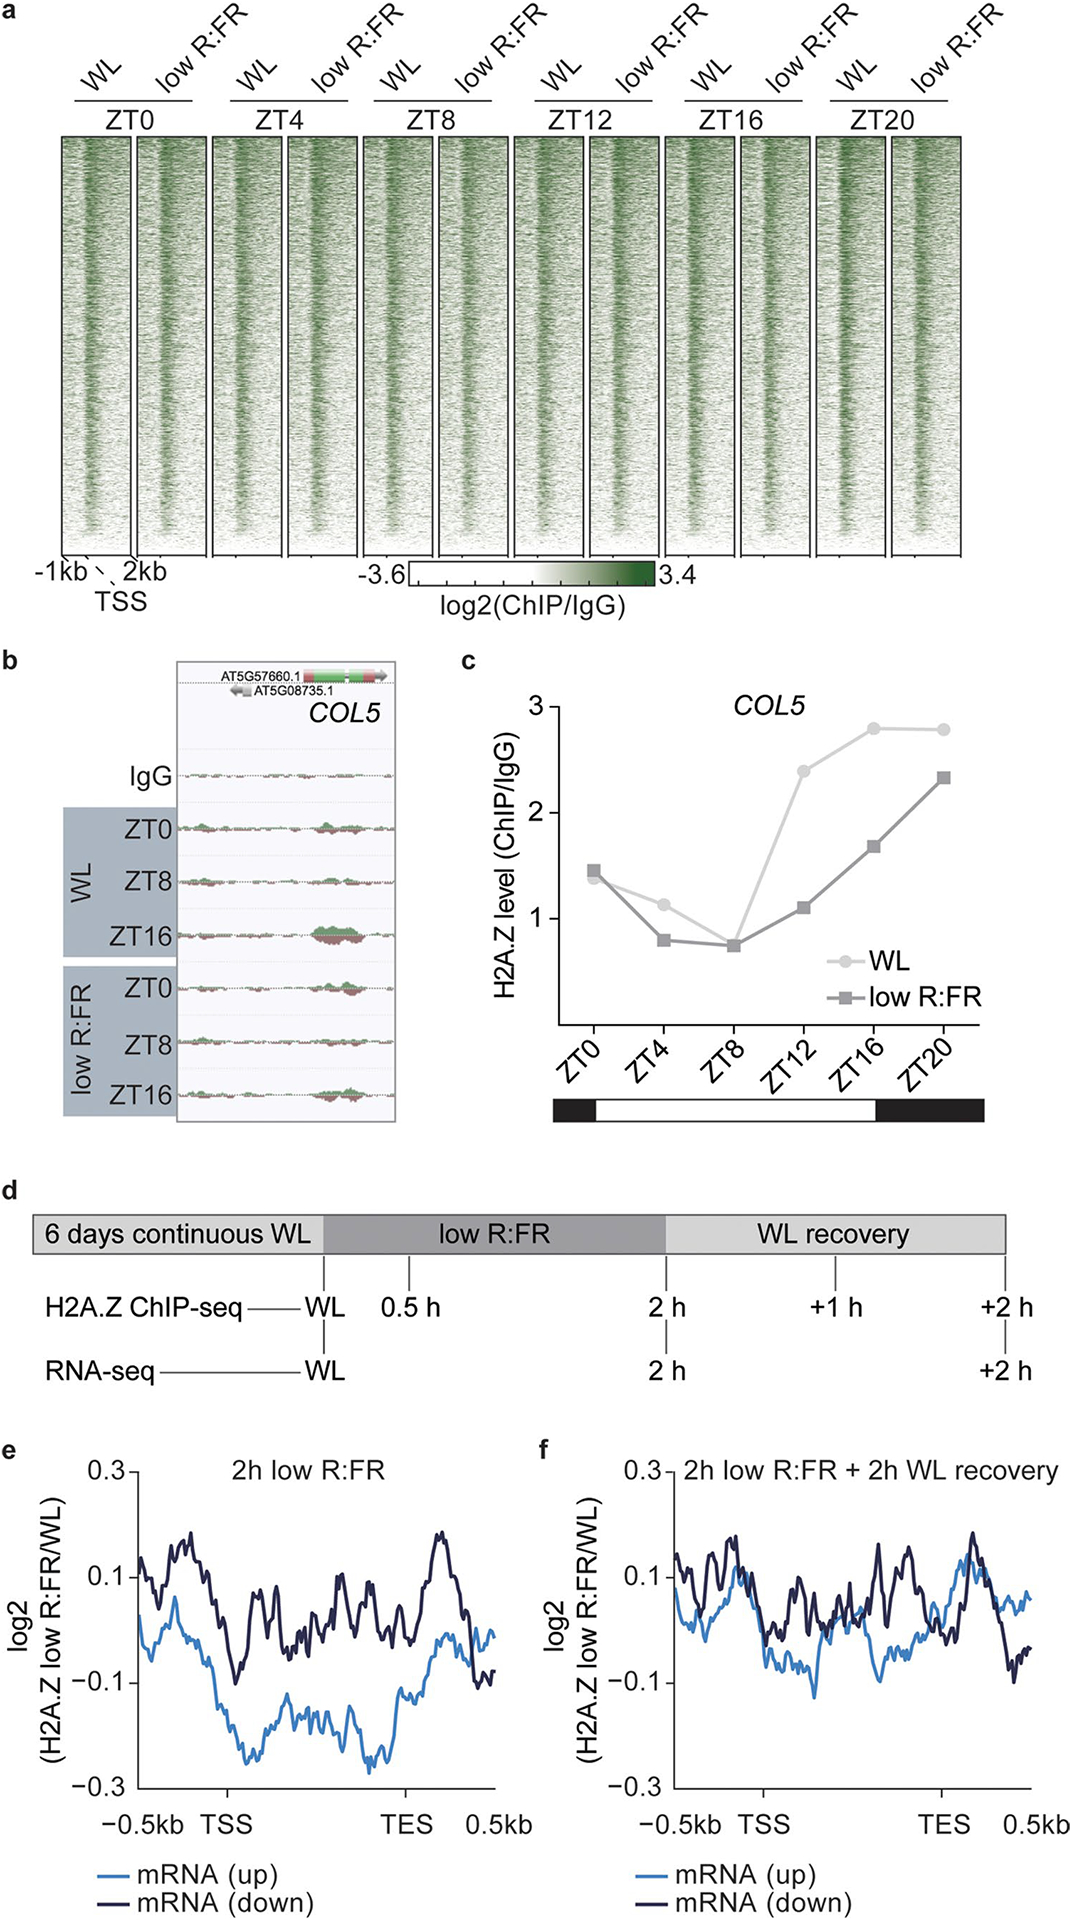
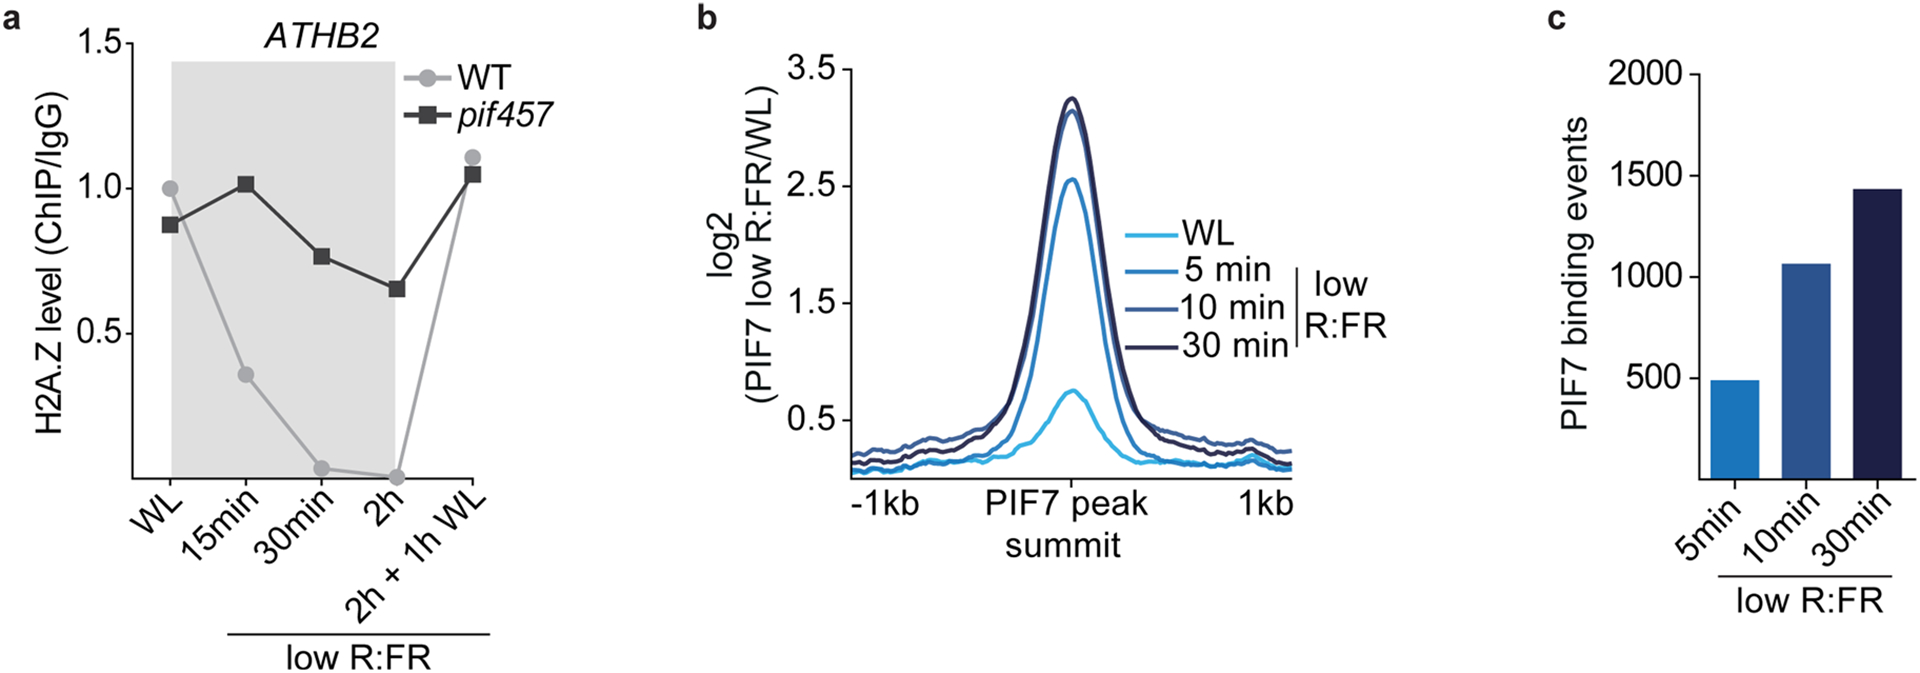
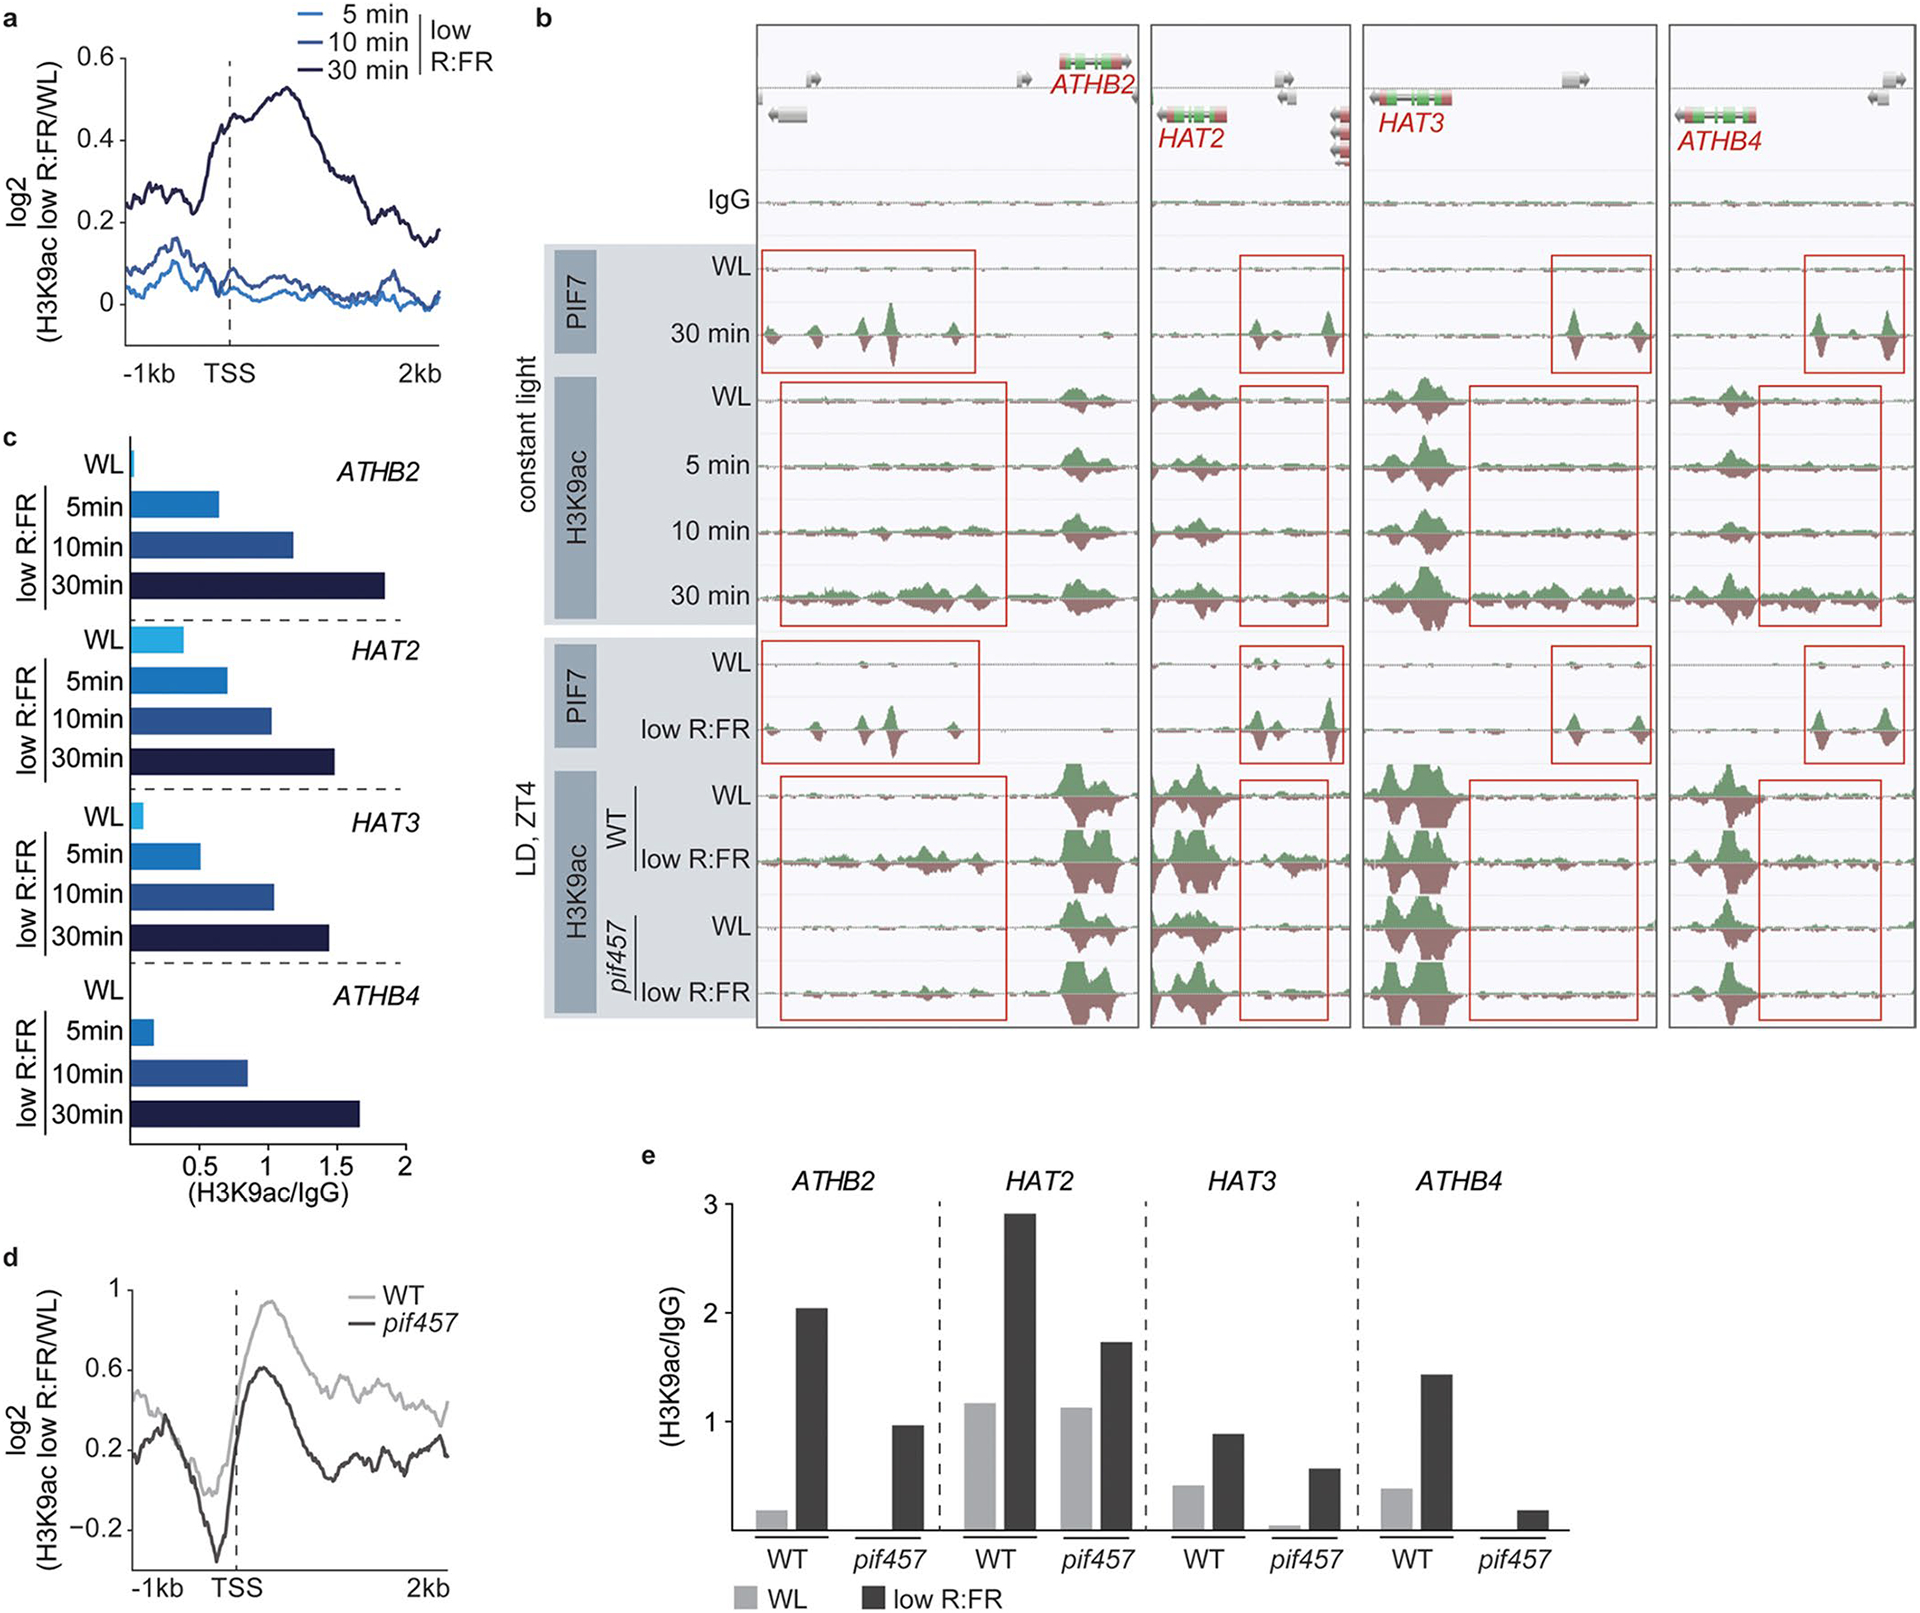
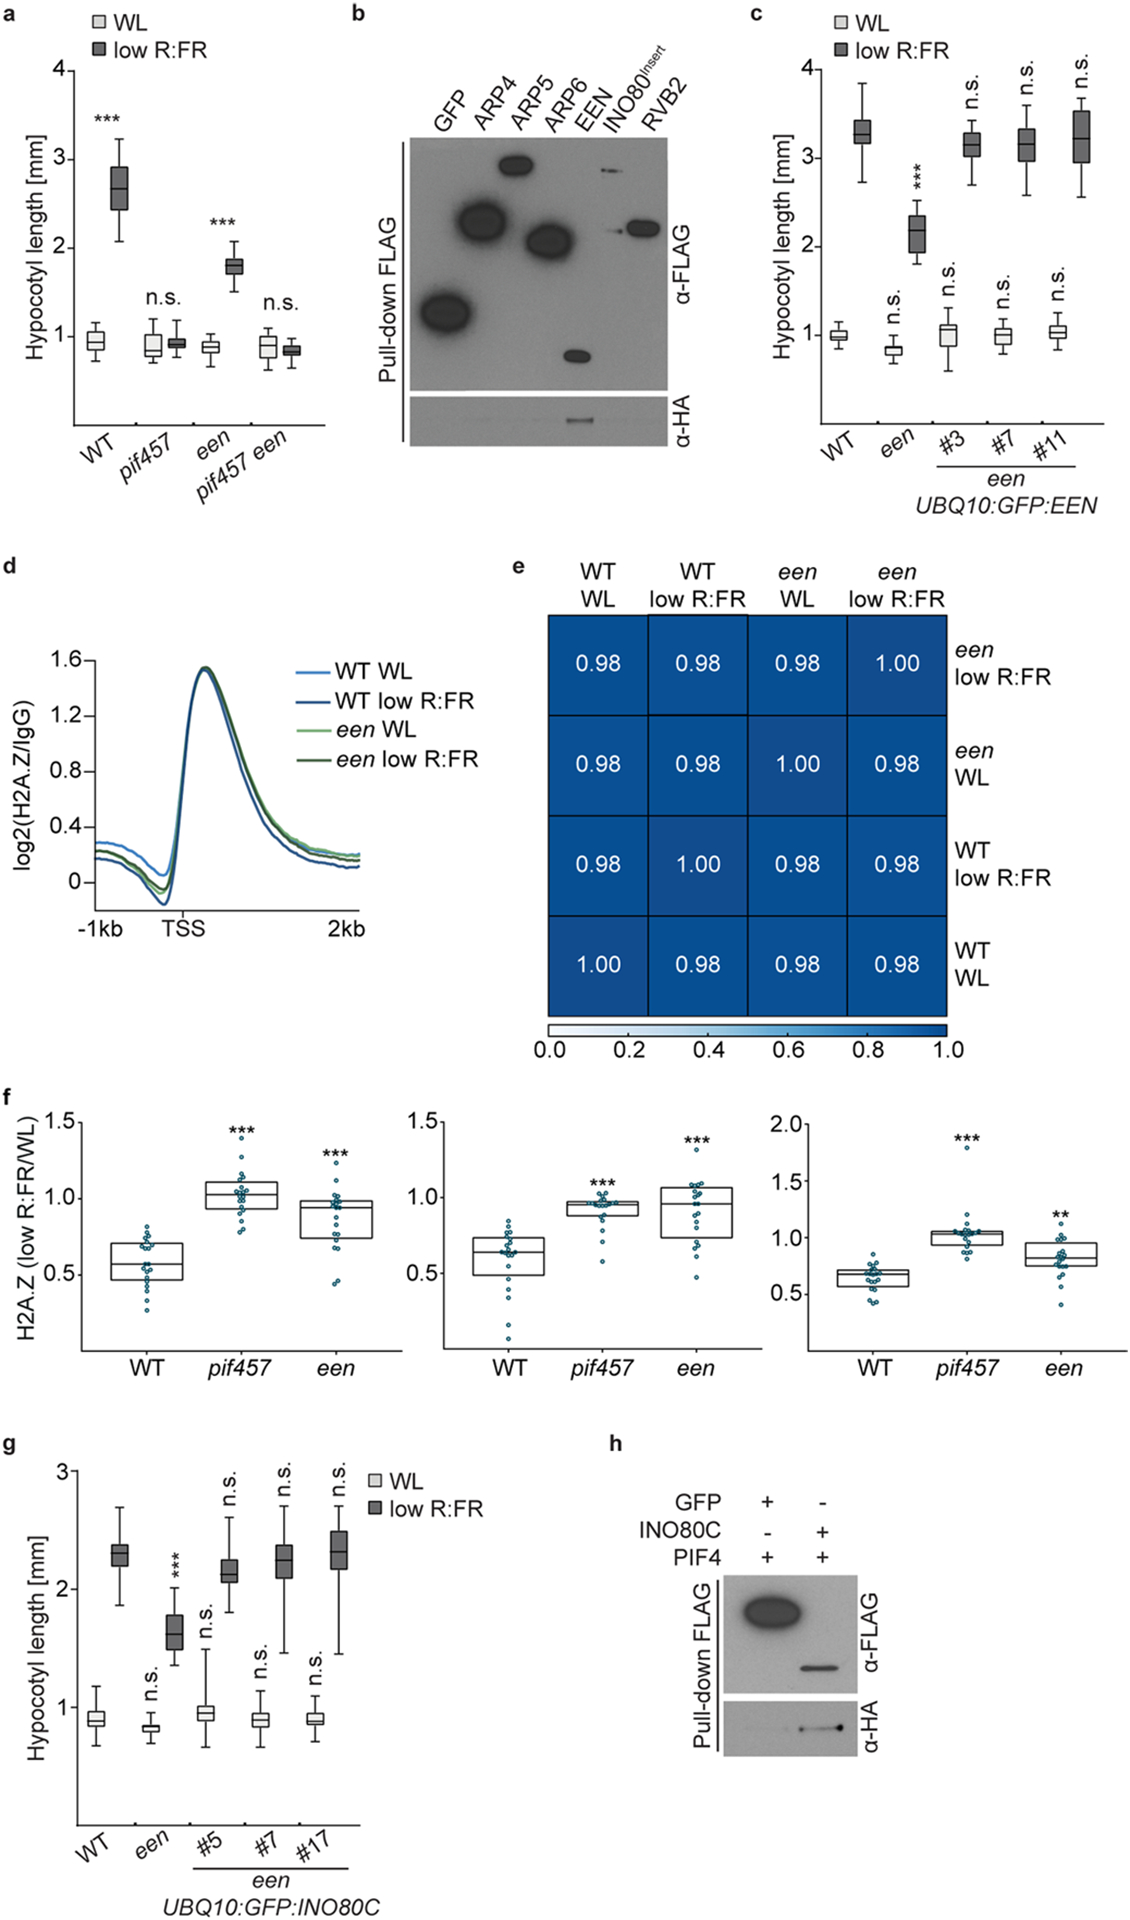
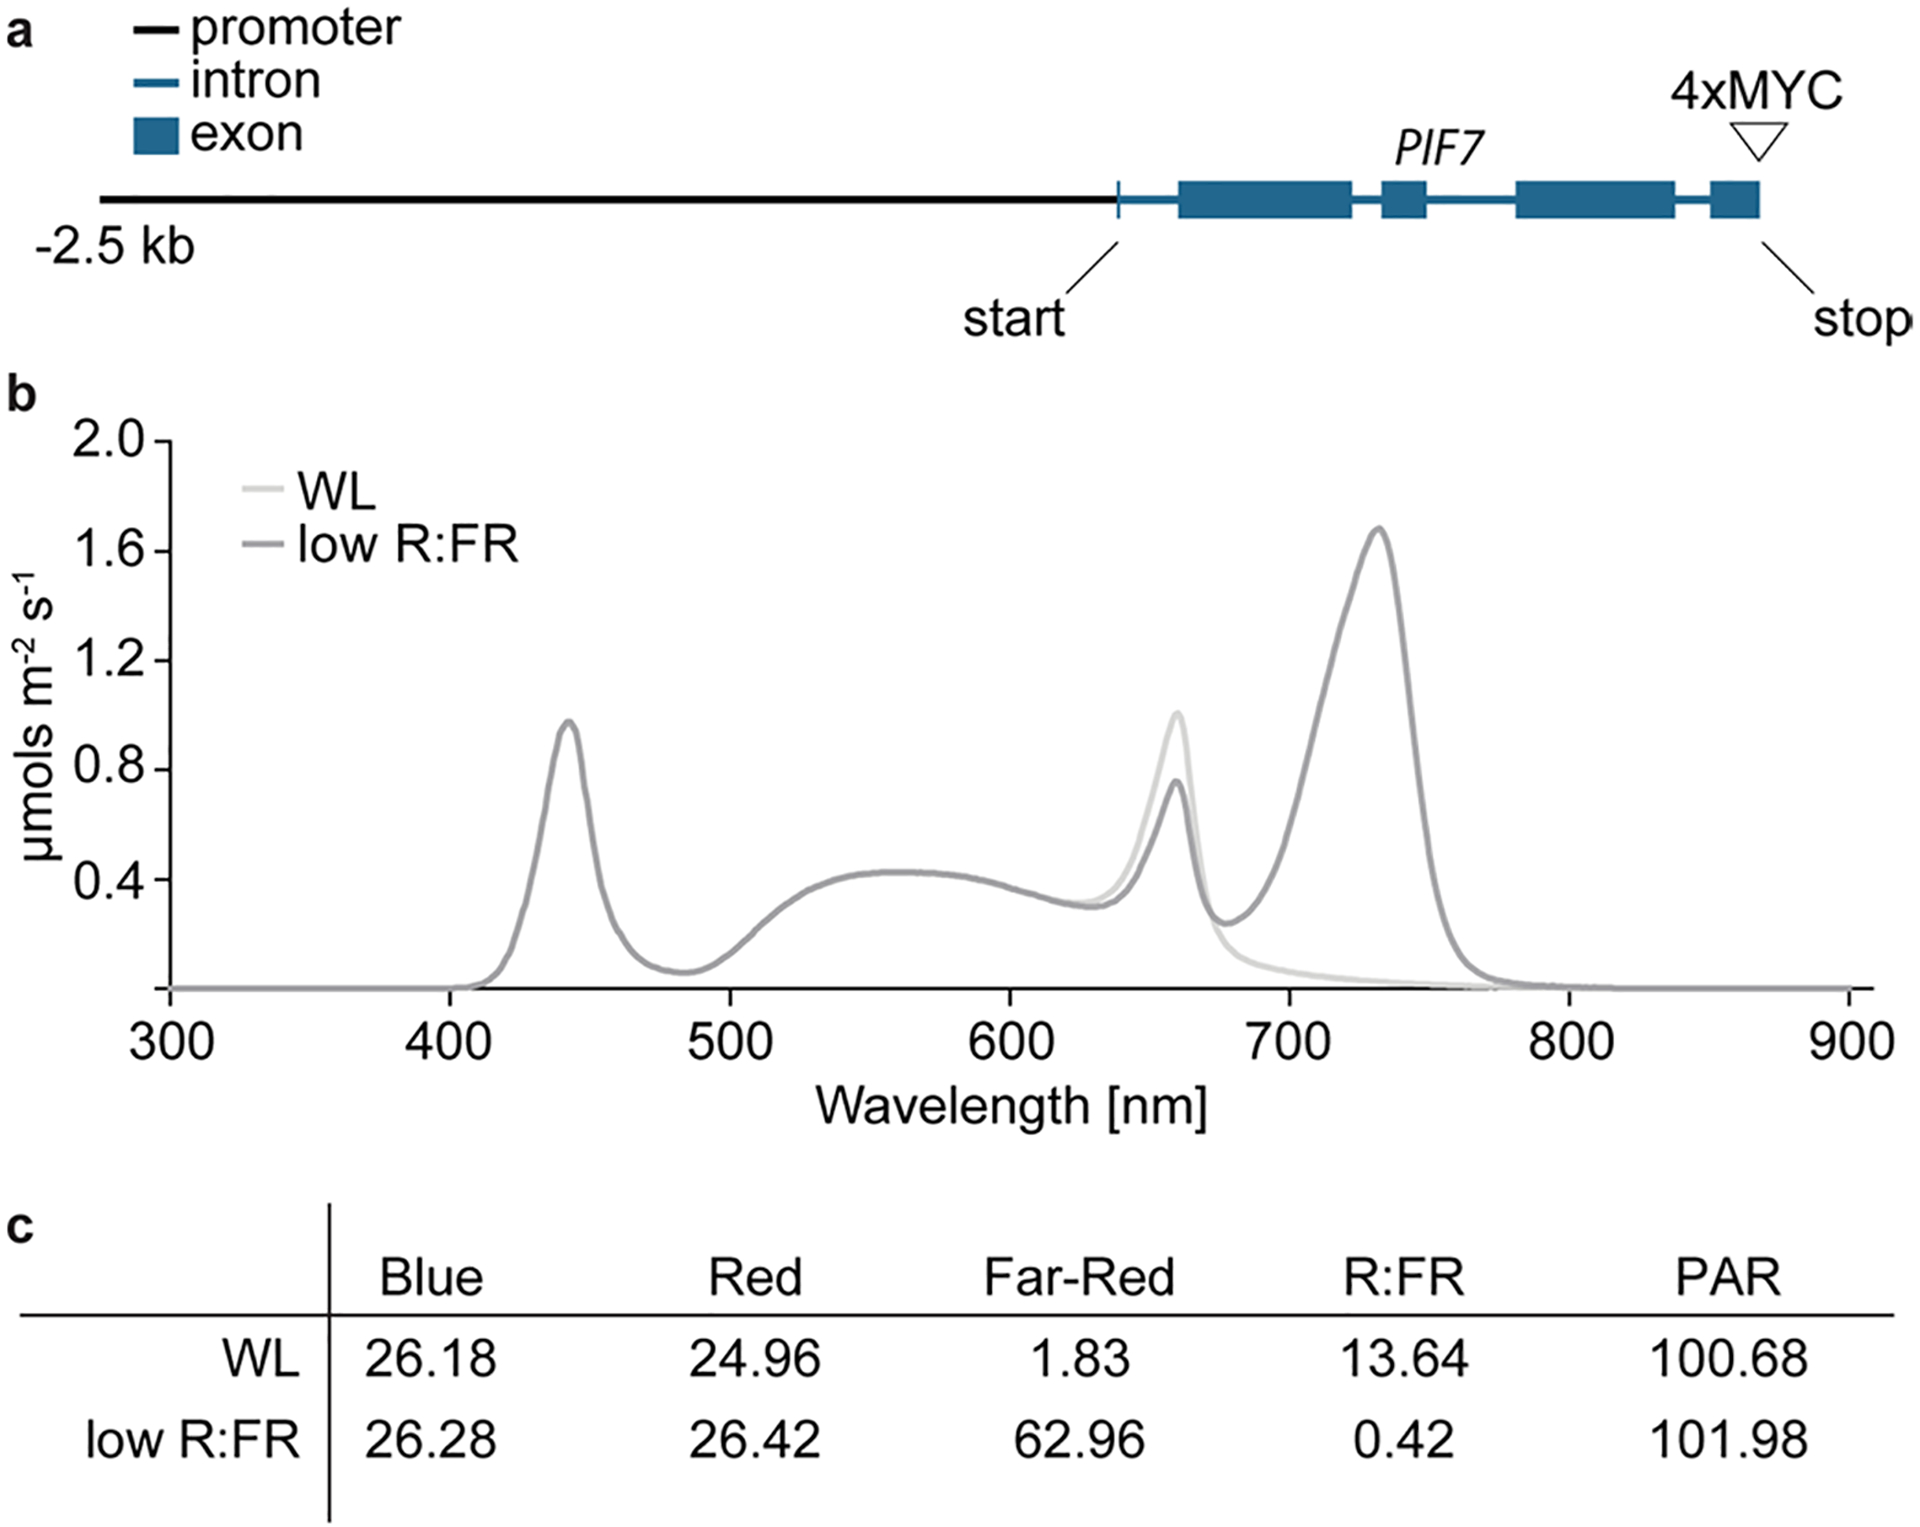
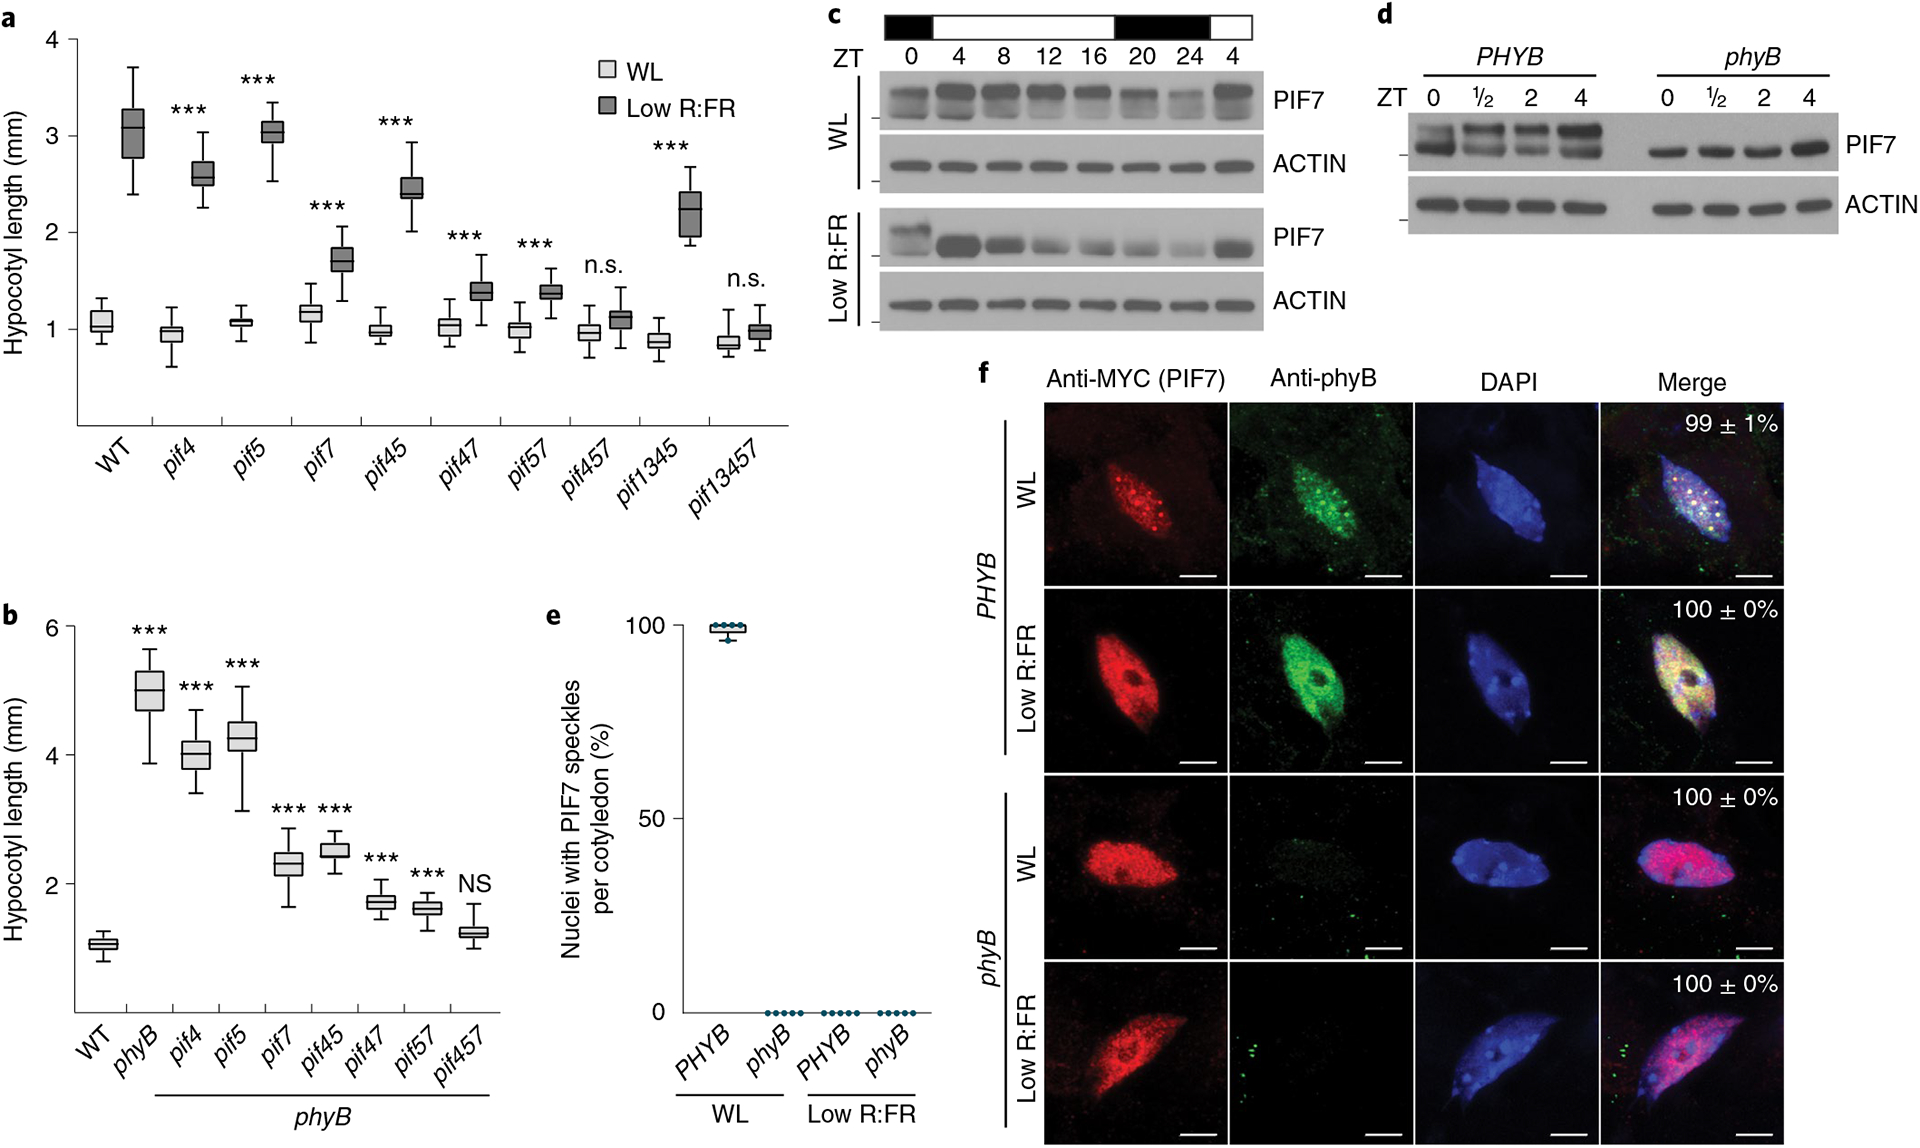
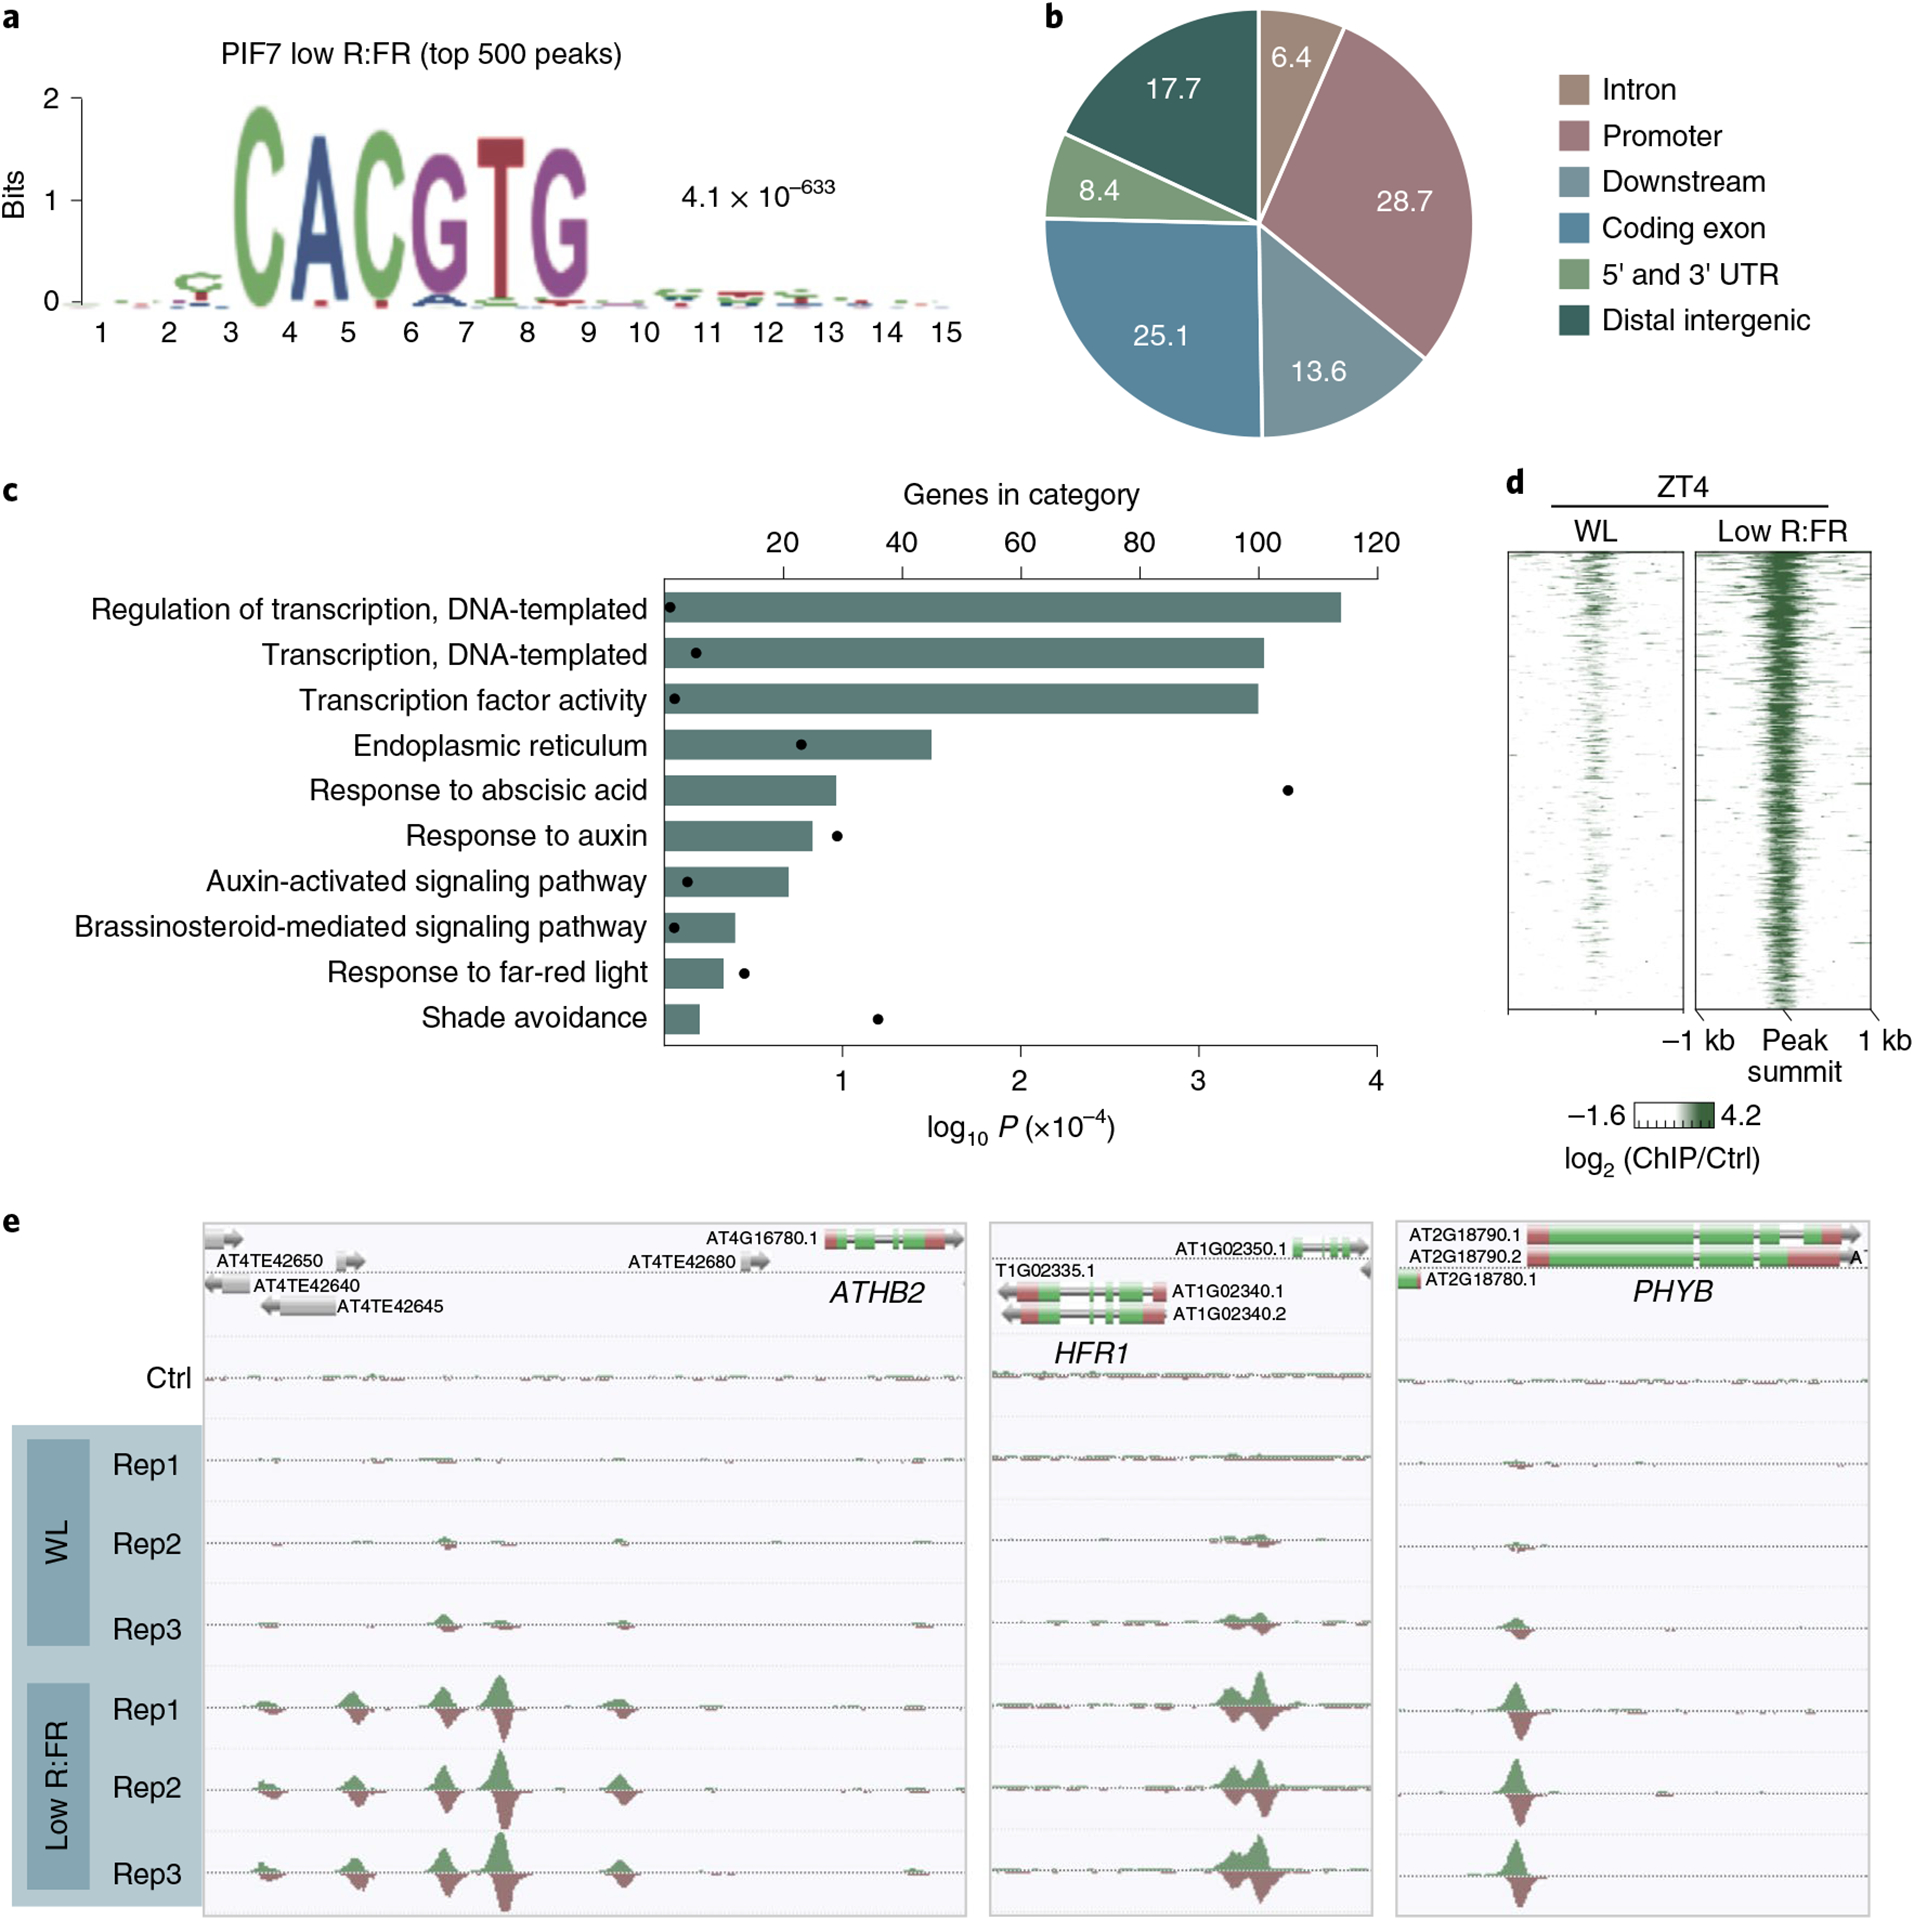
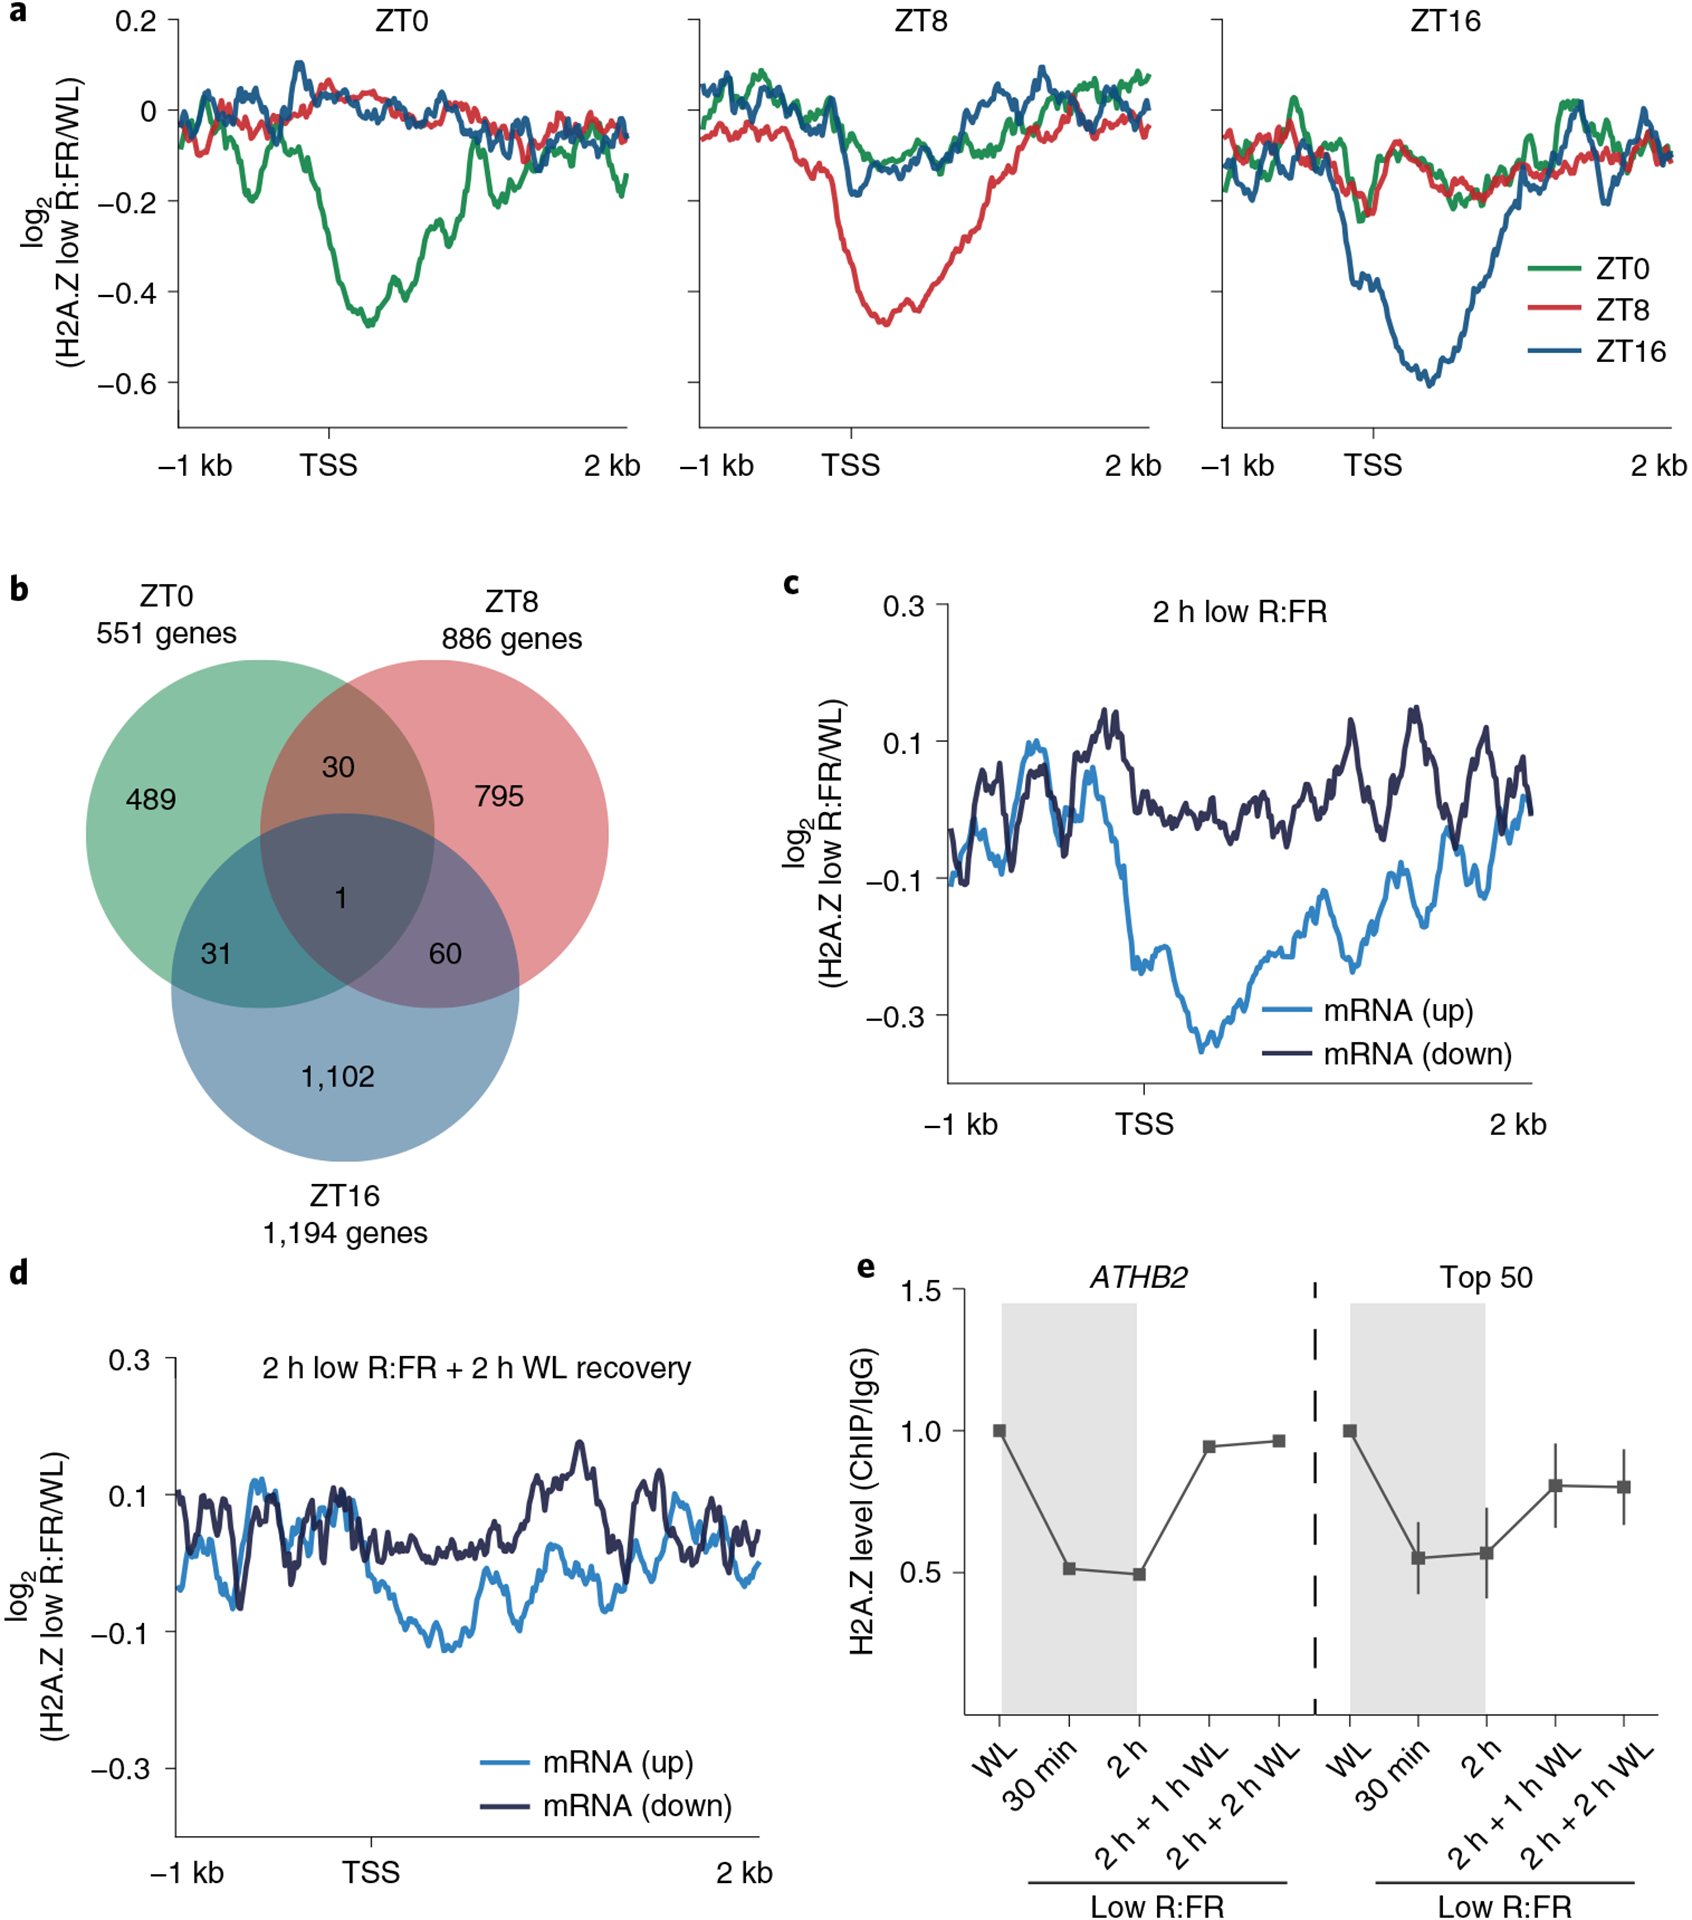
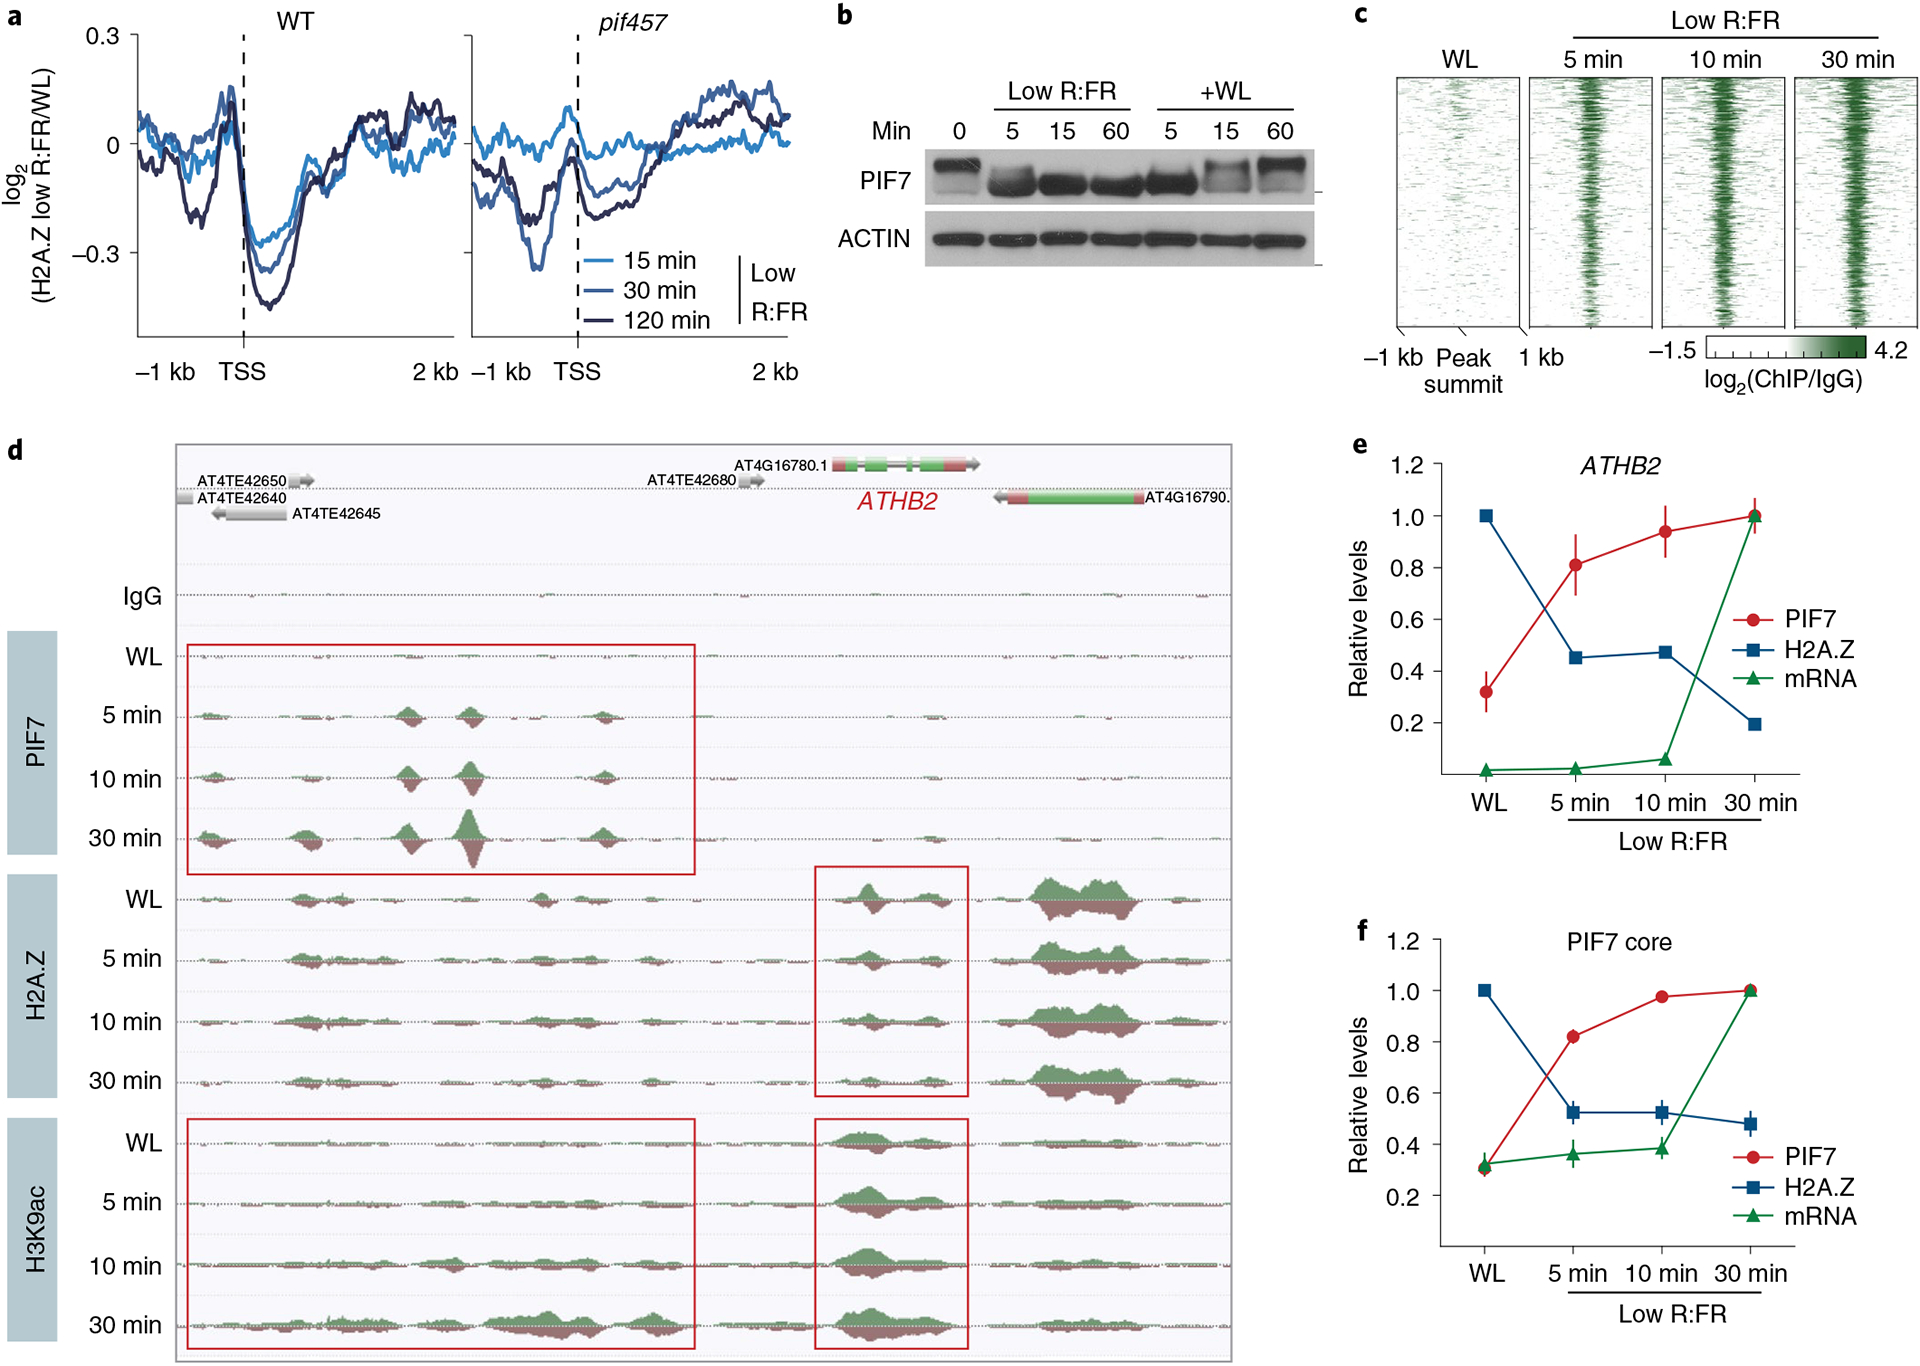
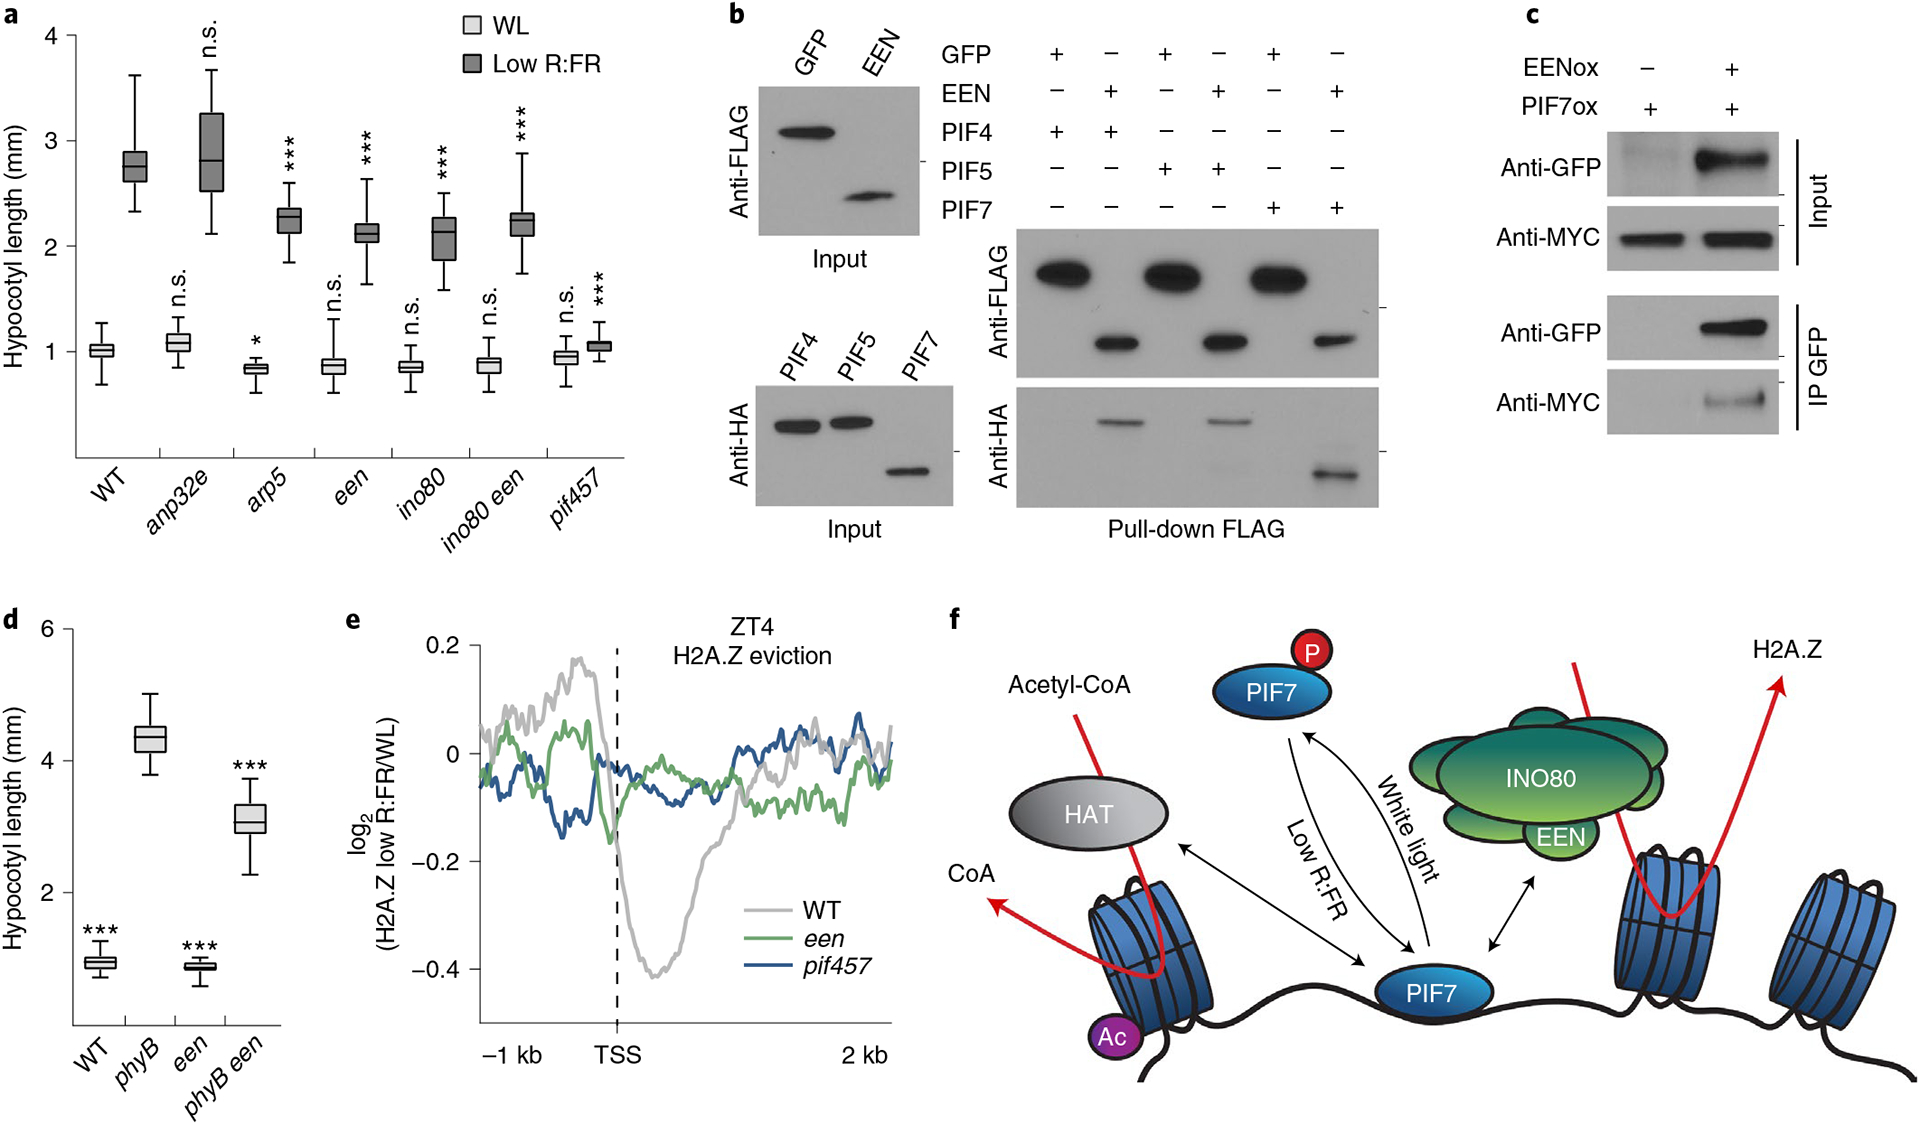
The interplay between light receptors and PHYTOCHROME-INTERACTING FACTORs (PIFs) serves as a regulatory hub that perceives and integrates environmental cues into transcriptional networks of plants1,2. Although occupancy of the histone variant H2A.Z and acetylation of histone H3 have emerged as regulators of environmentally responsive gene networks, how these epigenomic features interface with PIF activity is poorly understood3-7. By taking advantage of rapid and reversible light-mediated manipulation of PIF7 subnuclear localization and phosphorylation, we simultaneously assayed the DNA-binding properties of PIF7, as well as its impact on chromatin dynamics genome wide. We found that PIFs act rapidly to reshape the H2A.Z and H3K9ac epigenetic landscape in response to a change in light quality. Furthermore, we discovered that PIFs achieve H2A.Z removal through direct interaction with EIN6 ENHANCER (EEN), the Arabidopsis thaliana homolog of the chromatin remodeling complex subunit INO80 Subunit 6 (Ies6). Thus, we describe a PIF-INO80 regulatory module that is an intermediate step for allowing plants to change their growth trajectory in response to environmental changes.


Conflict of interest statement

Competing interests

The authors declare no competing interests.

Figures

Extended Data Fig. 1 |
Extended Data Fig. 1 |. PIF7 activity is regulated by low R:FR light exposure.
a, Hypocotyl length measurements of WT (n = 30/30), pif457 (n = 30/32, P = 0.271/P < 0.001) and pif457 expressing PIF7:PIF7:4xMYC (n = 36/36, P = 0.823/P < 0.001) in white light or in responses to low R:FR. Stars denote statistically significant differences between WT and the other genotypes for the respective light condition (two-way ANOVA, Tukey’s multiple comparisons test, n.s. P > 0.05, * P ≤ 0.05, ** P ≤ 0.01, *** P ≤ 0.001). b, Hypocotyl length measurements of WT (n = 26, P < 0.001), phyB (n = 33), phyB pif457 (n = 23, P < 0.001) and phyB pif457 expressing PIF7:PIF7:4xMYC (n = 34, P = 0,027) grown in WL. Stars denote statistically significant differences between phyB and the other genotypes (one-way ANOVA, Tukey’s multiple comparisons test, n.s. P > 0.05, * P ≤ 0.05, ** P ≤ 0.01, *** P ≤ 0.001). c, Immunoblot with anti-MyC of immunoprecipitated PIF7:4xMyC that had been treated with boiled (inactive) or native (active) λ-phosphatase (λ-PPase). PIF7:4xMyC was immunoprecipitated from 6 days old seedlings, grown in WL and harvested at ZT4. Mark next to cropped blot represent 50 kDa. d, Immunoblot analysis of pif457 PIF7:PIF7:4xMYC in LD. 6-day-old seedlings continued to grow in WL or where exposed to low R:FR at ZT0. Marks next to cropped blots represent 50 kDa (PIF7:4xMyC) or 37 kDa (ACTIN), respectively. e, Colocalization of PIF7:4xMyC and phyB containing nuclear speckles per nucleus. The number of phyB nuclear bodies (n = 105), PIF7 nuclear bodies (n = 98), and co-localized PHyB/PIF7 nuclear bodies were scored and used to calculate the percentage of co-localization of PHyB and PIF7. f, Aggregated profile shows the low R:FR dependent difference between PIF7 binding at ZT4. PIF7 binding was determined in WL and low R:FR-exposed pif457 PIF7:PIF7:4xMYC seedlings by ChIP-seq. PIF7 occupancy is shown from 1 kb upstream to 1 kb downstream of the 500 strongest PIF7 binding events. In a, b and e, boxes extend from the 25th to 75th percentiles. Middle lines represent medians. Whiskers extend to the smallest and largest values, respectively.
Extended Data Fig. 2 |
Extended Data Fig. 2 |. Low R:FR light manipulates H2A.Z dynamics.
a, Heatmap visualizes absolute H2A.Z of all Arabidopsis thaliana protein-coding genes (TAIR10) at the indicated time points and light treatments. H2A.Z occupancy was determined by ChIP-seq in WT seedlings and calculated as the log2 fold change between H2A.Z ChIP and IgG control sample. b, AnnoJ genome browser screenshot visualizes the light quality-dependent H2A.Z occupancy at the COL5 gene at ZT0, ZT8 and ZT16. The WT IgG track serves as a control and all tracks were normalized to their sequencing depth. c, Quantification of H2A.Z levels at the gene body of COL5 is shown. Occupancy of H2A.Z was determined by ChIP-seq in one experiment and calculated as the ratio between H2A.Z and IgG control. d, Schematic overview illustrates the experimental setup that was used to investigate chromatin dynamics in low R:FR light responses for experiments shown in Figure 3c to e. e,f, Alternative presentation of results shown in Figure 3c and 3d. Aggregated profiles visualize low R:FR-induced H2A.Z loss and incorporation after two hours of low R:FR exposure (e), and after an additional two-hour-long WL recovery phase (f). Profiles are shown for genes that are differentially expressed after two hours of low R:FR exposure.
Extended Data Fig. 3 |
Extended Data Fig. 3 |. Low R:FR light exposure induces global PIF7 DNA binding.
a, Levels of H2A.Z at ATHB2 in WT and pif457 seedlings at the indicated time points are shown. Occupancy of H2A.Z was determined by ChIP-seq (n = 1) and calculated as the ratio between H2A.Z and IgG. b, Aggregated profiles visualize the low R:FR-mediated activation of PIF7 after short low R:FR exposures (5, 10 and 30 min). PIF7 binding was determined in WL and low R:FR-exposed pif457 PIF7:PIF7:4xMYC seedlings by ChIP-seq and was calculated as the ratio between H2A.Z ChIP-seq samples and IgG control sample. PIF7 occupancy is shown from 1 kb upstream to 1 kb downstream of the 500 strongest PIF7 binding events. c, Bar plot illustrates increase of low R:FR-induced PIF7 DNA binding events. PIF7 binding events were determined by GEM through the direct comparison of the respective low R:FR-exposed and WL-exposed PIF7 ChIP-seq replicates (n = 3).
Extended Data Fig. 4 |
Extended Data Fig. 4 |. Low R:FR induced H3K9 hyperacetylation depends on PIFs.
a, Aggregated profiles visualize the increase of H3K9ac at the most dynamic 200 genes after short low R:FR exposures (5, 10 and 30 min). H3K9ac occupancy was determined in WL and low R:FR-exposed pif457 PIF7:PIF7:4xMYC seedlings by ChIP-seq and was calculated as the ratio between WL and low R:FR-treated H3K9ac ChIP-seq samples. b, AnnoJ genome browser screenshot visualizes PIF7 binding and H3K9 acetylation at the ATHB2 gene and its closest relatives (ATHB4, HAT2, HAT3). Genome-wide occupancy of PIF7 and H3K9ac under constant light conditions was determined in the same pif457 PIF7:PIF7:4xMYC chromatin by ChIP-seq whereas under LD conditions at ZT4, WT (H3K9ac), pif457 (H3K9ac) and pif457 PIF7:PIF7:4xMYC (PIF7) chromatin was used. All tracks were normalized to the respective sequencing depth. The areas marked in red indicate PIF7 binding and H3K9 hyperacetylation. c, Quantification of relative H3K9ac levels at the promoters of ATHB2, ATHB4, HAT2 and HAT3 in low R:FR-exposed pif457 PIF7:PIF7:4xMYC seedlings. H3K9ac occupancy was calculated as the ratio between the respective ChIP-seq sample from one experiment and the WT IgG control. d, Aggregated profiles visualize the increase of H3K9ac at the most dynamic 200 genes after 4 hours of low R:FR exposure at ZT4. H3K9ac occupancy was determined in WL and low R:FR-exposed WT and pif457 seedlings by ChIP-seq and was calculated as the ratio between WL and low R:FR-treated H3K9ac ChIP-seq samples. e, Quantification of relative H3K9ac levels at the promoters of ATHB2, ATHB4, HAT2 and HAT3 in WL and low R:FR-exposed WT and pif457 seedlings. H3K9ac occupancy was calculated from one experiment as the ratio between the H2A.Z ChIP-seq sample and the WT IgG control.
Extended Data Fig. 5 |
Extended Data Fig. 5 |. PIF-EEN/INO80C interaction and een mutant complementation.
a, Hypocotyl length of WT (n = 15/17, P < 0.001), pif457 (n = 17/13, P = 0.996), een (n=14/14, P < 0.001) and pif457 een (n = 12/15, P = 0.994) seedlings grown in WL or in response to low R:FR. b, Pull-down assay with in vitro translated proteins. ARP4, ARP5, ARP6, EEN, INO80 insertion domain (INO80Insert), and RVB2 were tagged with FLAG and PIF4 with HA. FLAG:GFP served as negative control. c, Hypocotyl length of WT (n = 16/18), een (n = 19/18, P = 0.406/P < 0.001) and een UBQ10:GFP:EEN line #3 (n = 15/17, P > 0.999/P = 0.49), #7 (n = 15/17, P > 0.999/P = 0.319) and #11 (n = 16/17, P > 0.999/P = 0.977). d, Aggregated H2A.Z profiles of all Arabidopsis genes (TAIR10) in WL and low R:FR-treated WT and een seedlings show H2A.Z occupancy around the TSS. e, Spearman’s correlation plot shows the correlation of read coverages between WL and low R:FR-treated WT and een H2A.Z ChIP-seq samples. Clustering was determined by the degree of correlation. f, Box plots show level of H2A.Z loss at the 20 most dynamic genes in WT, pif457 and een seedlings at ZT4 for three independent experiments. Boxes extend from the 25th to 75th percentiles. Middle lines represent the median. Stars denote statistically significant differences in comparison to WT (one-way ANOVA, Tukey’s multiple comparisons test, n.s. P > 0.05, * P ≤ 0.05, ** P ≤ 0.01, *** P ≤ 0.001). g, Hypocotyl length measurements of WT (n = 37/35), een (n = 30/31, P = 0.806/P < 0.001) and een UBQ10:GFP:INO80C line #5 (n = 40/38, P = 0.877/P = 0.145), #7 (n = 37/37, P > 0.999/ P > 0.999) and #17 (n = 38/37, P > 0.999/ P > 0.999). h, Pull-down assay with in vitro translated proteins. INO80C was tagged with FLAG and PIF4 with HA. FLAG:GFP served as a negative control. In a, c and g, boxes extend from the 25th to 75th percentiles. Middle lines represent medians. Whiskers extend to the smallest and largest values, respectively. Stars denote statistically significant differences between light conditions (a) or versus WT for the respective light condition (c and g) (two-way ANOVA, Tukey’s multiple comparisons test, n.s. P > 0.05, * P ≤ 0.05, ** P ≤ 0.01, *** P ≤ 0.001).
Extended Data Fig. 6 |
Extended Data Fig. 6 |. PIF7 construct and light conditions.
a, The PIF7:PIF7:4xMYC construct consists of a 4064 bp genomic PIF7 fragment starting at 2500 bp upstream of the PIF7 start codon and is fused to a 4xMyC tag. b, Light spectra and fluence rate for white light and low R:FR conditions. c, Light intensities in μmols m−2 s−1 and the ratio between red and far-red light for the two light conditions used in this study.
Fig. 1 |
Fig. 1 |. Role of PIF7 and phyB in low R:FR–induced hypocotyl growth.
a,b, Hypocotyl length measurements. WT (n = 23/20, P < 0.001), pif4 (n = 27/22, P < 0.001), pif5 (n = 22/24, P < 0.001), pif7 (n = 23/24, P < 0.001), pif45 (n = 27/26, P < 0.001), pif47 (n = 26/28, P < 0.001), pif57 (n = 25/25, P < 0.001), pif457 (n = 25/24, P = 0.275), pif1345 (n = 21/16, P < 0.001) and pif13457 (n = 23/22, P = 0.494) seedlings grown in WL or in response to low R:FR (a) and WT (n = 22), phyB (n = 22, P < 0.001), phyB pif4 (n = 21, P < 0.001), phyB pif5 (n = 26, P < 0.001), phyB pif7 (n = 22, P < 0.001), phyB pif45 (n = 20, P < 0.001), phyB pif47 (n = 22, P < 0.001), phyB pif57 (n = 26, P < 0.001) and phyB pif457 (n = 27, P = 0.218) seedlings grown in WL (b). Stars denote statistically significant differences between light conditions (a) or between WT and mutants (b) (two-way analysis of variance (ANOVA) (a) or one-way ANOVA (b), Tukey’s multiple comparisons test, n.s. (not significant) P > 0.05, *P ≤ 0.05, **P ≤ 0.01, ***P ≤ 0.001). c, Immunoblot of pif457 PIF7:PIF7:4xMYC in LD. Six-day-old seedlings continued to grow in WL or where exposed to low R:FR at ZT0. Marks next to cropped blots represent 50 kDa (PIF7:4xMyC) or 37 kDa (ACTIN), respectively. d, Immunoblot analysis of pif457 PIF7:PIF7:4xMYC and phyB pif457 PIF7:PIF7:4xMYC seedlings (6-day-old, LD, WL). Marks next to cropped blots represent 50 kDa (PIF7:4xMyC) or 37 kDa (ACTIN), respectively. e, Quantification of percentages of nuclei with PIF7:4xMyc nuclear bodies as shown in f. Five seedlings from each condition with at least 15 randomly selected nuclei per seedling were examined. f, Subnuclear localization patterns of PIF7:4xMyc and phyB in cotyledon epidermal nuclei of 6-day-old pif457 PIF7:PIF7:4xMYC and phyB pif457 PIF7:PIF7:4xMYC seedlings grown in LD. Seedlings were fixed at ZT4 (WL) or after a subsequent 30 min low R:FR treatment. PIF7:4xMyC (red) and phyB (green) were labeled by immunolocalization using anti-MyC and anti-phyB antibodies, respectively. Nuclei were stained with DAPI (blue). The percentage of nuclei with the indicated pattern, including s.e.m., is shown in merged images; n indicates the number of nuclei analyzed. Scale bar, 5 μm. In a, b and e, boxes extend from the 25th to 75th percentiles. Middle lines represent medians. Whiskers extend to the smallest and largest values, respectively.
Fig. 2 |
Fig. 2 |. Low R:FR exposure induces genome-wide binding of PIF7.
a, The CACGTG motif was the top-ranked motif in PIF7 ChIP–seq derived from low R:FR–exposed pif457 PIF7:PIF7:4xMYC seedlings at ZT4. Motif discovery was done through MEME analysis using the 500 top-ranked peaks. b, Pie chart illustrating the genomic distribution of PIF7-binding events after low R:FR exposure at ZT4. Numbers are proportions in percent. c, Gene ontology enrichment analysis reveals an enrichment for auxin signaling in the 500 top-ranked PIF7 targets. d, Heat map visualizing the low R:FR–induced DNA binding (log2 (fold change)) of PIF7 in pif457 PIF7:PIF7:4xMYC seedlings at ZT4. PIF7 DNA binding is shown for the top 500 binding sites that display the strongest low R:FR–induced PIF7 binding at ZT4 with each row of the heat map representing one binding event. kb, kilobase. e, AnnoJ genome browser screenshot visualizing PIF7 binding at ATHB2, HFR1 and PHYB. All tracks were normalized to the respective sequencing depth. Shown are three replicates (Rep1 to Rep3) per treatment. Ctrl, control.
Fig. 3 |
Fig. 3 |. Low R:FR light exposure controls genome-wide H2A.Z occupancy.
a, Aggregated profiles visualizing low R:FR–induced H2A.Z removal at ZT0, ZT8 and ZT16 in WT seedlings. Reduction of H2A.Z is visualized from 1 kb upstream to 2 kb downstream of the transcription start site (TSS). Low R:FR–induced H2A.Z loss was calculated as the log2 (fold change) between WL and low R:FR–exposed H2A.Z ChIP–seq samples. Genes that show ≥1.3-fold low R:FR–induced H2A.Z depletion at ZT0 (551 genes), ZT8 (886 genes) and ZT16 (1,194 genes) were included in our analysis. b, Venn diagram showing overlap between genes that show low R:FR–induced H2A.Z depletion (≥1.3-fold) at ZT0, ZT8 and ZT16. c,d, Aggregated profiles visualizing low R:FR–induced H2A.Z loss and incorporation after 2 hours of low R:FR exposure (c) and after an additional two-hour-long WL recovery phase (d). Profiles are shown for genes that are differentially expressed after 2 hours of low R:FR exposure. e, Quantification of H2A.Z levels at the gene body of ATHB2 and the 50 genes (top 50) that show the strongest H2A.Z loss after 2 hours of low R:FR exposure. Occupancy of H2A.Z was determined by ChIP–seq and calculated as the ratio between H2A.Z and IgG. H2A.Z levels of WL-exposed seedlings were set to 1. Error bars represent s.e.m. (n = 50).
Fig. 4 |
Fig. 4 |. DNA binding of PIF7 initiates low R:FR–induced H2A.Z removal at its target genes.
a, Aggregated profiles display low R:FR–induced H2A.Z depletion in WT and pif457 seedlings. Loss of H2A.Z is visualized as the log2 (fold change) between WL and low R:FR–exposed H2A.Z ChIP–seq samples around the TSS of 200 genes that show strong H2A.Z loss in WT after 2 hours of low R:FR light exposure. b, Immunoblot of pif457 PIF7:PIF7:4xMYC grown in constant WL. Six-day-old seedlings were exposed to low R:FR and subsequently moved back to WL for the indicated time points. Marks next to cropped blots represent 50 kDa (PIF7:4xMyC) or 37 kDa (ACTIN), respectively. c, Heat map visualizing the low R:FR–induced DNA binding (log2 (fold change)) of PIF7 at the top 500 binding sites (strongest binding after 30 min of low R:FR exposure) in pif457 PIF7:PIF7:4xMYC seedlings at the indicated time points. d, AnnoJ genome browser screenshot visualizing PIF7 binding, H2A.Z occupancy and H3K9 acetylation at the ATHB2 gene over time, which was determined in the same chromatin (pif457 PIF7:PIF7:4xMYC) by ChIP–seq. The areas marked in red indicate the PIF7-bound regulatory region and gene body region of ATHB2. e,f, Quantification of relative PIF7 binding (red) and H2A.Z levels (blue) at ATHB2 (e) and the PIF7 core gene set (f). PIF7 binding in peak summit regions (ratio between two PIF7 ChIP–seq replicates and control) at 30 min of low R:FR exposure was set to 1 for each target gene. H2A.Z occupancy (ratio between H2A.Z ChIP–seq sample and control) at WL exposure was set to 1. mRNA expression measured in TPM (transcripts per kilobase million) at 30 min of low R:FR exposure was set to 1 for each gene. The mean ± s.e.m. in e represents levels of PIF7 (n = 2), H2A.Z (n = 2) and ATHB2 mRNA (n = 3). The mean ± s.e.m. in f represents levels of PIF7 binding, H2A.Z occupancy and mRNA expression of the PIF7 core genes (n = 20 genes examined over two independent experiments).
Fig. 5 |
Fig. 5 |. A PIF7–INO80 regulatory module facilitates low R:FR–induced H2A.Z removal.
a, Hypocotyl length measurements of WT (n = 24/20), anp32e (n = 31/22, P = 0.991/P > 0.999), arp5 (n = 31/28, P = 0.044/P < 0.001), een (n = 26/26, P = 0.478/P < 0.001), ino80 (n = 27/19, P = 0.251/P < 0.001), ino80 een (n = 27/20, P = 0.495/P < 0.001) and pif457 (n = 22/30, P = 0.996/P < 0.001) seedlings grown in WL or in response to low R:FR. Stars denote statistically significant differences between WT and mutants grown in WL or in low R:FR, respectively (two-way ANOVA, Tukey’s multiple comparisons test, n.s. P > 0.05, *P ≤ 0.05, **P ≤ 0.01, ***P ≤ 0.001. b, Pull-down assay using in vitro-translated FLAG:EEN and HA:PIF proteins. FLAG:GFP served as negative control. Marks next to cropped blots represent 25 kDa (anti-FLAG) or 50 kDa (anti-HA), respectively. c, Co-immunoprecipitation (IP) using 6-day-old seedlings overexpressing MyC-tagged PIF7 alone or in combination with GFP-tagged EEN. Marks next to cropped blots represent 37 kDa (anti-GFP) or 75 kDa (anti-MyC), respectively. d, Hypocotyl length measurements of WT (n = 22, P < 0.001), phyB (n = 16), een (n = 24, P < 0.001) and phyB een (n = 24, P < 0.001) grown in WL. Stars denote statistically significant differences between phyB and the other genotypes (one-way ANOVA, Tukey’s multiple comparisons test, n.s. P > 0.05, *P ≤ 0.05, **P ≤ 0.01, ***P ≤ 0.001). e, Aggregated profiles display low R:FR–induced H2A.Z loss in WT, een and pif457 seedlings at ZT4. Loss of H2A.Z (log2 (fold change) between WL and low R:FR–exposed H2A.Z ChIP–seq samples) is visualized around the TSS of 464 genes that show H2A.Z depletion (≥1.25-fold) after low R:FR exposure in WT seedlings. f, Model for the control of low R:FR–induced H2A.Z removal through the PIF7–INO80 regulatory module. Upon exposure to low R:FR light, PIF7 is dephosphorylated and subsequently binds to its target sites where it potentially interacts with the EEN subunit of the INO80 complex and an unknown histone acetyltransferase (HAT). Consequently, gene-body-localized H2A.Z is removed, H3K9 in regulatory regions is acetylated (Ac) and gene expression of PIF7 target genes will be initiated. In a and d, boxes extend from the 25th to 75th percentiles. Middle lines represent medians. Whiskers extend to the smallest and largest values, respectively.

References

    1. Leivar P & Monte E PIFs: systems integrators in plant development. Plant Cell 26, 56–78 (2014). - PMC - PubMed
    1. Paik I, Kathare PK, Kim JI & Huq E Expanding roles of PIFs in signal integration from multiple processes. Mol. Plant 10, 1035–1046 (2017). - PMC - PubMed
    1. Kumar SV et al. Transcription factor PIF4 controls the thermosensory activation of flowering. Nature 484, 242–245 (2012). - PMC - PubMed
    1. van der Woude LC et al. HISTONE DEACETYLASE 9 stimulates auxin-dependent thermomorphogenesis in Arabidopsis thaliana by mediating H2A.Z depletion. Proc. Natl Acad. Sci. USA 116, 25343–25354 (2019). - PMC - PubMed
    1. Coleman-Derr D & Zilberman D Deposition of histone variant H2A.Z within gene bodies regulates responsive genes. PLoS Genet. 8, e1002988 (2012). - PMC - PubMed

Publication types

MeSH terms