. 2021 Aug;24(8):1163-1175.
doi: 10.1038/s41593-021-00872-y. Epub 2021 Jun 17.

Spatial and cell type transcriptional landscape of human cerebellar development

Affiliations

Spatial and cell type transcriptional landscape of human cerebellar development

Kimberly A Aldinger et al. Nat Neurosci. 2021 Aug.

Abstract

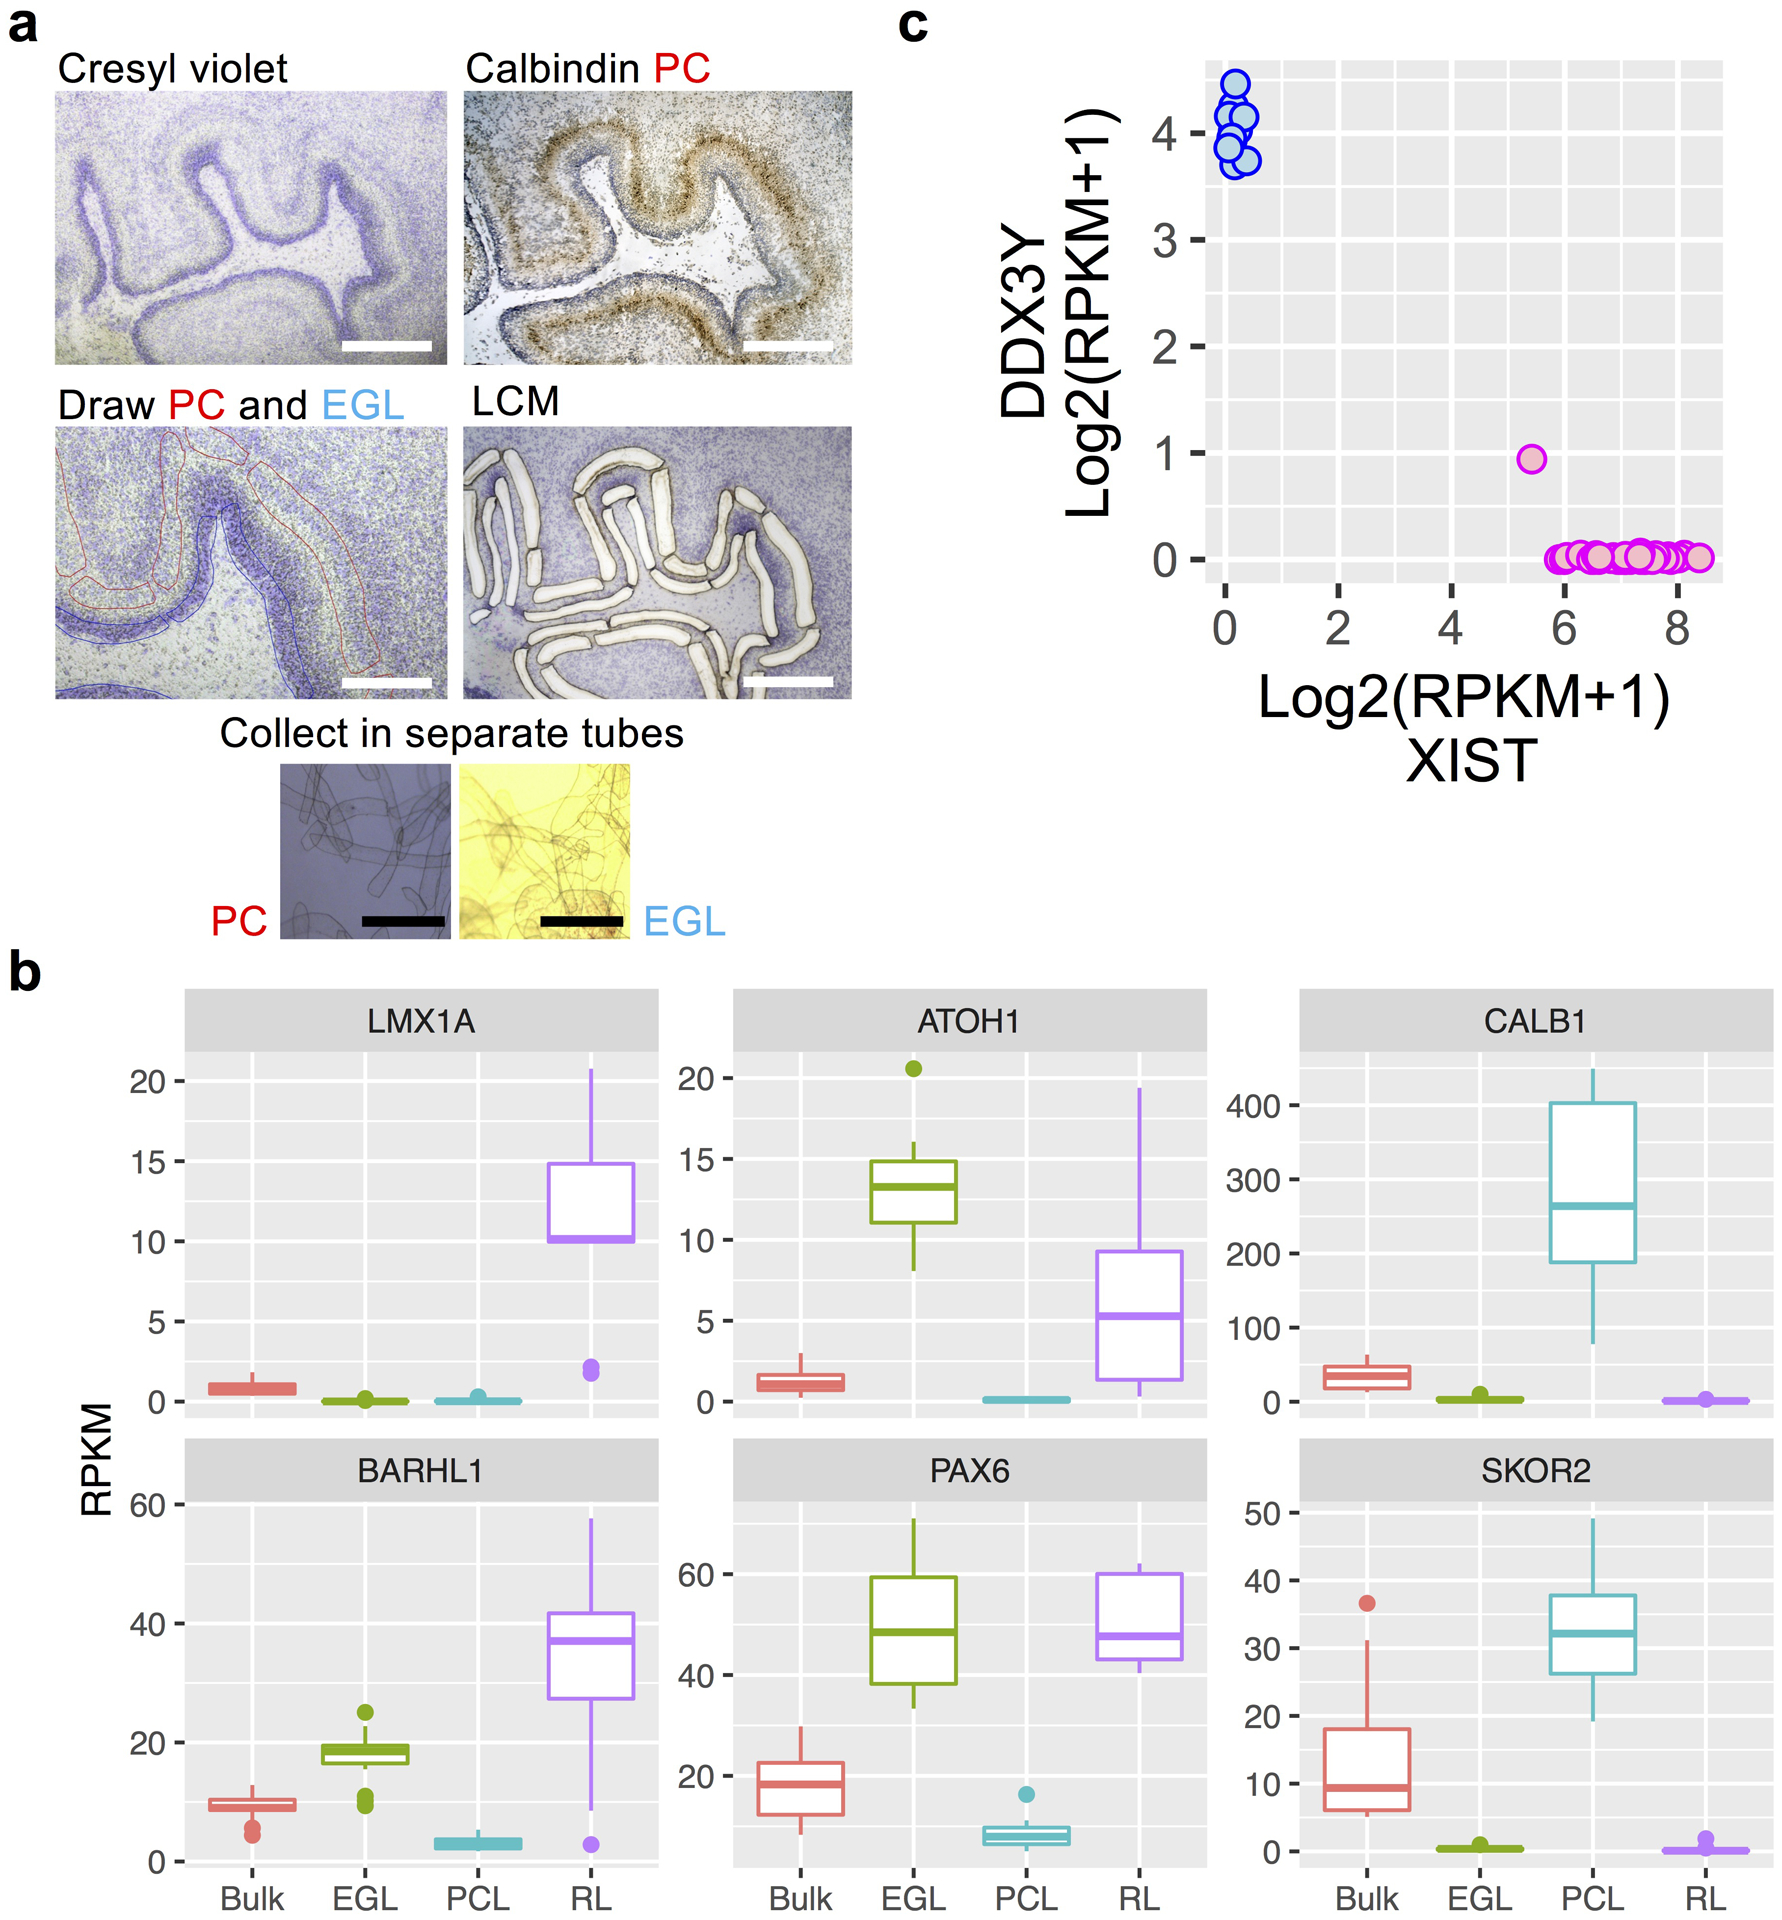
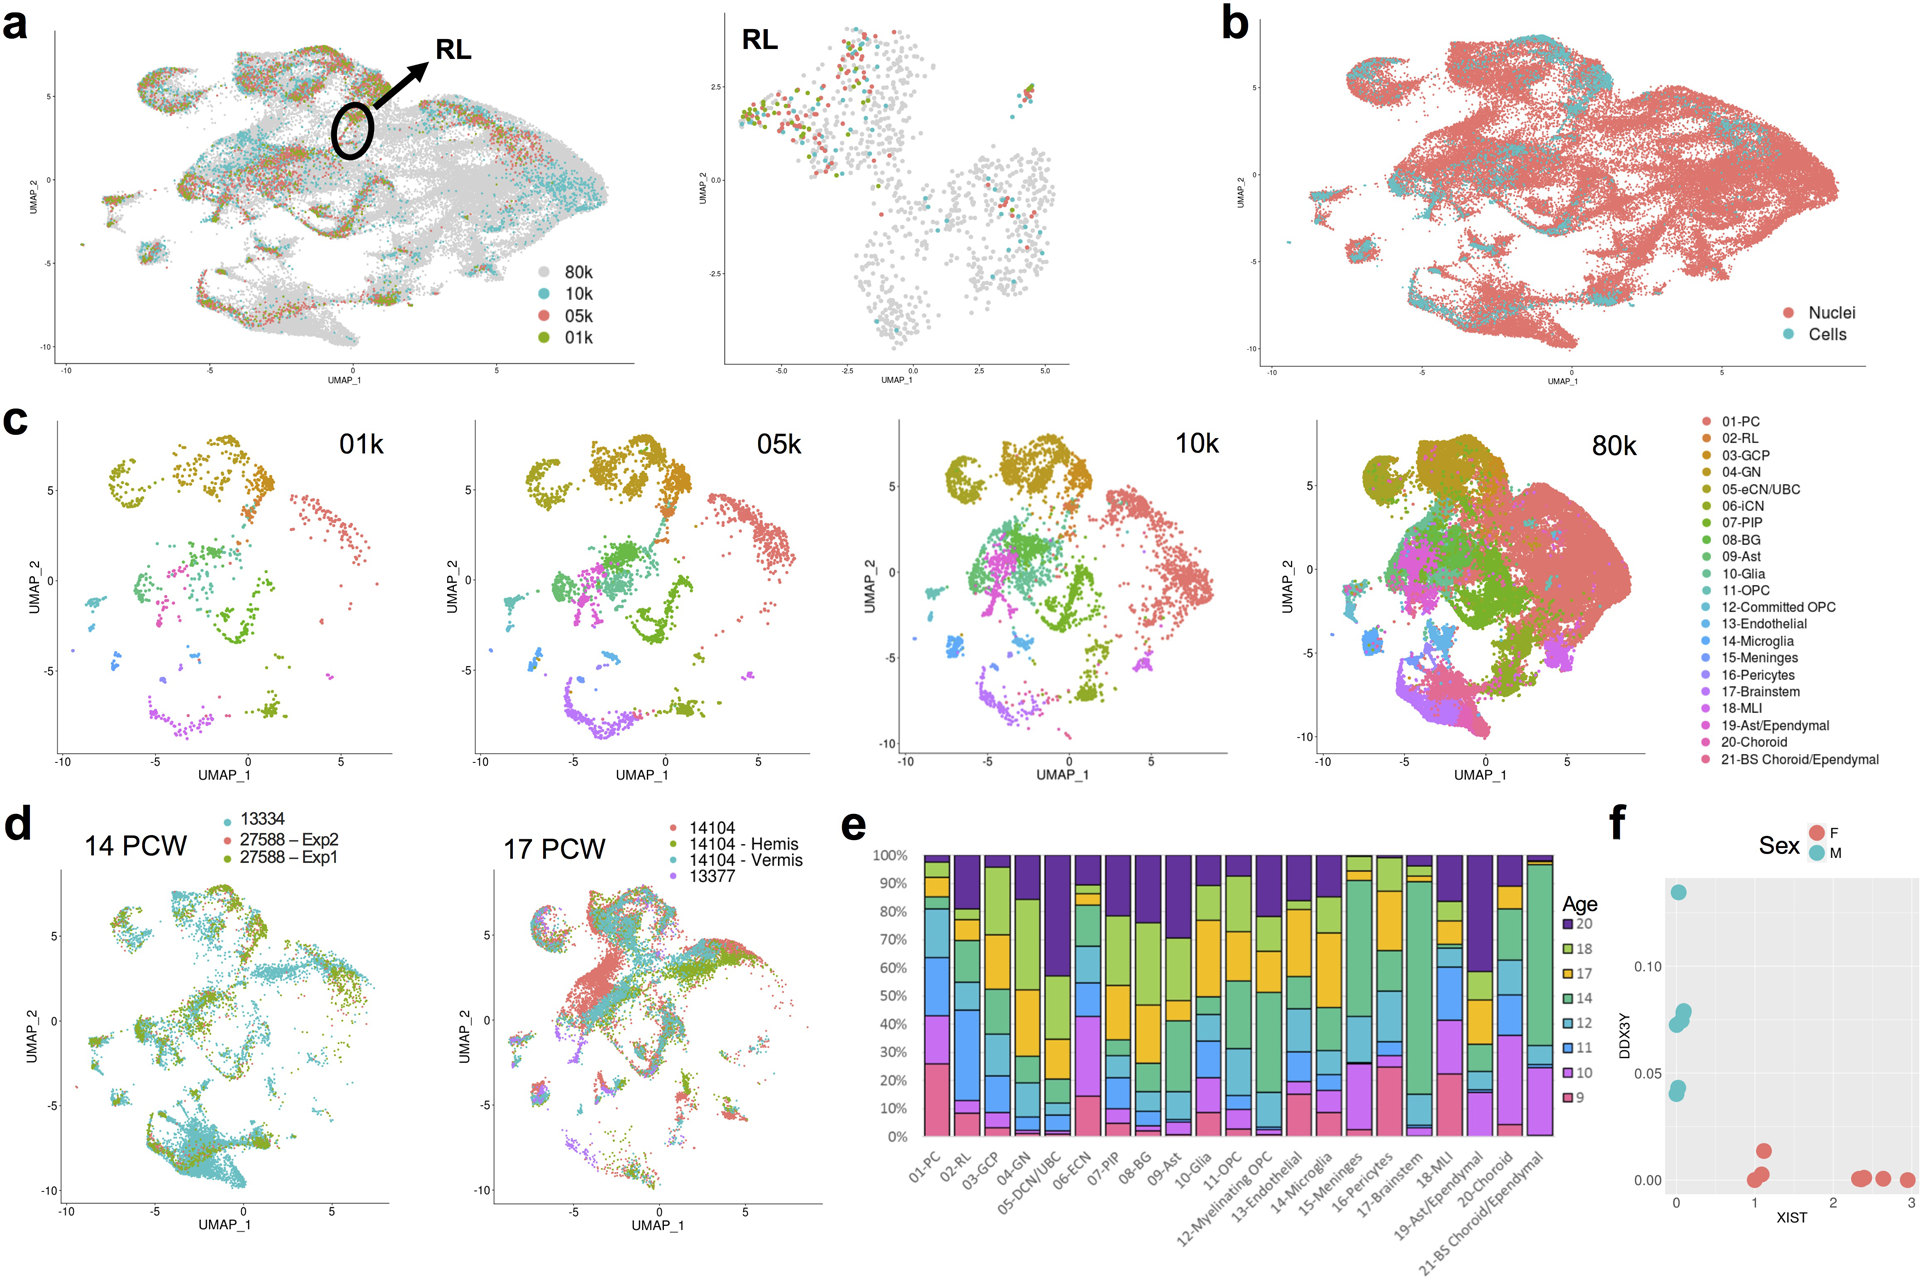
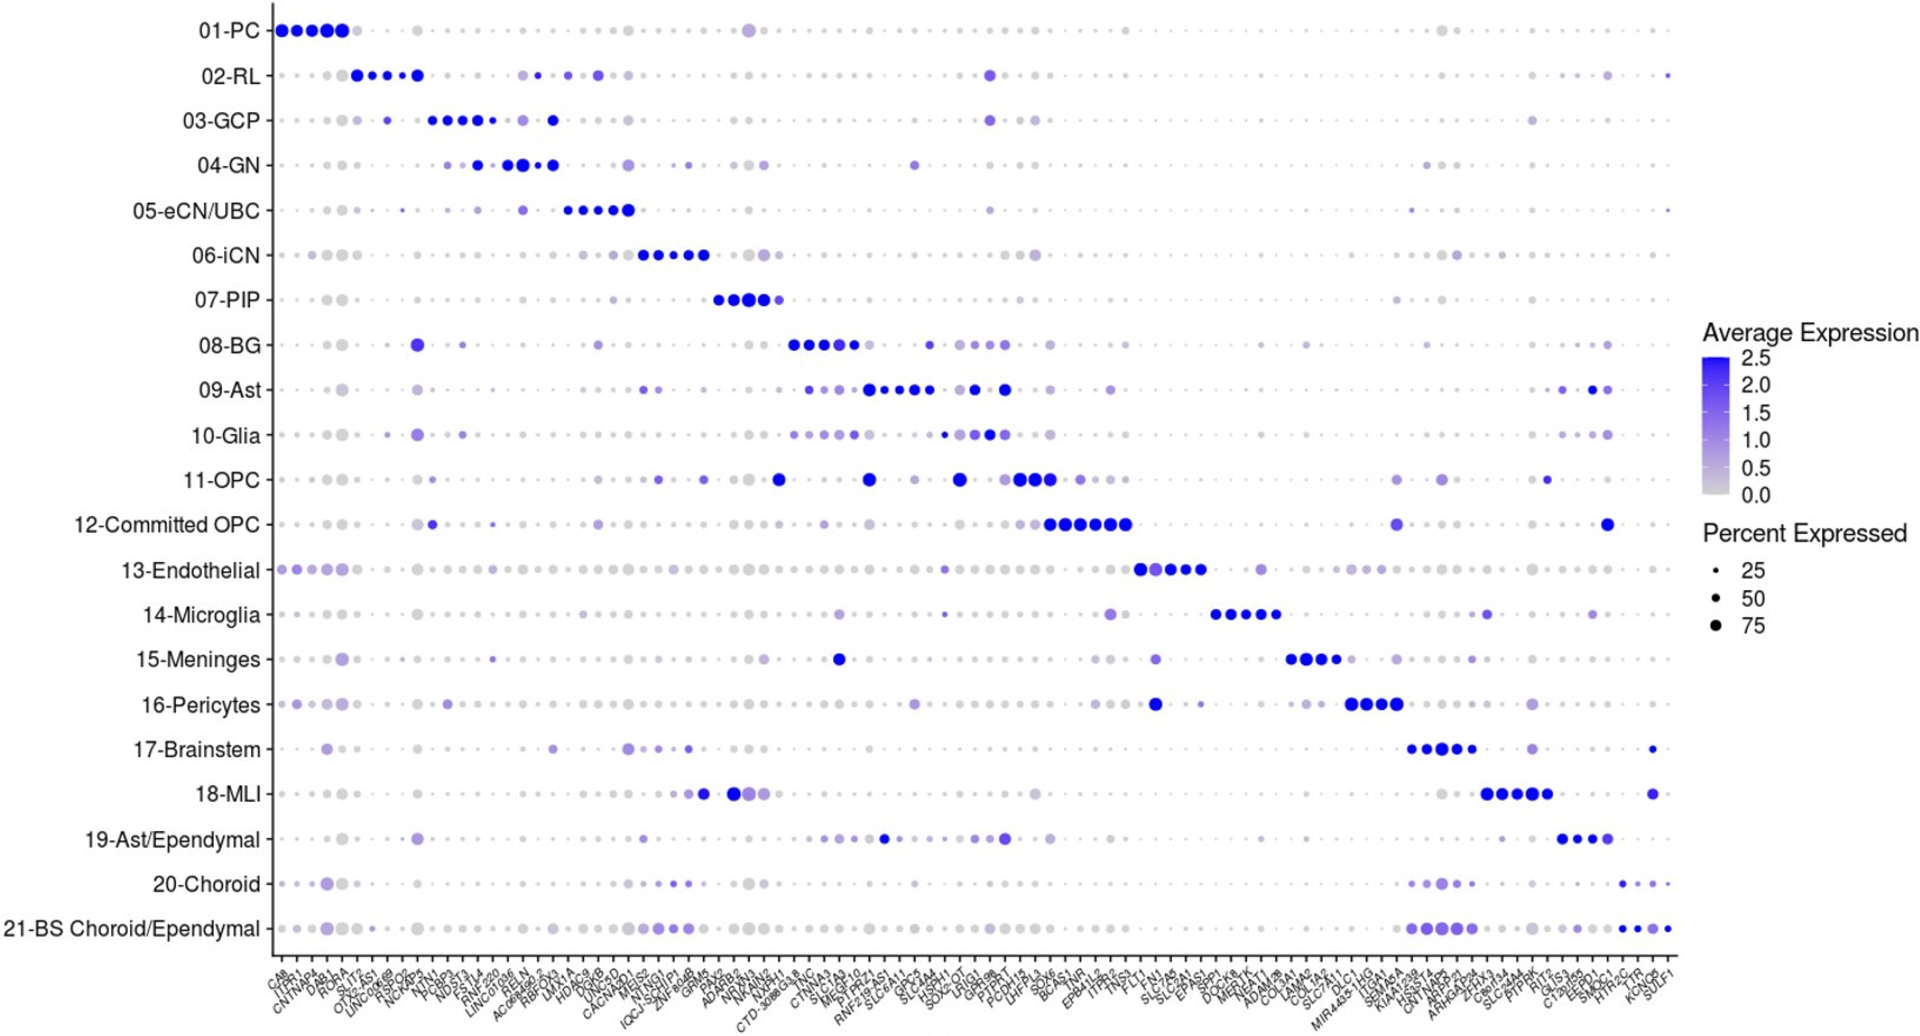
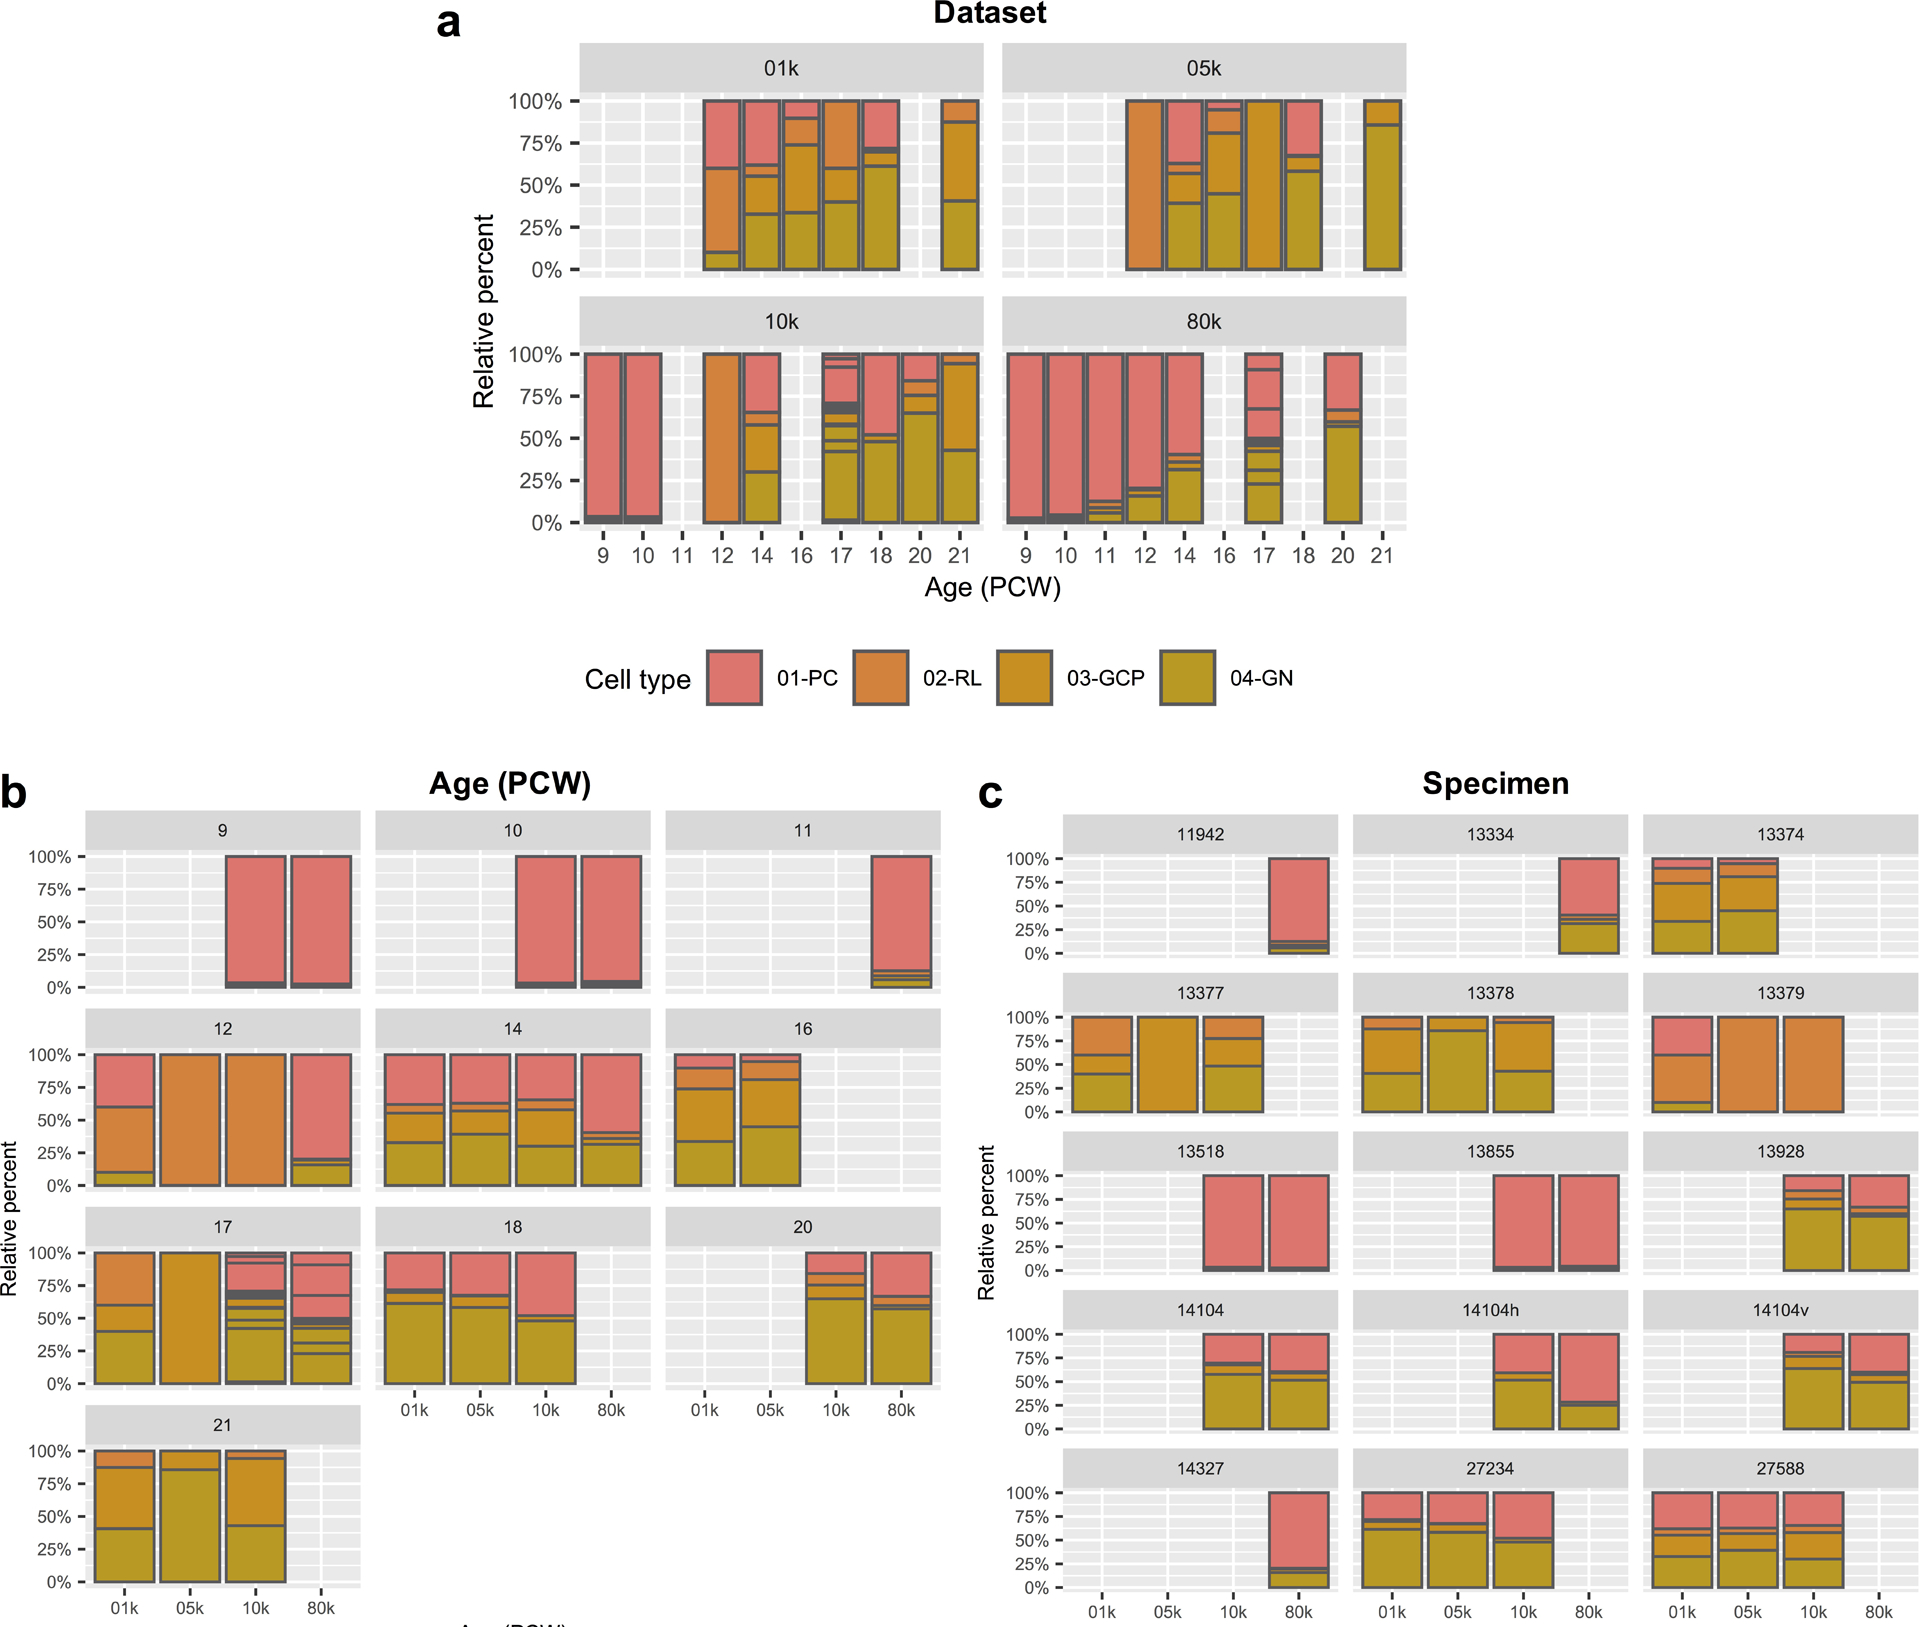
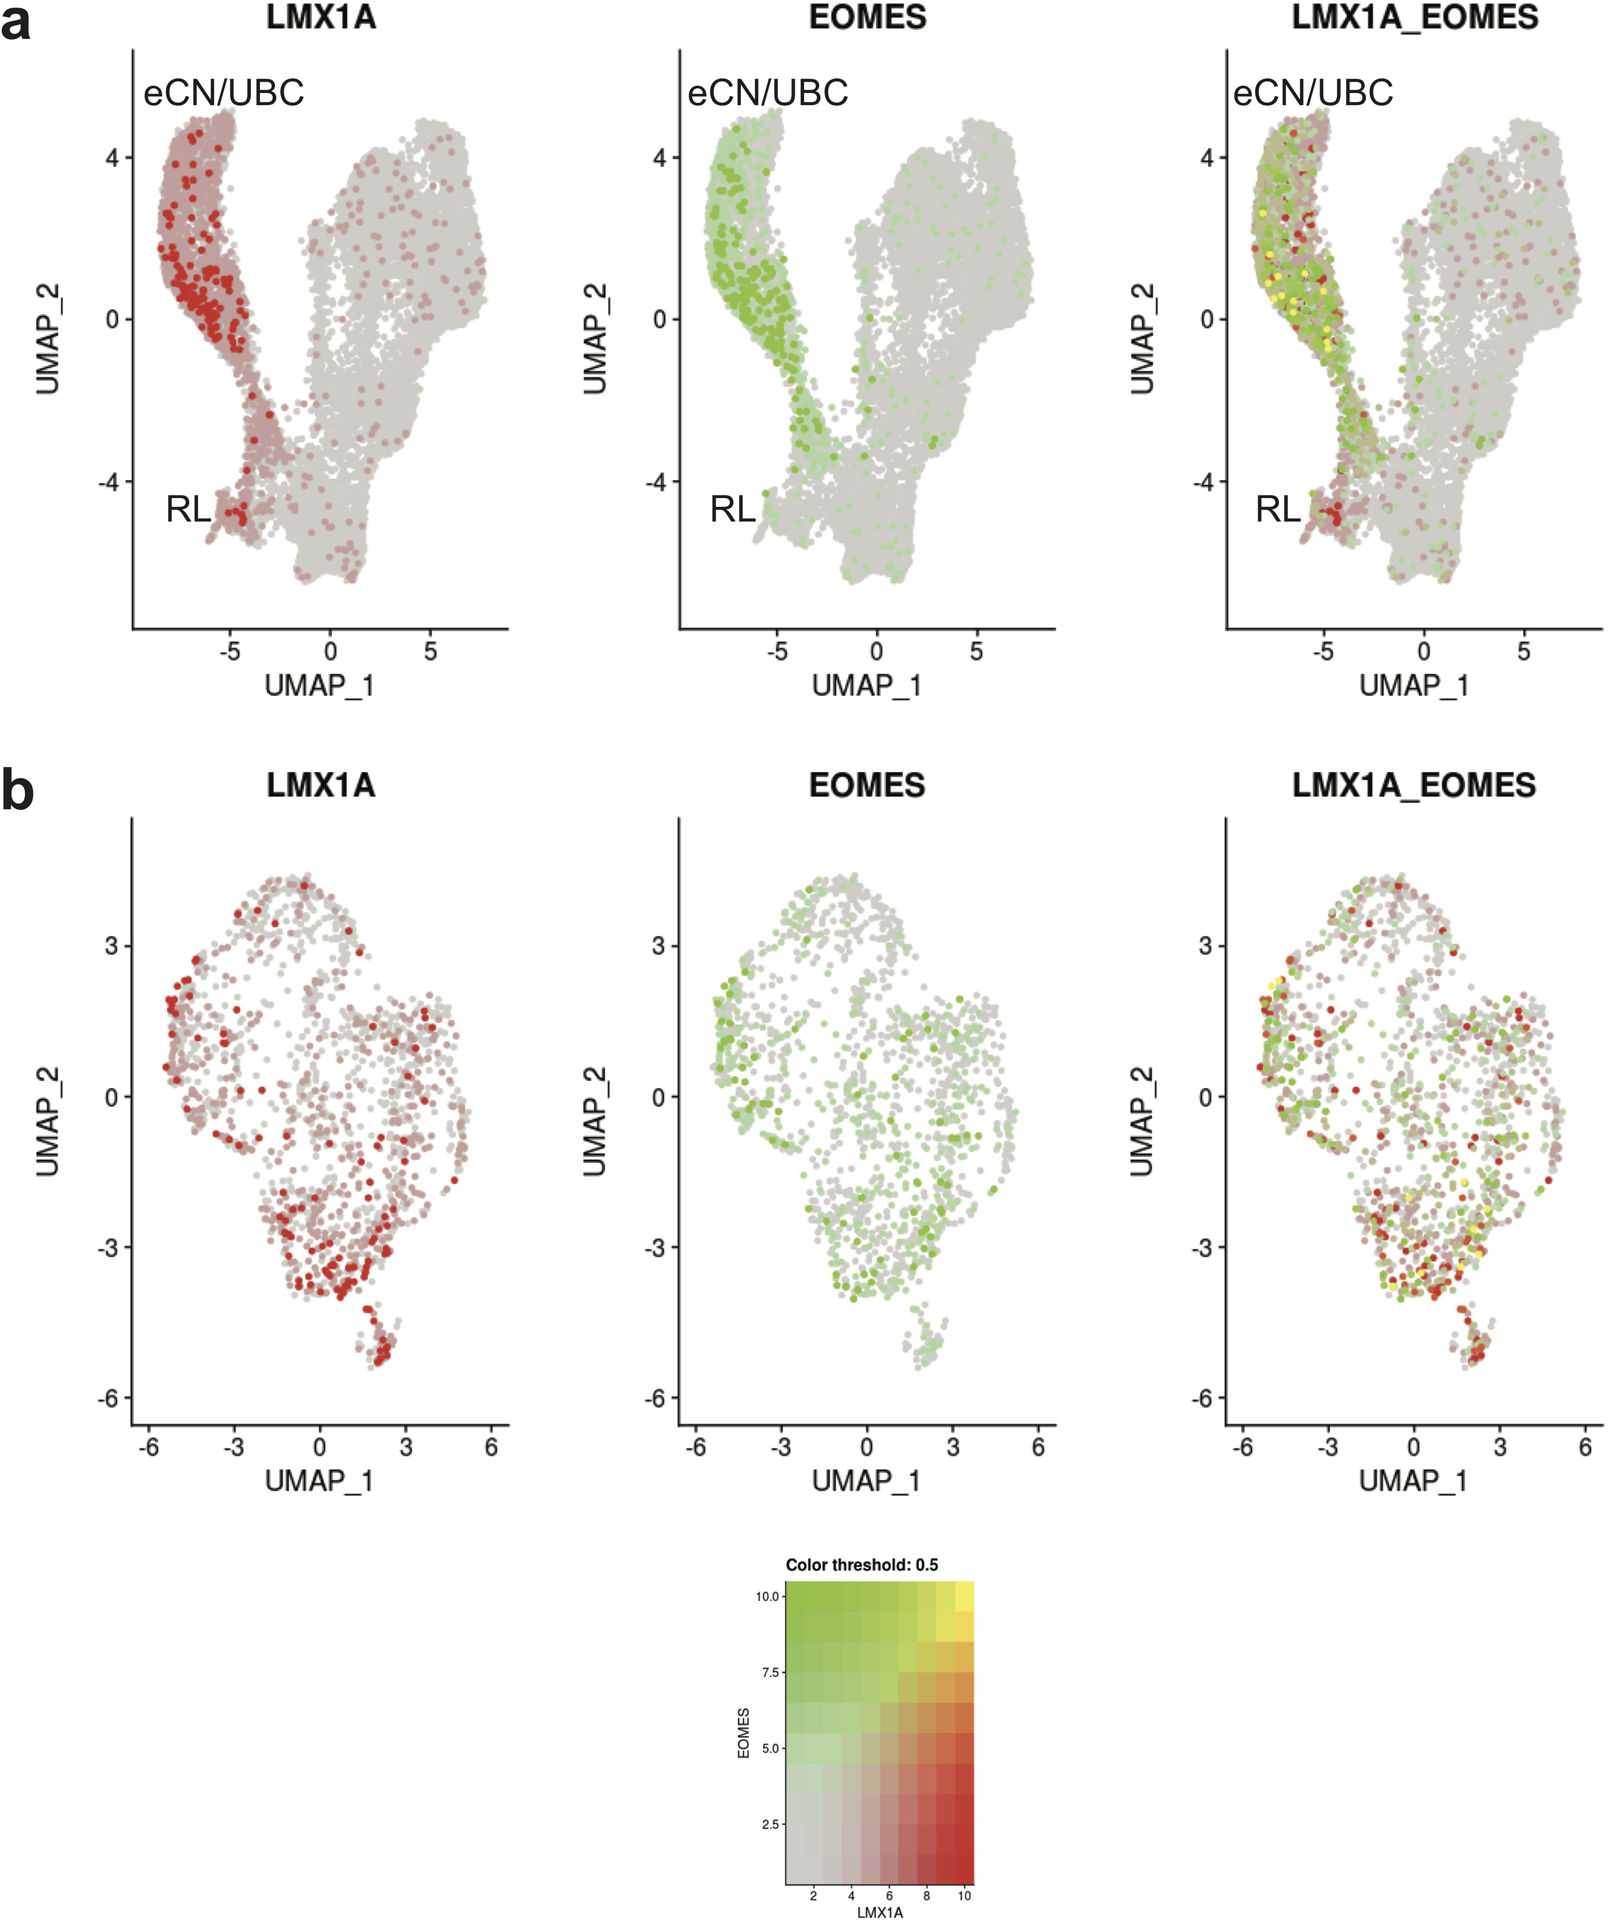
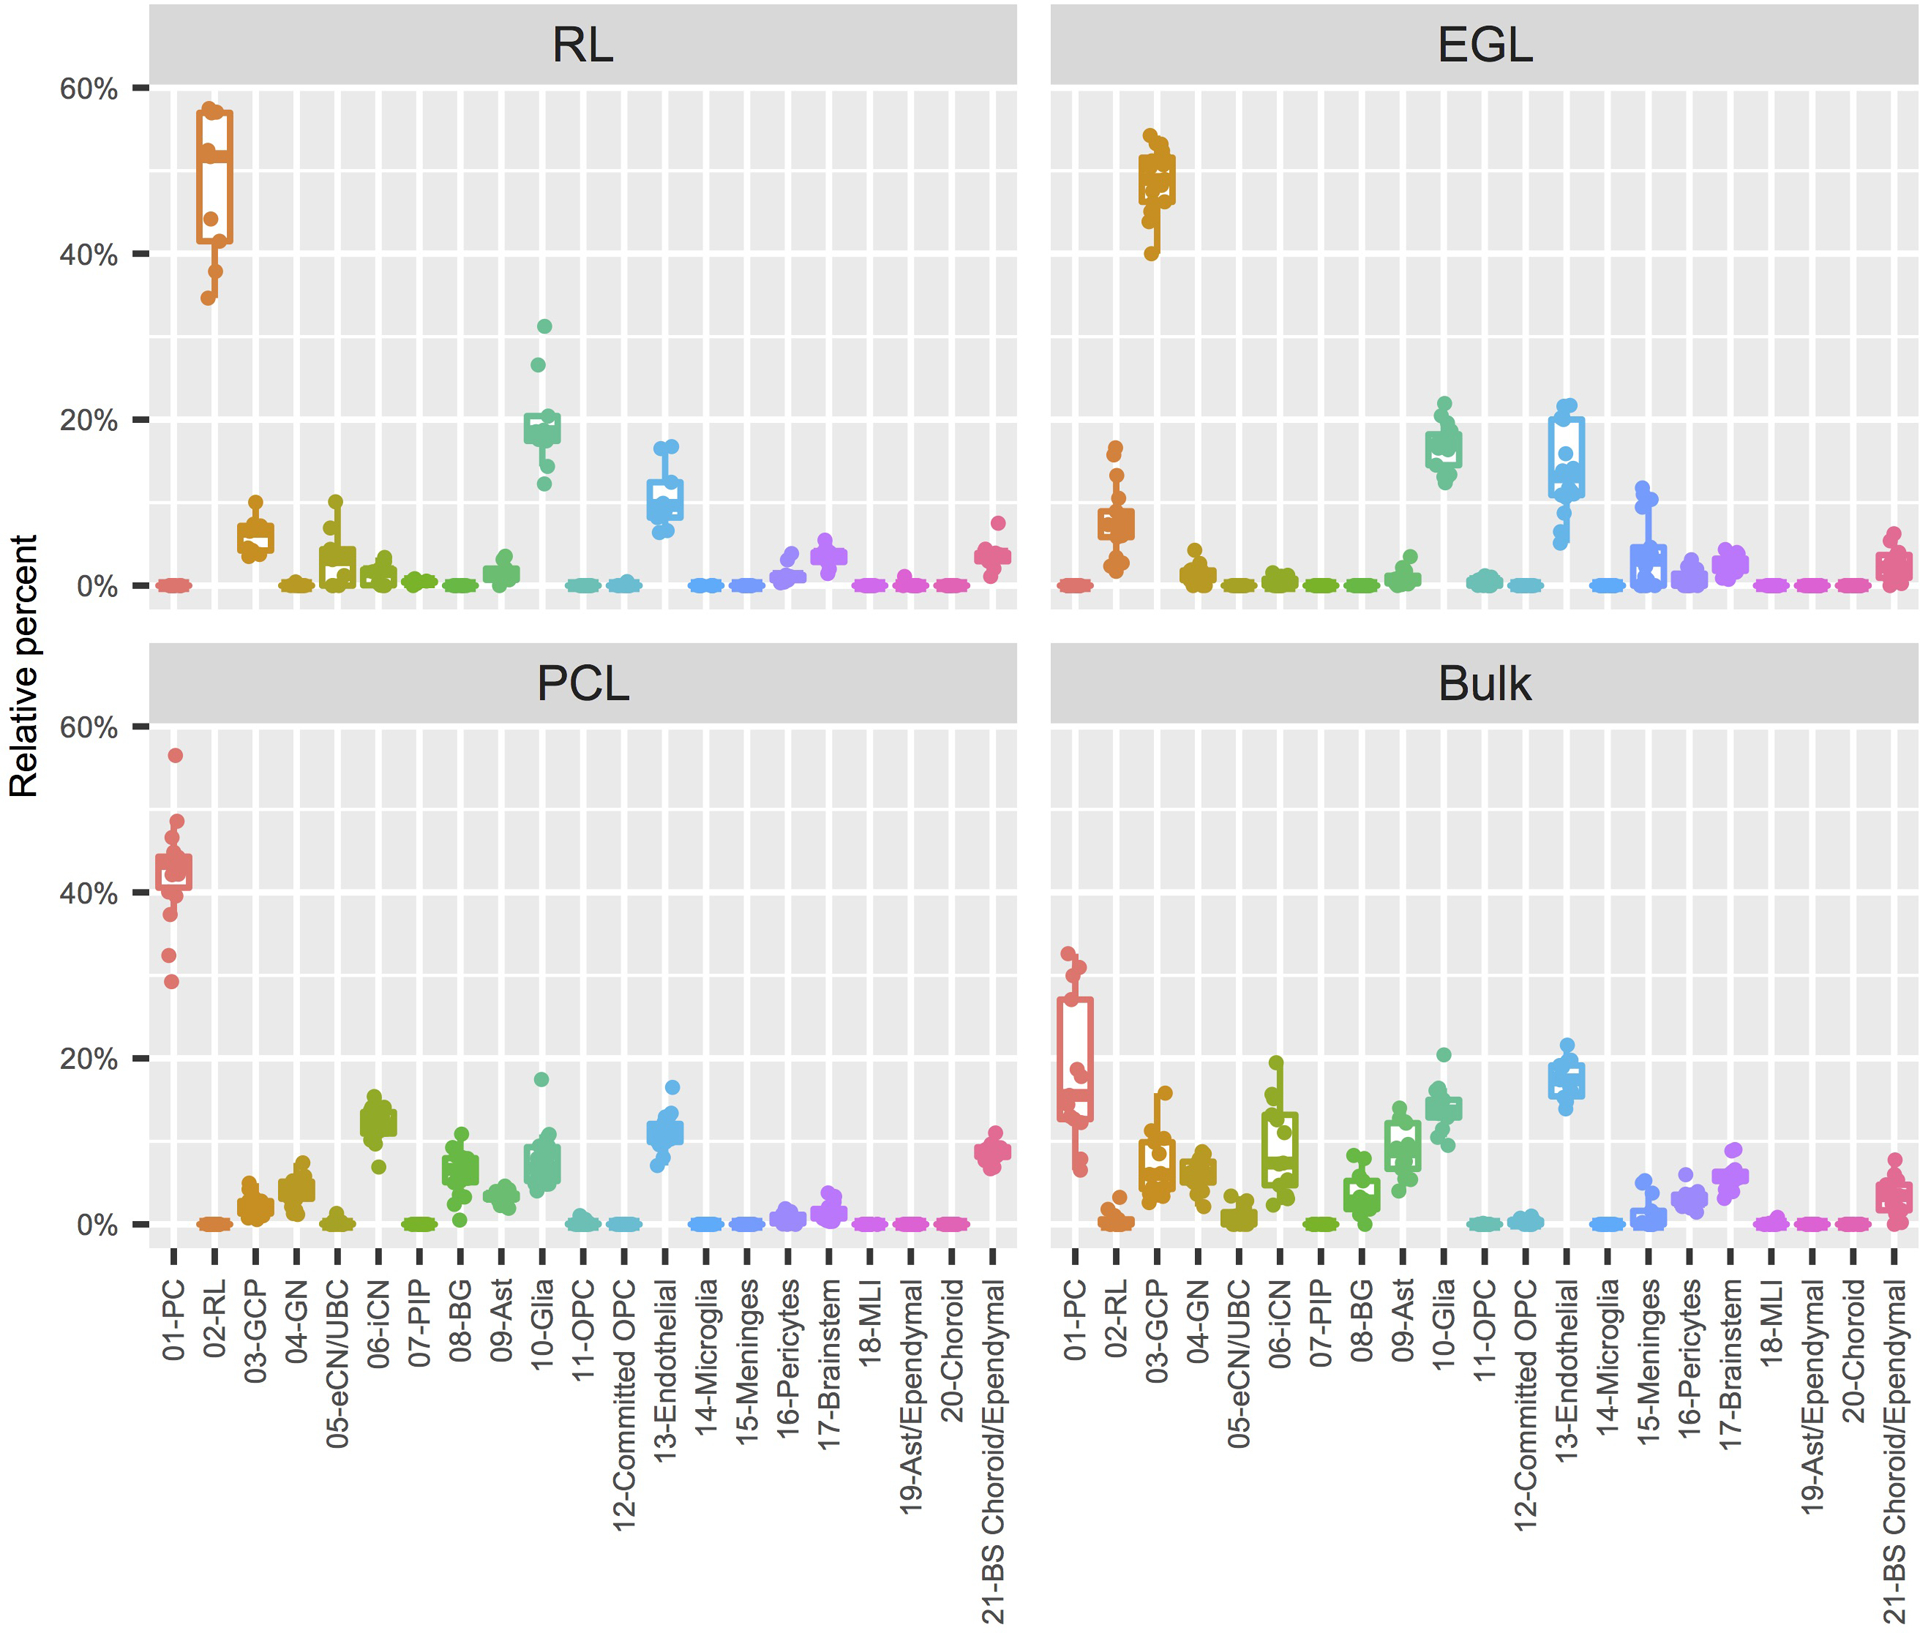
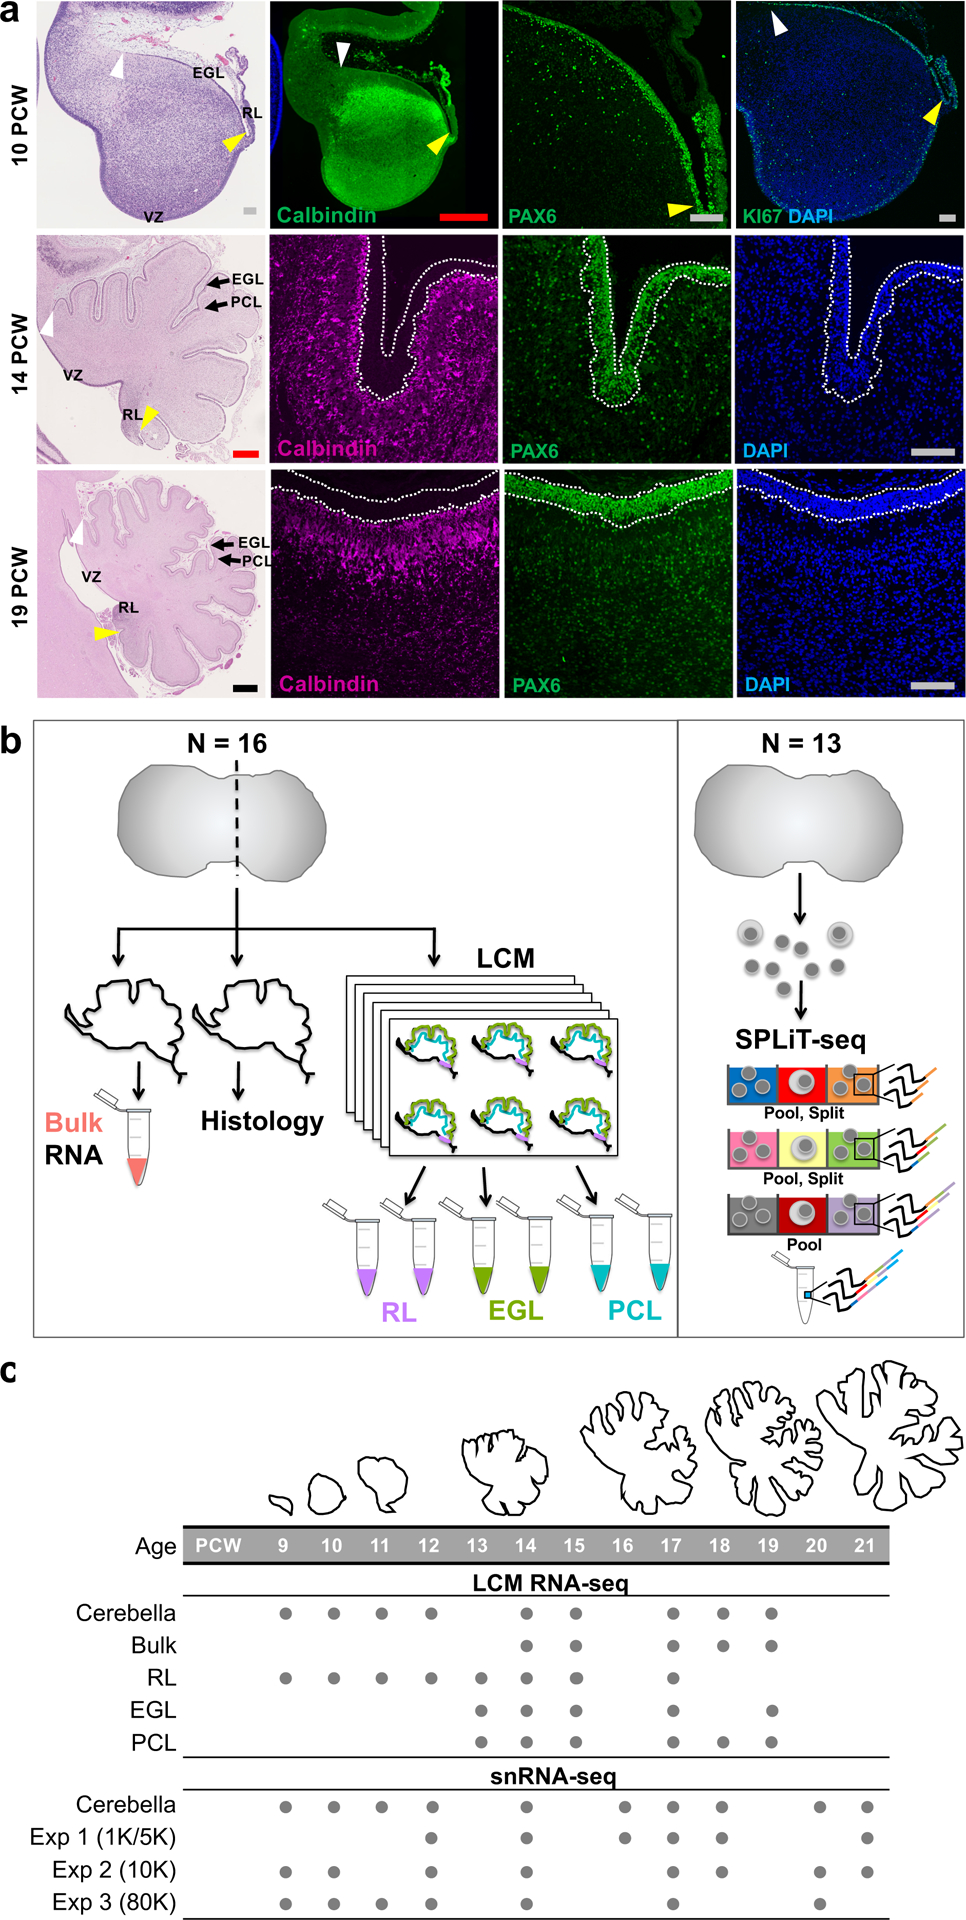
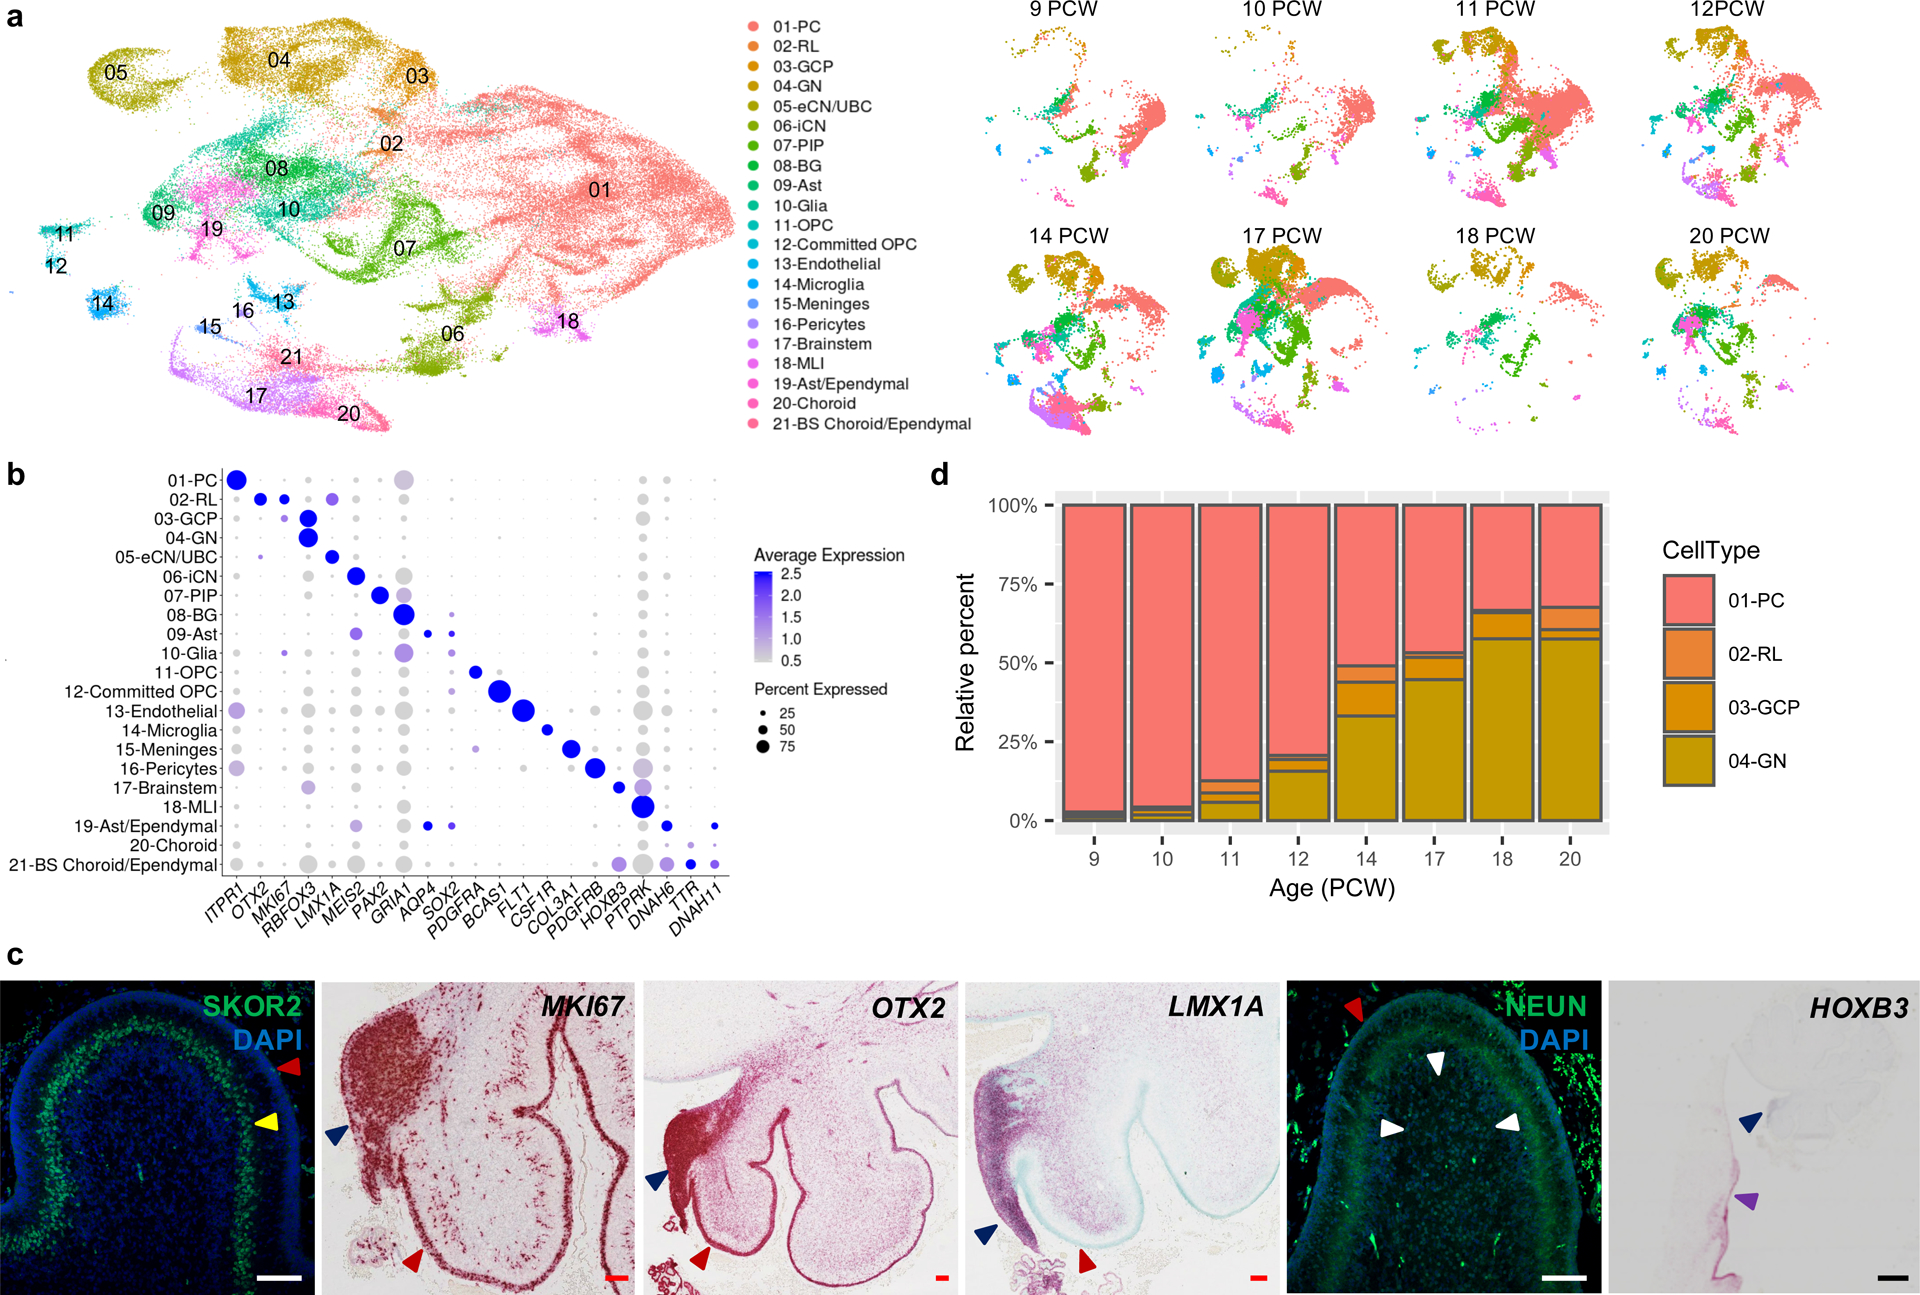
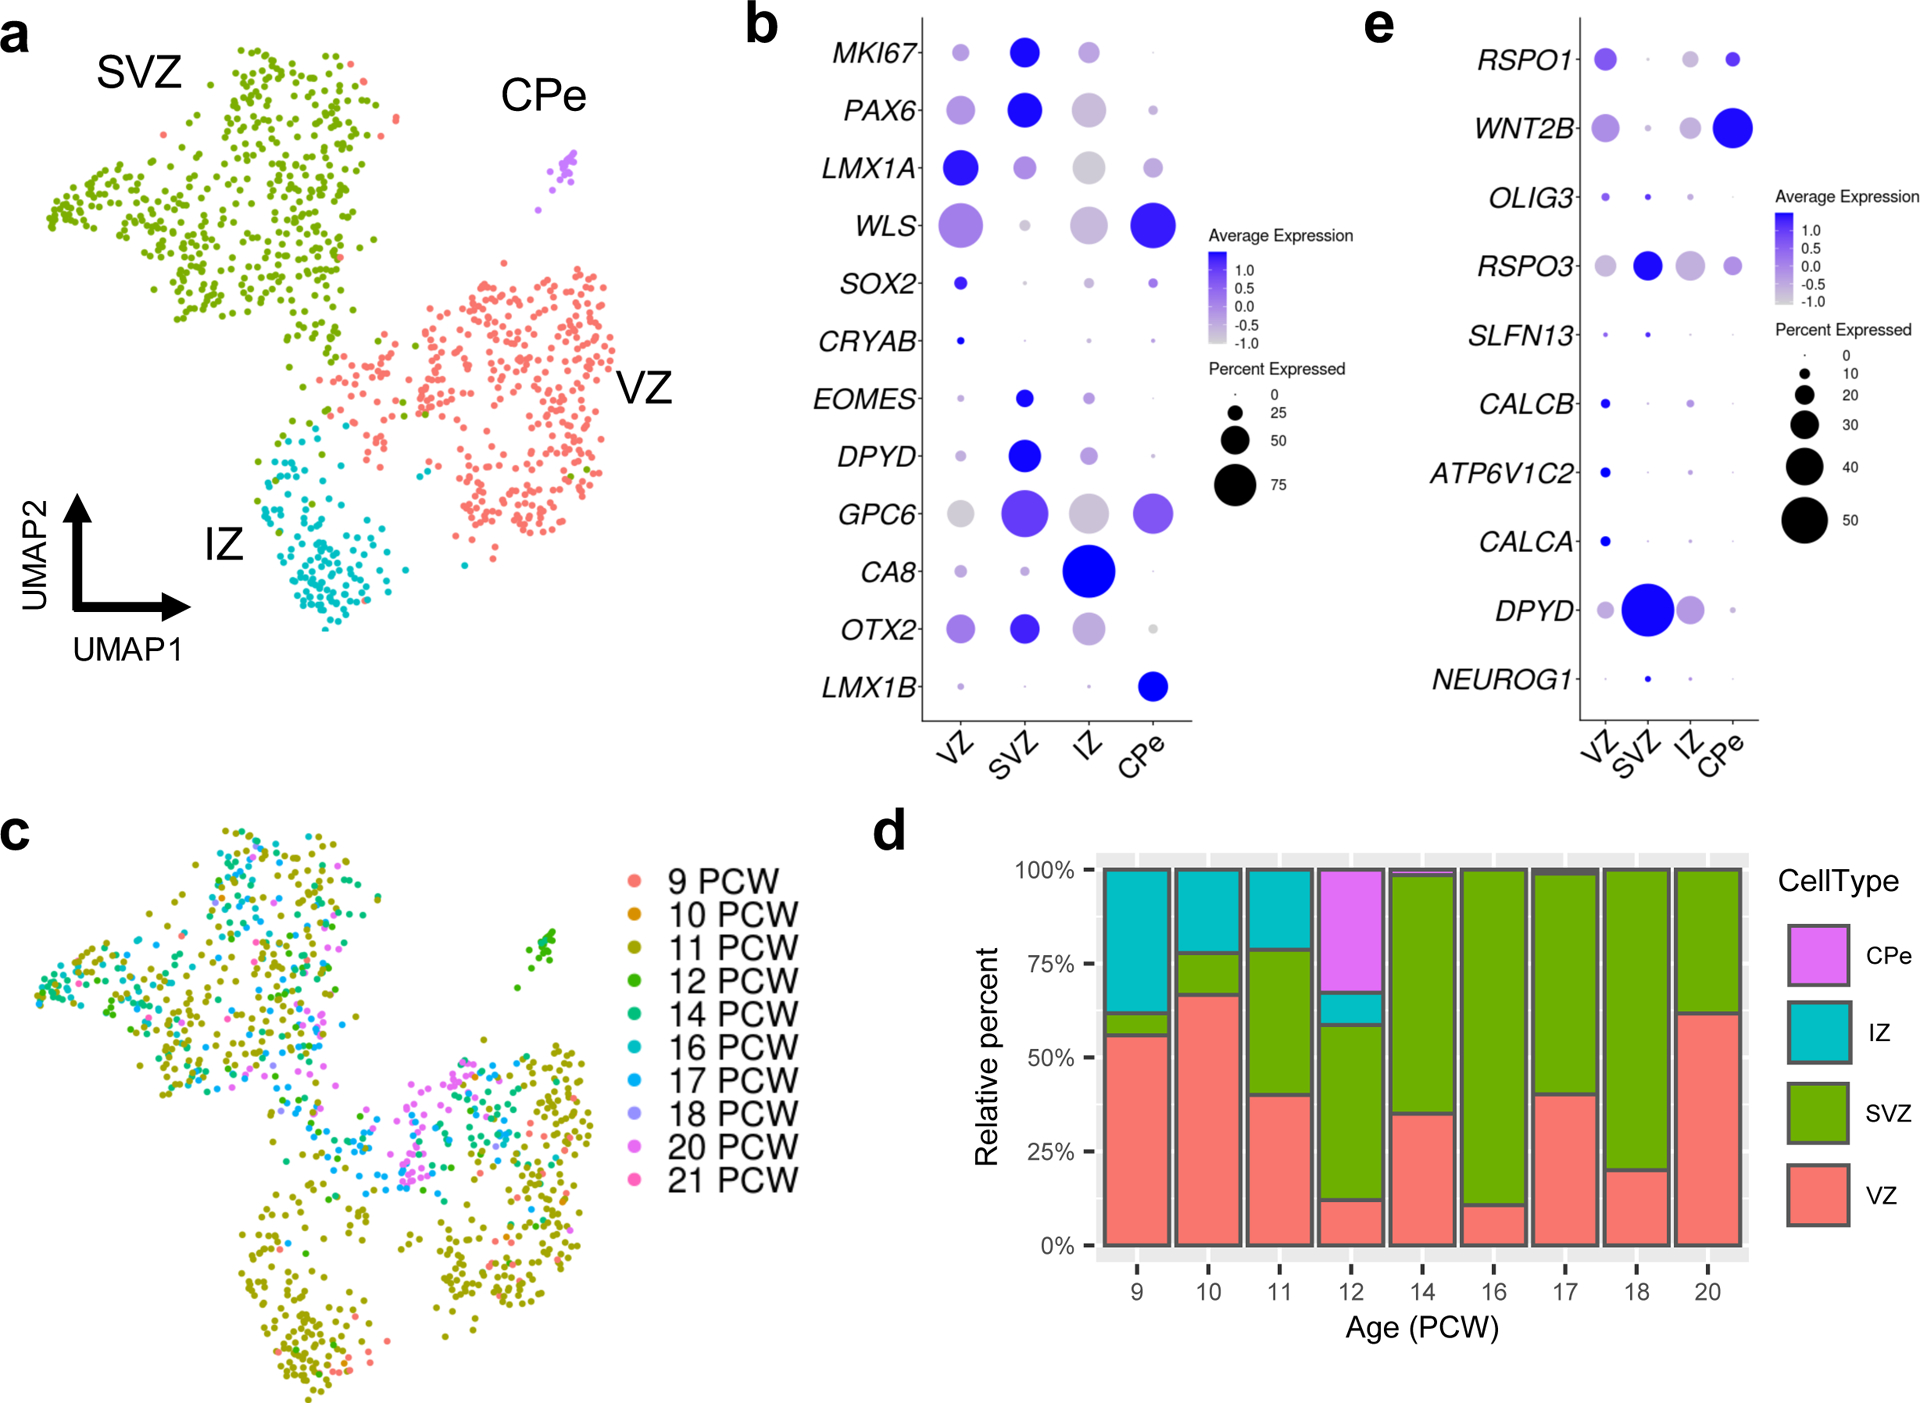
The human neonatal cerebellum is one-fourth of its adult size yet contains the blueprint required to integrate environmental cues with developing motor, cognitive and emotional skills into adulthood. Although mature cerebellar neuroanatomy is well studied, understanding of its developmental origins is limited. In this study, we systematically mapped the molecular, cellular and spatial composition of human fetal cerebellum by combining laser capture microscopy and SPLiT-seq single-nucleus transcriptomics. We profiled functionally distinct regions and gene expression dynamics within cell types and across development. The resulting cell atlas demonstrates that the molecular organization of the cerebellar anlage recapitulates cytoarchitecturally distinct regions and developmentally transient cell types that are distinct from the mouse cerebellum. By mapping genes dominant for pediatric and adult neurological disorders onto our dataset, we identify relevant cell types underlying disease mechanisms. These data provide a resource for probing the cellular basis of human cerebellar development and disease.


Conflict of interest statement

Competing interests

Charles Roco, Alexander B. Rosenberg, and Georg Seelig are shareholders of Parse Biosciences. The remaining authors declare no competing interests.

Figures

Extended Data Fig. 1
Extended Data Fig. 1. Quality control related analyses of LCM RNA-seq data.
a, Example of cerebellum section stained with cresyl violet (purple) and anti-calbindin antibody (brown). Section before and after LCM and images of Purkinje cell (PC) and external granule cell layer (EGL) tissue captured into collection tubes are shown. Example shown is representative of 11 specimens. Scale bars: 200 um (white), 400 um (black). b, Boxplots of gene expression for established markers showing highest expression in the expected samples (box: 25–75th percentiles, whiskers: 10–90th percentiles, horizontal line in box: median). Dots indicate outliers. RNA-seq sample numbers per region: n = 13 for bulk; 17 for EGL; 18 for PCL; 9 for RL. c, Expression of the female-specific non-coding RNA XIST and the chromosome Y specific gene DDX3Y show correct sex assignment for female (pink) and male (blue) samples. RNA-seq sample numbers: n = 13 for bulk; 17 for EGL; 18 for PCL; 9 for RL. RNA-seq sample numbers per sex: n = 44 female; 13 male.
Extended Data Fig. 2
Extended Data Fig. 2. Co-expression modules in the developing human cerebellum.
Weighted gene co-expression network analysis (WGCNA) dendrogram identified 21 modules comprised of 6,336 expressed genes (row 1). M0 (grey) comprised of nonclustered genes was not analyzed further. Rows 2–4 show differential expression relationships between module genes and LCM-enriched region compared to bulk expression. EGL, external granule cell layer; PCL, Purkinje cell layer; RL, rhombic lip.
Extended Data Fig. 3
Extended Data Fig. 3. Co-expression modules in the developing human cerebellum by region.
Boxplots of gene expression per WGCNA module for bulk and spatial regions (box: 25–75th percentiles, whiskers: 10–90th percentiles, horizontal line in box: median). Number of genes per module: n = 48 for M1; 81 for M2; 88 for M3; 40 for M4; 149 for M5; 79 for M6; 253 for M7; 283 for M8; 288 for M9; 102 for M10; 121 for M11; 87 for M12; 401 for M13; 136 for M14; 139 for M15; 317 for M16; 367 for M17; 182 for M18; 395 for M19; 327 for M20. EGL, external granule cell layer; PCL, Purkinje cell layer; RPKM, reads per kilobase of transcript per million mapped reads; RL, rhombic lip.
Extended Data Fig. 4
Extended Data Fig. 4. Co-expression modules in the developing human cerebellum by age.
LOESS expression values across development are shown with 95% CIs per module. Spatial regions are distinguished by colors: bulk (salmon); EGL (green); PCL (turquoise); RL (purple). EGL, external granule cell layer; PCW, postconceptional week; PCL, Purkinje cell layer; RPKM, reads per kilobase of transcript per million mapped reads; RL, rhombic lip.
Extended Data Fig. 5
Extended Data Fig. 5. Quality control related analyses of snRNA-seq data.
a, UMAP visualization of 69,174 human cerebellar nuclei colored by dataset (n = 1,076 for 01k; 3,530 for 05k; 4,960 for 10k; 59,608 for 80k). Rhombic lip (RL) is circled. UMAP visualization of 1,018 RL nuclei colored by dataset at right (nuclei numbers: n = 41 for 01k; 88 for 05k; 67 for 10k; 822 for 80k). b, The same UMAP as in a with nuclei colored by type (n = 4,462 cells; 64,712 nuclei). c, The same UMAP as in a and b showing nuclei from each dataset. Nuclei are colored by cell type. d, The same UMAP as in a-c showing nuclei sampled from same age biological and technical replicates (n = 11,213 for 14 PCW; 8,453 nuclei for 13334; 2,098 cells for 27588 Exp1; 662 cells for 27588 Exp2; n = 15,556 for 17 PCW; 524 cells for 13377; 8,540 nuclei for 14104; 3,364 nuclei for 14104h; 3,128 nuclei for 14104v). e, Stacked bar chart shows the percentage of age sampled in each of the 21 cell types. Bar colors represent age sampled in postconceptional weeks (9–20 PCW). f, Expression of the female-specific non-coding RNA XIST and the chromosome Y specific gene DDX3Y show correct sex assignment for female (salmon) and male (turquoise) samples (n = 14 female; 12 male).
Extended Data Fig. 6
Extended Data Fig. 6. Cell-type-specific marker genes.
Dot plot showing expression of the top 5 most differentially expressed genes for each of the 21 cell types identified in early and mid-gestation fetal cerebellum. The size of the dot represents the percentage of cells within a cell type in which that gene was detected and its color represents the average expression level. Statistics are presented in Supplementary Table 9.
Extended Data Fig. 7
Extended Data Fig. 7. Distribution of major cell types.
a-c, Stacked bar charts show the percentage of the four major cell types from each dataset (a), developmental age (b), and specimen (c). Dataset 01k and 05k from experiment (Exp) 1 represent deep and shallow sequencing runs, respectively, from the same 6 samples (one per age). Dataset 10k from Exp 2 represents 11 samples (7 for a single age and 4 for 17 PCW), including 5 replicates from Exp 1. Dataset 80k from Exp 3 represents 9 samples (6 for a single age and 3 for 17 PCW), including 6 replicates from Exp 2. Sample and experiment characteristics are presented in Supplementary Table 2 and 7.
Extended Data Fig. 8
Extended Data Fig. 8. Co-expression of marker genes in eCN/UBC.
a, The same UMAP visualization of cell types that originate from the RL as in Fig. 5a with nuclei colored by expression level for LMX1A (red), EOMES (green), and co-expression (yellow). b, The same UMAP visualization the eCN/UBC subcluster as in Fig. 5e with nuclei colored by expression level for LMX1A (red), EOMES (green), and co-expression (yellow).
Extended Data Fig. 9
Extended Data Fig. 9. Cell type heterogeneity in LCM-isolated regions of the cerebellum.
Box plots (box: 25–75th percentiles, whiskers: 10–90th percentiles, horizontal line in box: median) with data points (dots) showing the proportion of each of the 21 cell types from the Developmental Cell Atlas of the Human Cerebellum represented in the LCM RNA-seq data, grouped by LCM-isolated region. RL, rhombic lip; EGL, external granule cell layer; PCL, Purkinje cell layer.
Extended Data Fig. 10
Extended Data Fig. 10. Cerebellar cell type enrichment in Joubert syndrome and Alzheimer’s disease.
Heatmaps of mean expression per fetal cerebellar cell type for genes associated with Joubert syndrome (a) or Alzheimer’s disease (b). Color scheme is based on Z-score distribution. In the heatmaps, each row represents one gene and each column represents a single cell type. Horizontal white lines indicate branch divisions in the clustering dendrograms (not shown). The full list of genes is provided in Supplementary Table 11. Enrichment P values (-Log10 P value) for each cell type are shown in the bottom bar plots. Significance determined by one-sample Z-test, two-tailed P value. The dashed line is the Bonferroni significance threshold (P<0.05); no gene enrichment was detected among the 21 cerebellar cell types.
Fig. 1 |
Fig. 1 |. Overview of prenatal cerebellar development and the data generated in this study.
a, Midsagittal sections of the human fetal cerebellum stained with hematoxylin and eosin (H&E) or markers for Purkinje cells (Calbindin) or rhombic lip (RL) and external granule cell layer (EGL; PAX6 and KI67). A minimum of 2 samples per age were stained with adjacent sections used for histology and immunocytochemistry. The ventricular zone (VZ), RL, EGL, and Purkinje cell layer (PCL) are shown. Arrowheads mark the anterior (yellow) and posterior (white) EGL across the dorsal surface of the cerebellar anlage. At 9 PCW, the cerebellar anlage is dominated by Purkinje cells, with a thin nascent EGL extending from the RL. By 19 PCW, Purkinje cells have migrated radially to establish a multicellular layer (PCL) beneath the EGL. Scale bars: 100 um (grey), 500 um (red), 1 mm (blue). 10 PCW H&E section was used previously in Fig. 1 of Haldipur et al., 2019. b, Schematic illustrating LCM (left) and SPLiT-seq (right) experimental workflows. c, The time span of fetal cerebellar development represented by line drawings of midsagittal sections of the cerebellum (to-scale) showing a dramatic change in size and foliation from 9 to 19 PCW. Below is the distribution of cerebella in this study. Biological and technical replicate samples are not shown (RNA-seq sample numbers: n = 13 for bulk; 9 for RL; 17 for EGL; 18 for PCL; snRNA-seq sample numbers: n = 6 for Exp 1; 11 for Exp 2; 9 for Exp 3).
Fig. 2 |
Fig. 2 |. Spatial transcriptional analysis of the developing human cerebellum.
a, Principal component analysis indicates that the largest source of variation among RNA-seq samples was spatial location, accounting for 57% of the variance, and verifying LCM successfully captured these regions. b-d, Volcano plots illustrating differential expression of genes for each spatial region versus bulk cerebellum. Colored dots represent genes with significant expression [FDR<0.05; Log2(FC)>1.5]. Selected canonical genes with significant expression are labeled. Significance was determined by the Wald test and adjusted using FDR. Statistics are presented in Supplementary Table 3. e, Heatmap of the top 10 genes with significant expression per spatial region (RL, EGL, PCL) are shown for each sample. Samples are ordered by region [RL (purple), EGL (green), PCL (turquoise), bulk (salmon)], then by ascending age (9 to 19 PCW). High expression is in red and low expression is in blue. f,g, Heatmaps of genes and pathways expressed in RL (f) and EGL (g) identified by gene ontology analysis. High expression is in red and low expression is in blue; Z-score legend as in e. Colored boxes indicate genes represented in enriched pathways: Hippo signaling (green), signaling pathways regulating pluripotency of stem cells (magenta), and Tgfβ signaling (blue) in f; MAPK signaling (orange), Rap1 (green), Ras (pink) in g. Statistics are presented in Supplementary Table 4. h, Heatmap of genes expressed in each WGCNA module enriched in a. High expression is in red and low expression is in blue; Z-score legend as in e. Colored boxes represent the cerebellar region interpretation for each WGCNA module, as in Supplementary Table 5.
Fig. 3 |
Fig. 3 |. Identifying the major cell types of the developing human cerebellum.
a, UMAP visualization of 67,174 human cerebellar nuclei colored by cluster identity from Louvain clustering and annotated on the basis of marker genes. The same UMAP is plotted at right, showing only nuclei from each age (nuclei numbers from left to right: n = 5,003 for 9 PCW; 2,329 for 10 PCW; 20,364 for 11 PCW; 7,119 for 12 PCW; 11,213 for 14 PCW; 15,556 for 17 PCW; 1,617 for 18 PCW; 5,177 for 20 PCW). b, Dot plot showing the expression of one selected marker gene per cell type. The size of the dot represents the percentage of nuclei within a cell type in which that marker was detected and its color represents the average expression level. Statistics are presented in Supplementary Table 9. c, Midsagittal sections of the human fetal cerebellum at 18 PCW stained with selected marker genes for Purkinje cells (SKOR2), proliferation (MKI67), RL (OTX2 and LMX1A), granule neurons (NEUN), and brainstem (HOXB3). Adjacent sections from one sample were stained for OTX2 and HOXB3; a minimum of 3 sections from each of 3 samples were stained for the other markers. The EGL, PCL, internal granule cell layer, RL and brainstem are indicated by red, yellow, white, blue and purple arrowheads, respectively. Sections are counterstained using DAPI for immunohistochemistry (SKOR2, NEUN) or Fast Green for in situ hybridization (MKI67, OTX2, LMX1A, HOXB3). Scale bar = 100 um and 1 mm (HOXB3). LMX1A was used previously in Fig. 3G of Haldipur et al., 2019. d, Stacked bar charts show the percentage of the four major cell types from each age sampled. Bar colors represent Purkinje cells (PC), rhombic lip (RL), granule cell precursors (GCP), or granule neurons (GN).
Fig. 4 |
Fig. 4 |. Analysis of RL compartments at single-cell resolution.
a, UMAP visualization and marker-based annotation of the RL subclusters (n = 1,018 nuclei; 466 for SVZ; 390 for VZ; 135 for IZ; 21 for CPe). CPe, choroid plexus epithelium; IZ, intermediate zone; SVZ, subventricular zone; VZ ventricular zone. b, Dot plot showing the expression of selected marker genes in subclusters. c, The same UMAP as in a with nuclei colored by sample age (n = 34 for 9 PCW; 9 for 10 PCW, 535 for 11 PCW; 58 for 12 PCW; 137 for 14 PCW; 56 for 16 PCW; 97 for 17 PCW, 5 for 18 PCW; 81 for 20 PCW; 6 for 21 PCW). d, Stacked bar charts show the percentage of the RL subclusters by sample age. e, Dot plot showing the expression of the top 10 most differentially expressed genes from the spatial transcriptional analysis of the RL (Fig. 2e and Supplementary Table 3).
Fig. 5 |
Fig. 5 |. Characterization of the RL trajectory.
a, UMAP visualization and marker-based annotation of cell types that originate from the RL (n = 12,243; 1,018 for RL; 1,659 for GCP; 6,727 for GN; 2,839 for eCN/UBC). eCN/UBC, excitatory cerebellar nuclei/unipolar brush cells; GCP, granule cell progenitors; GN, granule neurons; RL, rhombic lip. b, The same UMAP as in a with nuclei colored by sample age (n = 120 for 9 PCW; 61 for 10 PCW; 2,190 for 11 PCW; 1,053 for 12 PCW; 1,663 for 14 PCW; 432 for 16 PCW; 4,410 for 17 PCW; 627 for 18 PCW; 1,626 for 20 PCW; 89 for 21 PCW). c, Kinetics plot showing the relative expression of RL trajectory marker genes across developmental pseudotime. Dots are colored according to cell types as in a. d, Dot plot showing the expression of the top 10 most differentially expressed genes from the spatial transcriptional analysis of RL and EGL (Fig. 2e and Supplementary Table 3). e, UMAP visualization of the eCN/UBC cluster including 11, 18, 20, 21 PCW samples. Nuclei are colored by sample age (n = 1,424; 436 for 11 PCW; 138 for 18 PCW; 842 for 20 PCW; 8 for 21 PCW). f, The same UMAP as in e with nuclei colored by expression level for the indicated gene.
Fig. 6 |
Fig. 6 |. Purkinje cells.
a, UMAP visualization of the PC cluster. Nuclei are colored by sample age (n = 25,724; 3,736 for 9 PCW; 1,131 for 10 PCW; 12,182 for 11 PCW; 3,543 for 12 PCW; 1,346 for 14 PCW; 26 for 16 PCW; 3,144 for 17 PCW; 245 for 18 PCW; 371 for 20 PCW). b, Kinetics plot showing the relative expression of PC marker genes across developmental pseudotime. Dots are colored by sample age as in a. c, The same UMAP as in a with nuclei colored by expression level for the indicated gene.
Fig. 7 |
Fig. 7 |. Human-mouse cross-species analysis.
a, UMAP plot of nuclei from human cerebellum and cells from mouse cerebellum following LIGER analysis, showing only nuclei from human cerebellum (n = 69,174) and colored by cell type from the original analysis. b, Riverplot showing the relationship between original cluster assignments from our human cerebellum and a published mouse cerebellum dataset. c, UMAP plot of nuclei from human cerebellum and cells from mouse cerebellum following LIGER analysis, showing only cells from mouse cerebellum (n = 39,130) and colored by cell type from the original analysis. d-f, UMAP plots showing cell factor loading values and gene loading plots for factors corresponding to RL (d), and PC (e, f). g, UMAP plots show the human (n = 1,018) and mouse (7,034) cell types contributing to factor 10. Dot plot shows expression of canonical RL genes delineated in human and mouse clusters. h, UMAP plots show the human and mouse PC clusters. Dot plot shows expression of canonical PC genes delineated in human and mouse PC clusters.
Fig. 8 |
Fig. 8 |. Cerebellar cell type enrichment in pediatric and adult diseases.
a-d, Heatmaps of mean expression per fetal cerebellar cell type for genes associated with pediatric (a, cerebellar malformations; b, autism spectrum disorders; c, intellectual disability) or adult (d, spinocerebellar ataxia) diseases. Color scheme is based on Z-score distribution. In the heatmaps, each row represents one gene and each column represents a single cell type. Gene expression was clustered by row. Horizontal white lines indicate branch divisions in row dendrograms (not shown). The full list of genes is provided in Supplementary Table 11. Enrichment P values (-Log10 P value) for each cell type are shown in the bottom bar plots. Significance was determined by one-sample Z-test, two-tailed P value. The dashed line is the significance threshold. Asterisk (*) indicates significance (P < 0.05) after Bonferroni correction: cerebellar malformations (P = 1.63 × 10⁻⁴ for 01-PC; 0.01 for 13-Endothelial; < 0.05 for 16-Pericytes), autism spectrum disorders (P = 0.004 for 01-PC; 0.002 for 04-GN; 9.43 × 10⁻⁵ for 05-eCN/UBC; 3.78 × 10⁻⁷ for 06-iCN; 0.01 for 07-PIP; 0.008 for 12-Committed OPC; 0.02 for 13-Endothelial; 0.03 for 16-Pericytes; 0.005 for 17-Brainstem; 6.74 × 10⁻⁶ for 18-MLI; 0.009 for 20-Choroid; 0.004 for 21-BS Choroid/ependymal), intellectual disability (P = 3.30 × 10⁻⁴ for 01-PC; 0.02 for 02-RL; 0.02 for 03-GCP; 0.02 for 13-Endothelial; 0.004 for 16-Pericytes; 0.04 for 17-Brainstem), spinocerebellar ataxia (P = 4.56 × 10⁻⁶ for 01-PC).

References

    1. Sathyanesan A, et al. Emerging connections between cerebellar development, behaviour and complex brain disorders. Nat Rev Neurosci 20, 298–313 (2019). - PMC - PubMed
    1. Schmahmann JD The cerebellum and cognition. Neurosci Lett 688, 62–75 (2019). - PubMed
    1. Leto K, et al. Consensus Paper: Cerebellar Development. Cerebellum 15, 789–828 (2016). - PMC - PubMed
    1. Rakic P & Sidman RL Histogenesis of cortical layers in human cerebellum, particularly the lamina dissecans. J Comp Neurol 139, 473–500 (1970). - PubMed
    1. Aldinger KA & Doherty D The genetics of cerebellar malformations. Semin Fetal Neonatal Med 21, 321–332 (2016). - PMC - PubMed

Publication types