. 2021 Jun 1:15:673684.
doi: 10.3389/fnins.2021.673684. eCollection 2021.

Sunday Driver Mediates Multi-Compartment Golgi Outposts Defects Induced by Amyloid Precursor Protein

Affiliations

Sunday Driver Mediates Multi-Compartment Golgi Outposts Defects Induced by Amyloid Precursor Protein

Qianqian Du et al. Front Neurosci. .

Abstract

Golgi defects including Golgi fragmentation are pathological features of Alzheimer's disease (AD). As a pathogenic factor in AD, amyloid precursor protein (APP) induces Golgi fragmentation in the soma. However, how APP regulates Golgi outposts (GOs) in dendrites remains unclear. Given that APP resides in and affects the movements of GOs, and in particular, reverses the distribution of multi-compartment GOs (mcGOs), we investigated the regulatory mechanism of mcGO movements in the Drosophila larvae. Knockdown experiments showed that the bidirectional mcGO movements were cooperatively controlled by the dynein heavy chain (Dhc) and kinesin heavy chain subunits. Notably, only Dhc mediated APP's regulation of mcGO movements. Furthermore, by loss-of-function screening, the adaptor protein Sunday driver (Syd) was identified to mediate the APP-induced alteration of the direction of mcGO movements and dendritic defects. Collectively, by elucidating a model of bidirectional mcGO movements, we revealed the mechanism by which APP regulates the direction of mcGO movements. Our study therefore provides new insights into AD pathogenesis.

Keywords: Golgi outposts; Sunday driver; amyloid precursor protein; dendrite defects; motor protein.


Conflict of interest statement

The authors declare that the research was conducted in the absence of any commercial or financial relationships that could be construed as a potential conflict of interest.

Figures
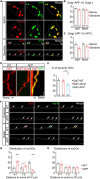
FIGURE 1
FIGURE 1
APP reverses the distribution of multi-compartment Golgi outposts (mcGOs) in the dendrites. (A–C) APP resides in the vast majority of GOs. (A) Examples of APP (green) and Golgi complex (red) in the soma and dendrites. APP is labeled by APP-GFP and Golgi complex is labeled by GalT-TagRFPt (top, trans-Golgi) or ManII-TagRFPt (bottom, medial-Golgi). Arrows indicate colocalized APP and GOs in the dendrites. (B,C) Quantification of the proportion of colocalized APP and Golgi complex in the soma and dendrites: co-localization as a percentage of Golgi complex (B) or APP (C). (D,E) The resident APP changes the dynamics of GOs. (D) Examples of dynamic GOs with and without APP. Kymograph of time-lapse imaging of GOs showing GO (labeled by GalT-TagRFPt) dynamics without (red) or with APP-GFP (yellow, GalT-APP). Scale bar: 2 μm/1 min. (E) Bar charts showing the proportion of dynamic GOs with or without APP. (F–H) APP reverses the distribution of mcGOs in the dendrites but not that of single-compartment outposts (scGOs). (F) Examples of the distribution of GOs in the wild-type and APP neurons. The medial- and trans-Golgi are labeled by ManII-GFP (green) and GalT-TagRFPt (red), respectively. Arrows point to mcGOs. (G,H) the distribution patterns of (G) mcGOs and (H) scGOs in dendrites. Scale bar: 2 μm. Statistical significance was assessed with ANOVA tests in (E), and Student’s t-test in (G,H) (***P < 0.001; **P < 0.01).
FIGURE 2
FIGURE 2
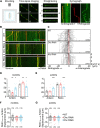
Dhc and Khc coordinate to maintain the equilibrium of anterograde/retrograde mcGO movement. (A) Schematic diagram showing the pipeline for the generation of GO trajectories. The four steps are (from left to right): the anesthetized larvae were (1) mounted for subsequent (2) time-lapse imaging. Arrows with different colors in the image indicate the GOs with a different organization. (3) The dynamic puncta in the dendrites of consecutive images were tracked down by the segmented line tool and (4) processed to generate a kymograph. (B) Examples of the trajectories of dynamic GOs in the wild-type and APP neurons with RNAi knockdown of dynein heavy chain (Dhc) or kinesin heavy chain (Khc). Top: snapshots of the GOs in the straightened dendrites. Bottom: kymograph of time-lapse imaging of GOs for 10 min. Dual-color live imaging showing the compartmental organization of GOs in dendrites, which are labeled by ManII-GFP (green, medial-Golgi) and GalT-TagRFPt (red, trans-Golgi). Green or red indicates a scGO and yellow indicates the mcGO. Scale bar: 5 μm/2 min. (C) Compound tracks of dynamic GOs. Red lines are aligned along with displacement 0; puncta numbers are indicated within the boxes. (D,E) Quantification of the percentage of anterograde and retrograde movements for (D) mcGOs and (E) scGOs. The percentage of anterograde (retrograde) movements is calculated by dividing the number of anterograde- (retrograde-) moving mcGOs by the total number of moving mcGOs. (F,G) Quantification of the displacements of (F) mcGOs and (G) scGOs. Anterograde displacements are shown as positive and retrograde as negative. Statistical significance was assessed with Student’s t-test (***P < 0.001; **P < 0.01; *P < 0.05).
FIGURE 3
FIGURE 3
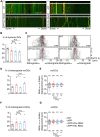
APP enhances the anterograde movements of mcGOs driven by Dhc. (A) Examples of the trajectories of dynamic GOs in the wild-type and APP neurons with RNAi knockdown of dynein heavy chain (Dhc) or kinesin heavy chain (Khc). Top: snapshots of the GOs in the straightened dendrites. Bottom: kymograph of time-lapse imaging of GOs for 10 min. Scale bar: 5 μm/2 min. (B) Quantification of the proportion of dynamic GOs. (C) Compound tracks of dynamic GOs. (D,E) Quantification of the features of dynamic mcGOs. (D) The percentage of anterograde movements, (E) displacements. (F,G) Quantification of the features of dynamic scGOs. (F) The percentage of anterograde movements; (G) displacements. Statistical significance was assessed with ANOVA tests (**P < 0.01; *P < 0.05; n.s., no significance).
FIGURE 4
FIGURE 4
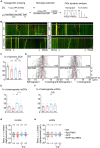
Syd is required for the alteration of mcGO dynamics induced by APP. (A) Flow of loss-of-function screening of candidate adaptor proteins which may be involved in the GO dynamics. (B) Examples of the trajectories of GO movements in the wild-type and APP neurons with Syd knockdown. Top: snapshots of the GOs in the straightened dendrites. Bottom: kymograph of time-lapse imaging of GOs for 10 min. Scale bar: 5 μm/2 min. (C) Quantification of the proportion of dynamic GOs. (D) Compound tracks of dynamic GOs. (E,F) Quantification of the percentage of anterograde movements for (E) mcGOs, and (F) scGOs. (G,H) Quantification of the displacements for (G) mcGOs and (H) scGOs. Statistical significance was assessed with ANOVA tests (***P < 0.001; **P < 0.01; *P < 0.05; n.s., no significance).
FIGURE 5
FIGURE 5
Loss of Syd recovers the dendritic defects induced by APP. (A) The dendritic morphologies of C3da ddaA neurons in the wild-type and APP neurons following the loss of Syd. Raw images (left) and tracings of dendritic branches (right, the numerous F-actin-based “dendritic spikes” of C3da neurons are not included). The red arrowhead points to the soma and blue arrows to the branch points of the fourth order and up. Scale bar: 100 μm. (B–F) Quantification of dendritic morphologies. (B) The total dendrite length, (C) the number of total branch points, (D) the number of branch points in different orders; (E,F) the characteristics of dendritic spikes: (E) density/100 μm, (F) average length. Statistical significance was assessed with ANOVA tests (***P < 0.001; **P < 0.01; *P < 0.05; n.s., no significance).

References

    1. Abe N., Almenar-Queralt A., Lillo C., Shen Z., Lozach J., Briggs S. P., et al. (2009). Sunday driver interacts with two distinct classes of axonal organelles. J. Biol. Chem. 284 34628–34639. 10.1074/jbc.M109.035022 - DOI - PMC - PubMed
    1. Alpár A., Ueberham U., Brückner M. K., Seeger G., Arendt T., Gärtner U. (2006). Different dendrite and dendritic spine alterations in basal and apical arbors in mutant human amyloid precursor protein transgenic mice. Brain Res. 1099 189–198. 10.1016/j.brainres.2006.04.109 - DOI - PubMed
    1. Arthur A. L., Yang S. Z., Abellaneda A. M., Wildonger J. (2015). Dendrite arborization requires the dynein cofactor NudE. J. Cell Sci. 128 2191–2201. 10.1242/jcs.170316 - DOI - PMC - PubMed
    1. Baloyannis S. J. (2009). Dendritic pathology in Alzheimer’s disease. J. Neurol. Sci. 283 153–157. 10.1016/j.jns.2009.02.370 - DOI - PubMed
    1. Baloyannis S. J. (2014). Golgi apparatus and protein trafficking in Alzheimer’s disease. J. Alzheimers Dis. 42 Suppl 3 S153–S162. 10.3233/jad-132660 - DOI - PubMed