. 2021 Jun 14;10(6):e1295.
doi: 10.1002/cti2.1295. eCollection 2021.

Next-generation Bruton's tyrosine kinase inhibitor BIIB091 selectively and potently inhibits B cell and Fc receptor signaling and downstream functions in B cells and myeloid cells

Affiliations

Next-generation Bruton's tyrosine kinase inhibitor BIIB091 selectively and potently inhibits B cell and Fc receptor signaling and downstream functions in B cells and myeloid cells

Eris Bame et al. Clin Transl Immunology. .

Abstract

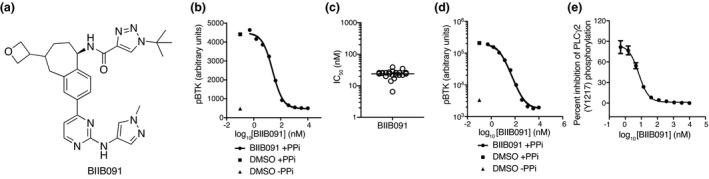
Objectives: Bruton's tyrosine kinase (BTK) plays a non-redundant signaling role downstream of the B-cell receptor (BCR) in B cells and the receptors for the Fc region of immunoglobulins (FcR) in myeloid cells. Here, we characterise BIIB091, a novel, potent, selective and reversible small-molecule inhibitor of BTK.

Methods: BIIB091 was evaluated in vitro and in vivo in preclinical models and in phase 1 clinical trial.

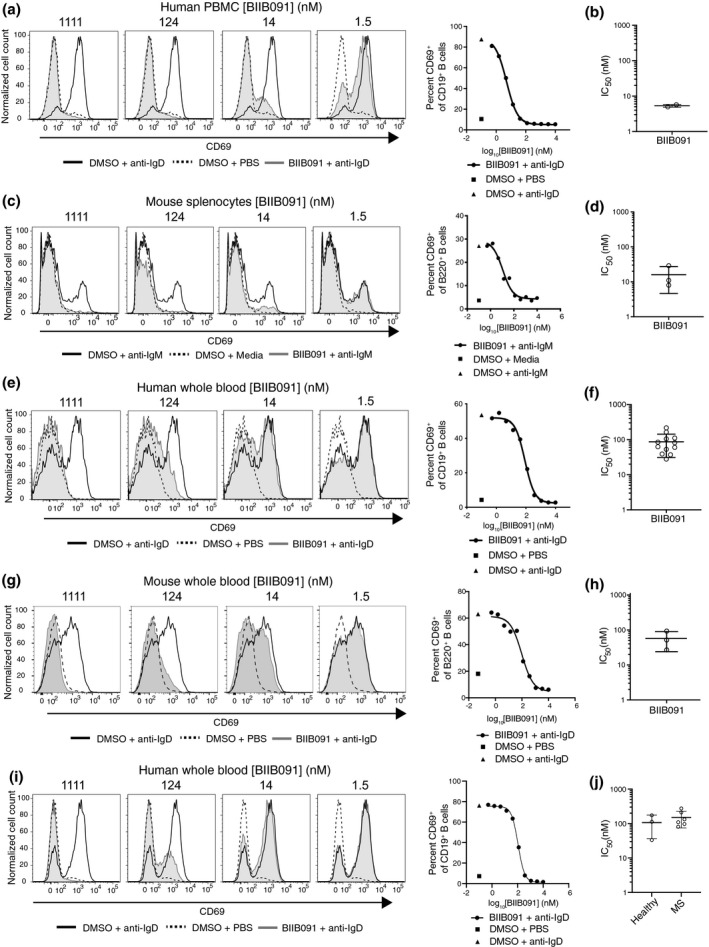
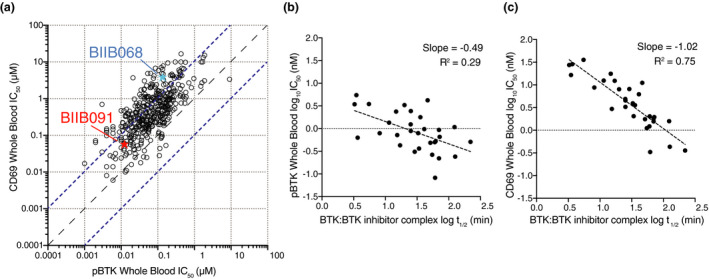
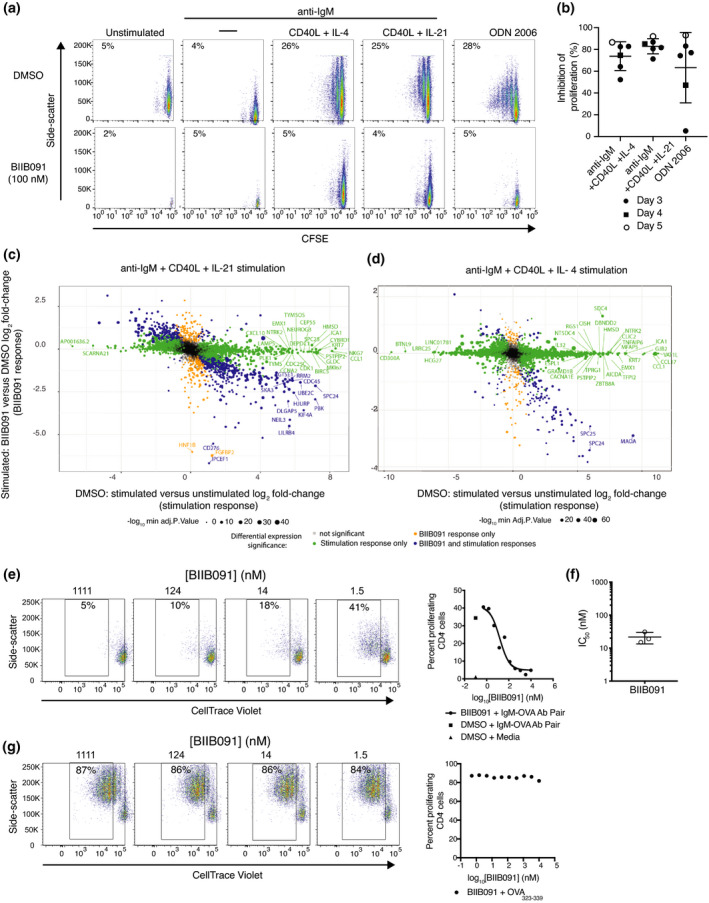
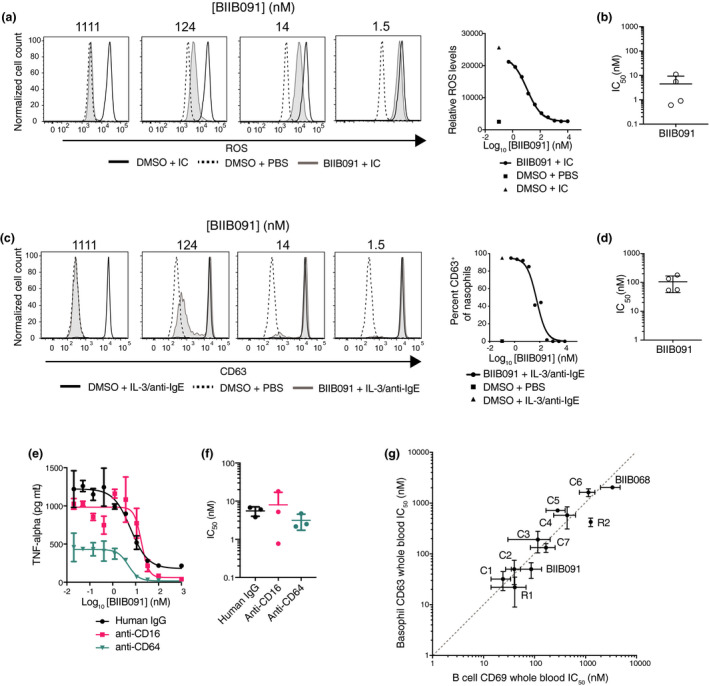
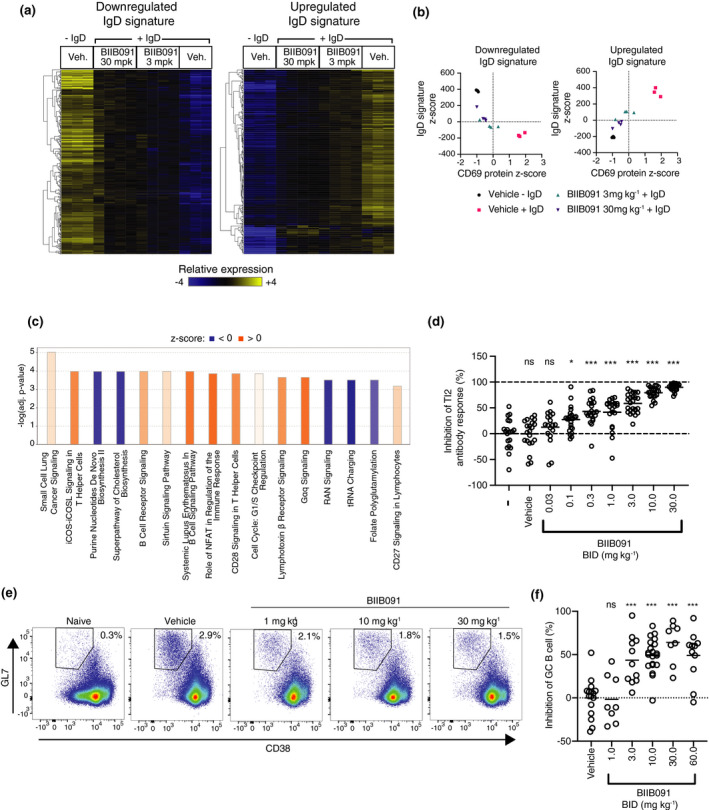
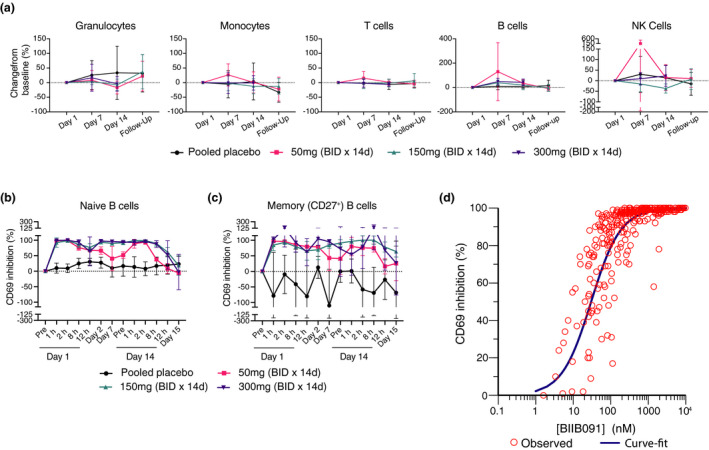
Results: In vitro, BIIB091 potently inhibited BTK-dependent proximal signaling and distal functional responses in both B cells and myeloid cells with IC50s ranging from 3 to 106 nm, including antigen presentation to T cells, a key mechanism of action thought to be underlying the efficacy of B cell-targeted therapeutics in multiple sclerosis. BIIB091 effectively sequestered tyrosine 551 in the kinase pocket by forming long-lived complexes with BTK with t 1/2 of more than 40 min, thereby preventing its phosphorylation by upstream kinases. As a key differentiating feature of BIIB091, this property explains the very potent whole blood IC50s of 87 and 106 nm observed with stimulated B cells and myeloid cells, respectively. In vivo, BIIB091 blocked B-cell activation, antibody production and germinal center differentiation. In phase 1 healthy volunteer trial, BIIB091 inhibited naïve and unswitched memory B-cell activation, with an in vivo IC50 of 55 nm and without significant impact on lymphoid or myeloid cell survival after 14 days of dosing.

Conclusion: Pharmacodynamic results obtained in preclinical and early clinical settings support the advancement of BIIB091 in phase 2 clinical trials.

Keywords: B cells; BTK inhibitor; B‐cell receptor; Fc receptor; multiple sclerosis; myeloid cells.


Conflict of interest statement

The authors declare no conflict of interest.

Figures

Figure 1
Figure 1
BIIB091 potently inhibits BTK enzymatic activity and downstream proximal signaling events. (a) Chemical structure of BIIB091. (b–d) Detection of phosphorylated BTK and phosphorylated BTK‐associated proteins in whole blood from individual healthy human donors (b, c) or pooled blood from 15 DBA1 mice (d) treated in vitro with dimethyl sulfoxide (DMSO) or titrating concentrations of BIIB091 and lysed in the presence or absence of phosphatase inhibitors (PPi). Representative curve from one individual (b) . Calculated IC50 values across 19 healthy donors (individual data points) are shown along with the mean (24 nm) (c). (e) Phosphorylation levels of PLCγ2 (Y1217) measured in Ramos B cells pre‐treated with titrating concentrations of BIIB091 and stimulated with F(ab′)2 anti‐human IgM (IC50 = 6.9 nm) (Data shown are from one experiment).
Figure 2
Figure 2
BIIB091 inhibits human and mouse B‐cell activation in vitro. (a–d) Histogram overlays of CD69 expression on CD19+ B cells from human PBMC (a) or on B220+ mouse splenic B cells (c) treated with DMSO or titrating concentrations of BIIB091 and stimulated with polyclonal anti‐human IgD (a) or anti‐mouse‐IgM cross‐linked with a secondary antibody (c). Phosphate‐buffered saline (PBS) was used as control. IC50 values for two healthy donors (b) or from three independent mouse experiments (d) are shown along with mean and SD (5.4 ± 0.5 nm and 16 ± 11 nm, respectively). (e–h) Histogram overlays of CD69 expression on B cells from human (e) or mouse (g) whole blood treated with DMSO or titrating concentrations of BIIB091 and stimulated with PBS or anti‐human IgD (e) or anti‐mouse IgD (g). IC50 values for 12 healthy human donors (f) and from three mouse whole blood independent experiments (h) are shown along with mean and SD (87 ± 56 nm and 57 ± 33 nm, respectively). (i, j) Histogram overlays of CD69 expression on CD19+ B cells from whole blood of patients with MS or healthy volunteers treated with DMSO or titrating concentrations of BIIB091 and stimulated with anti‐human IgD (i). Individual IC50 values for three healthy donors and six patients with MS (individual data points) are shown along with mean and SD (106 ± 70 nm and 151 ± 76 nm, respectively) (j). IC50 differences between the two groups were not statistically significant (unpaired t‐test with Welch's correction).
Figure 3
Figure 3
The residency time of BTK inhibitors in the kinase pocket dictates potency against distal B‐cell pharmacodynamic responses. (a) Dot plot showing IC50 values for constitutive BTK phosphorylation in unstimulated cells (pBTK, x‐axis) and CD69 expression in anti‐IgD‐stimulated B cells (CD69, y‐axis) in whole blood (WB) assays. Data from n = 420 Biogen‐reversible BTK inhibitors are shown with BIIB091 and BIIB068 (early generation BTK inhibitor 11 ) highlighted in red and blue, respectively. Dashed lines indicate the equal potency line and the 10‐fold deviation from the equipotency line. (b, c) Dot plots showing plasma protein binding‐corrected IC50 values for constitutive BTK phosphorylation in unstimulated cells (b) and CD69 expression in anti‐IgD‐stimulated B cells (c) against the half‐life of the BTK:BTK inhibitor complex measured by surface plasmon resonance. Data from n = 30 Biogen‐reversible BTK inhibitors are shown.
Figure 4
Figure 4
BIIB091 blocks B‐cell proliferation and antigen‐presenting functions in vitro and the associated B‐cell activation transcriptional programme. (a, b) Pseudocolor plots displaying side scatter against the dilution of CFSE used as a measure of proliferation of human B cells left either unstimulated or stimulated for 5 days with anti‐IgM alone, anti‐IgM with CD40L and IL‐4, anti‐IgM with CD40L and IL‐21, or CpG ODN 2006 in the presence or absence of 100 nm BIIB091 (a). Percent inhibition of B‐cell proliferation (relative to proliferation level observed in DMSO control condition) obtained from six independent experiments (individual data points) and measured either three (filled circle), four (square) or five (open circle) days post‐stimulation (b). (c) Log2 fold‐change × fold‐change plot of differentially expressed genes (FDR < 0.05; fold change > |1.2|) observed when comparing anti‐IgM, CD40L and IL‐21‐stimulated human B cells to unstimulated B cells on the x‐axis and anti‐IgM, CD40L and IL‐21‐stimulated B cells treated with 100 nm BIIB091 to stimulated B cells treated with DMSO on the y‐axis. Data from five independent experiments. (d) Log2 fold‐change × fold‐change plot of differentially expressed genes (FDR < 0.05; fold change > |1.2|) observed when comparing anti‐IgM, CD40L and IL‐4‐stimulated human B cells to unstimulated B cells on the x‐axis and anti‐IgM, CD40L and IL‐4 stimulated B cells treated with 100 nm BIIB091 to stimulated B cells treated with DMSO on the y‐axis. Data from five independent experiments. (e–g) Pseudocolor plots displaying side scatter against the dilution of CellTrace Violet used as a measure of proliferation of mouse OTII CD4+ T cell (expressing transgenic T‐cell receptor specific for the ovalbumin (OVA) peptide 323–339) upon B‐cell receptor targeting of OVA protein antigen to B cells using antibodies directed against the B‐cell receptor (e) or upon addition of OVA peptide 323–339 (g) to co‐cultures of splenic B cells and OTII T cells in the presence or absence of titrating concentrations of BIIB091 (left). Dot plot shows the per cent of proliferating OVA323–339‐specific CD4+ T versus the concentration of BIIB091 (right). IC50 values obtained with B‐cell receptor targeting of OVA protein antigen to B cells in three independent experiments are shown along with the mean and SD (22 ± 8 nm) (f).
Figure 5
Figure 5
BIIB091 potently inhibits myeloid cell effector functions with IC50s in the same range as in B cells. (a, b) Histogram overlays showing levels of reactive oxygen species (ROS) indicator dihydrorhodamine 123 in purified human neutrophils stimulated with immune complexes (IC) (anti‐ribonucleoprotein (RNP) antibodies complexed with purified RNP) and treated with DMSO or titrating concentrations of BIIB091 (a). IC50 values for four healthy donors (individual data points) are shown along with mean and SD (4.5 ± 4.9 nm) (b). (c, d) Histogram overlays showing CD63 expression levels as a measure of degranulation in CD123+ HLA‐DR basophils from human whole blood treated with DMSO or titrating concentrations of BIIB091 and stimulated with recombinant human IL‐3 and anti‐human IgE antibodies (c). IC50 values for four healthy donors (individual data points) are shown along with mean and SD (106 ± 62 nm). (e, f) TNFα protein levels measured in supernatant from human primary monocyte cultures treated with DMSO or titrating concentrations of BIIB091 and stimulated with plate‐bound human IgG (circle), anti‐human CD16 (square) or anti‐human CD64 (inverted triangle) antibodies (e). For each stimulating agent, IC50 values for three healthy donors are shown along with mean and SD (5.6 ± 1.5 nm, 8.0 ± 9.0 nm and 3.1 ± 1.4 nm, respectively) (f). (g) Dot plot showing IC50 values (mean and SD) for CD69 expression in anti‐IgD‐stimulated B cells (CD69, x‐axis) and basophil degranulation (CD63, y‐axis) in whole blood assays. Data from n = 11 BTK inhibitors including Biogen BIIB091 and BIIB068 (early generation BTK inhibitor 11 ), 2 reversible competitor inhibitors (R) and 7 covalent competitor inhibitors (C). The dashed line indicates the equipotency line.
Figure 6
Figure 6
BIIB091 blocks B‐cell activation and differentiation into antibody‐secreting and germinal center B cells in vivo. (a) Hierarchically clustered heatmap of splenic B‐cell gene expression profiles in response to in vivo anti‐IgD stimulation of B cells in mice dosed with either vehicle (Veh.) or BIIB091 at indicated doses. IgD signatures were defined as the genes differentially expressed with FDR < 0.01 and absolute log2 fold change > 1.5 in vehicle‐treated IgD‐stimulated versus vehicle‐treated unstimulated B cells. (b) Scatter plots of IgD signature cumulative z‐scores for the upregulated (right) and downregulated (left) IgD signatures versus CD69 protein z‐scores measured in anti‐IgD‐stimulated (+IgD) or unstimulated (−IgD) B cells isolated from individual mice treated with vehicle or BIIB091 at indicated doses. n = 3 or 4/group. (c) Top differentially regulated canonical pathways identified by IPA in anti‐IgD‐treated B cells isolated from mice dosed with BIIB091 at 30 mpk versus vehicle. Positive (orange) and negative (blue) z‐scores indicate the predicted degree of activation or inhibition for that pathway, respectively. (d) Inhibition of NP‐specific IgM relative titres in mice injected intraperitoneally with 30 μg of NP‐Ficoll and dosed for 10 days with vehicle or BIIB091 at indicated doses. Control groups received either vehicle or no treatment (–). Significance established by 1‐way ANOVA (comparison with vehicle group) followed by Dunnett's multiple comparison test. n = 12/treatment group. (e, f) Representative pseudocolor dot plots (e) and quantification (f) of BIIB091 inhibition of splenic germinal center B‐cell formation identified as CD3CD19+B220+CD38lowGL7+CD95+ in mice 8 days after immunisation with sheep red blood cells. Number of animals per group from n = 8 to n = 20. Significance established by 1‐way ANOVA (comparison with vehicle group) followed by Dunnett's multiple comparison test. mpk, mg kg−1; Veh, vehicle; ns, not significant; *P < 0.05; ***P < 0.001.
Figure 7
Figure 7
BIIB091 demonstrates complete inhibition of B‐cell activation over the dosing interval in a human phase 1 trial. (a) Changes in leukocyte absolute cell numbers (mean percent change from baseline ± SD) following twice‐daily placebo or BIIB091 dose administration for 14 days in healthy individuals. Day 1, 7 and 14 assessments were done in whole blood samples collected prior to dosing. Follow‐up samples were collected 8–10 days post‐last dose on day 14. Number of tested patient samples for specific cohorts and specific time points varied from n = 3 to n = 6. (b, c) Percent inhibition (SD) of CD69 expression (normalised to day 1 pre‐dose levels) in CD19+ CD27 (naïve) (b) and CD19+ CD27+ (memory) B cells (c) from whole blood of healthy individuals dosed BID with BIIB091 (n = 6/cohort) or placebo (n = 2/cohort) and stimulated ex vivo with anti‐human IgD. Measurements were performed on whole blood samples collected prior to morning dose on day 1 (pre), day 2, day 7 and day 14 (pre). Day 1 (12‐h) assessment was performed on samples collected prior to the evening dose. CD69 expression measurement for the remaining indicated times and day 15 were performed on whole blood samples collected following last morning dose (24 h post‐last administrated dose on day 14 for day 15 time point). Number of tested patient samples varied from n = 2 to n = 6 across different time points and cohorts. (d) Percent inhibition of CD69 expression in total CD19+ B cells from BIIB091‐dosed healthy individuals plotted versus measured plasma BIIB091 concentration across all dose levels and time points (including both SAD and MAD parts of the trial, n = 318 individual data points). BID, twice daily; d, day; h, hour(s).

References

    1. Corneth OB, Klein Wolterink RG, Hendriks RW. BTK signaling in B cell differentiation and autoimmunity. Curr Top Microbiol Immunol 2016; 393: 67–105. - PubMed
    1. Molnarfi N, Schulze‐Topphoff U, Weber MS et al. MHC class II‐dependent B cell APC function is required for induction of CNS autoimmunity independent of myelin‐specific antibodies. J Exp Med 2013; 210: 2921–2937. - PMC - PubMed
    1. Sharma S, Orlowski G, Song W. Btk regulates B cell receptor‐mediated antigen processing and presentation by controlling actin cytoskeleton dynamics in B cells. J Immunol 2009; 182: 329–339. - PMC - PubMed
    1. Benson MJ, Rodriguez V, von Schack D et al. Modeling the clinical phenotype of BTK inhibition in the mature murine immune system. J Immunol 2014; 193: 185–197. - PubMed
    1. Dolgin E. BTK blockers make headway in multiple sclerosis. Nat Biotechnol 2021; 39: 3–5. - PubMed

LinkOut - more resources