. 2021 Jun 2:9:e11490.
doi: 10.7717/peerj.11490. eCollection 2021.

The gut microbiome of the Sunda pangolin (Manis javanica) reveals its adaptation to specialized myrmecophagy

Affiliations

The gut microbiome of the Sunda pangolin (Manis javanica) reveals its adaptation to specialized myrmecophagy

Fuhua Zhang et al. PeerJ. .

Abstract

Background: The gut microbiomes of mammals are closely related to the diets of their hosts. The Sunda pangolin (Manis javanica) is a specialized myrmecophage, but its gut microbiome has rarely been studied.

Methods: Using high-throughput Illumina barcoded 16S rRNA amplicons of nine fecal samples from nine captive Sunda pangolins, we investigated their gut microbiomes.

Results: The detected bacteria were classified into 14 phyla, 24 classes, 48 orders, 97 families, and 271 genera. The main bacterial phyla were Firmicutes (73.71%), Proteobacteria (18.42%), Actinobacteria (3.44%), and Bacteroidetes (0.51%). In the PCoA and neighbor-net network (PERMANOVA: pangolins vs. other diets, weighted UniFrac distance p < 0.01, unweighted UniFrac distance p < 0.001), the gut microbiomes of the Sunda pangolins were distinct from those of mammals with different diets, but were much closer to other myrmecophages, and to carnivores, while distant from herbivores. We identified some gut microbiomes related to the digestion of chitin, including Lactococcus, Bacteroides, Bacillus, and Staphylococcus species, which confirms that the gut microbiome of pangolins may help them to digest chitin.

Significance: The results will aid studies of extreme dietary adaption and the mechanisms of diet differentiation in mammals, as well as metagenomic studies, captive breeding, and ex situ conservation of pangolins.

Keywords: 16S rRNA sequencing; Convergence; Gut microbiome; Myrmecophage; Pholidota.


Conflict of interest statement

The authors declare there are no competing interests.

Figures

Figure 1
Figure 1. Length distribution of the clean sequences.
The x-axis indicates the sequence lengths and the y-axis represents the sequence numbers.
Figure 2
Figure 2. Rarefaction curves and rank abundance curves for the nine samples.
Different colored lines are different samples. (A) Rarefaction curves reflect the rationality of the sequencing data size and abundance. (B) Rank abundance curves reflect the evenness and abundance horizontally and vertically.
Figure 3
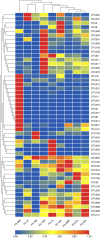
Figure 3. Clustering heatmap showing the 50 most abundant operational taxonomic units (OTUs).
The x-axis indicates the nine samples and the y-axis represents the 50 most abundant OTUs. Each color in the middle heatmap represents the relative abundance of the OTU in that row after normalization. The redder the color, the greater the abundance of the OTU in the sample.
Figure 4
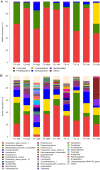
Figure 4. Sunda pangolin gut microbial composition.
(A) The phylum levels. (B) The genus levels. The x-axis indicates the nine samples and the y-axis represents the relative abundance.
Figure 5
Figure 5. The microbial community with the greatest abundance of all samples at the genus level. The corresponding phylum level classification of the microbiomes is also shown.
The same color represents the same phylum. The x-axis indicates the genus level and the y-axis represents relative abundance.
Figure 6
Figure 6. Principal coordinates analysis plot (A) and nonmetric multidimensional scaling (B) of the nine samples based on Bray–Curtis distances.
The distances between the sample points represent the similarity of the microbiota in the samples. A closer distance represents greater similarity and samples that cluster together have a similar microbiota.
Figure 7
Figure 7. Principal coordinates analysis plot of 56 samples.
(A) Based on weighted UniFrac distances. (B) Based on unweighted UniFrac distances. These samples were divided into seven categories. Samples in the same group are represented by the same color and shape. PC1_vs_PC2 is the PCoA plot obtained from the first and second main coordinates; the x- and y-axis represent the first and second main coordinates, respectively. The distances between the sample points represent the similarity of their microbiotas. A closer distance represents greater similarity and samples that cluster together have a similar microbiota.
Figure 8
Figure 8. Neighbor-net network of 56 samples.
(A) Based on weighted UniFrac distances. (B) Based on unweighted UniFrac distances. These samples were divided into seven categories. Samples in the same group are represented by the same color and shape.

References

    1. Allali I, Arnold JW, Roach J, Cadenas MB, Butz N, Hassan HM, Koci M, Ballou A, Mendoza M, Ali R, Azcarate-Peril MA. A comparison of sequencing platforms and bioinformatics pipelines for compositional analysis of the gut microbiome. BMC Microbiology. 2017;17:194. doi: 10.1186/s12866-017-1101-8. - DOI - PMC - PubMed
    1. Almonacid DE, Kraal L, Ossandon FJ, Budovskaya YV, Cardenas JP, Bik EM, Goddard AD, Richman J, Apte ZS. 16S rRNA gene sequencing and healthy reference ranges for 28 clinically relevant microbial taxa from the human gut microbiome. PLOS ONE. 2017;12:e0176555. doi: 10.1371/journal.pone.0176555. - DOI - PMC - PubMed
    1. Anand AAP, Vennison SJ, Sankar SG, Prabhu DIG, Vasan PT, Raghuraman T, Geoffrey CJ, Vendan SE. Isolation and characterization of bacteria from the gut of Bombyx mori that degrade cellulose, xylan, pectin and starch and their impact on digestion. Journal of Insect Science. 2010;10:107. - PMC - PubMed
    1. Beier S, Bertilsson S. Bacterial chitin degradation-mechanisms and ecophysiological strategies. Frontiers in Microbiology. 2013;4:149. - PMC - PubMed
    1. Bolger AM, Lohse M, Usadel B. Trimmomatic: a flexible trimmer for Illumina Sequence Data. Bioinformatics. 2014;30(15):2114–2120. doi: 10.1093/bioinformatics/btu170. - DOI - PMC - PubMed

LinkOut - more resources