. 2021 May 1;8(11):2004168.
doi: 10.1002/advs.202004168. eCollection 2021 Jun.

Mistranslation Drives Alterations in Protein Levels and the Effects of a Synonymous Variant at the Fibroblast Growth Factor 21 Locus

Affiliations

Mistranslation Drives Alterations in Protein Levels and the Effects of a Synonymous Variant at the Fibroblast Growth Factor 21 Locus

Ali Bayoumi et al. Adv Sci (Weinh). .

Abstract

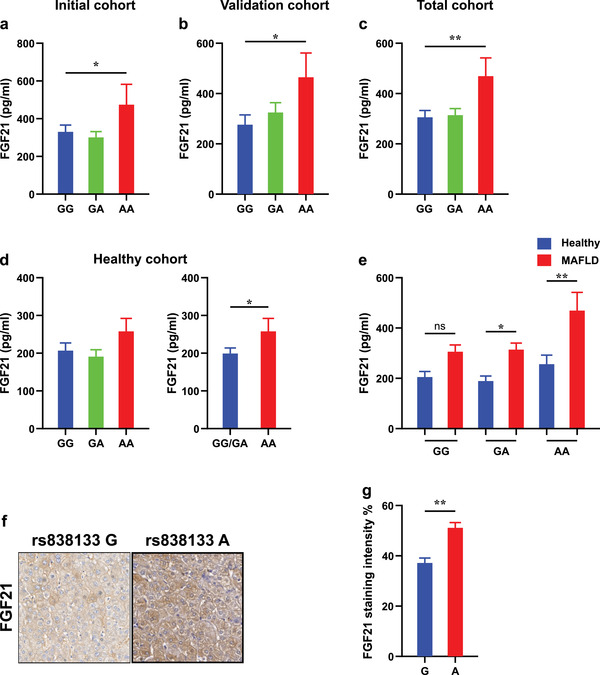
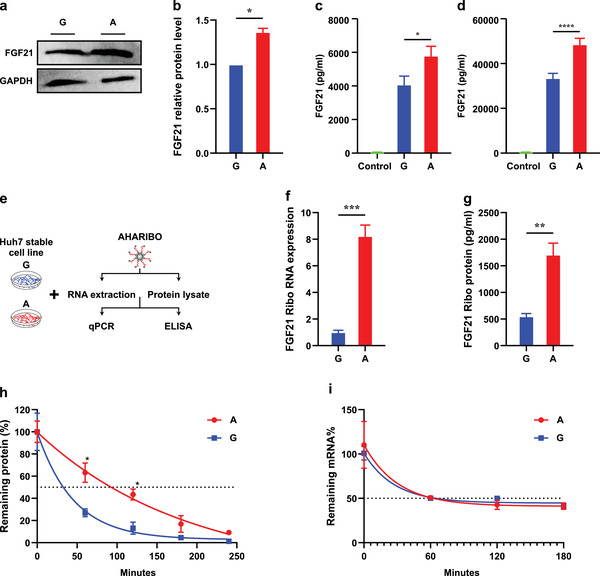
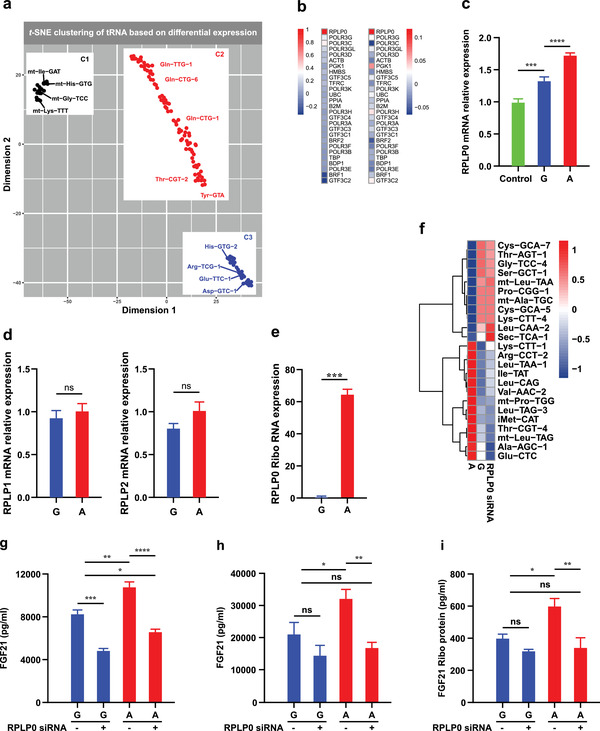
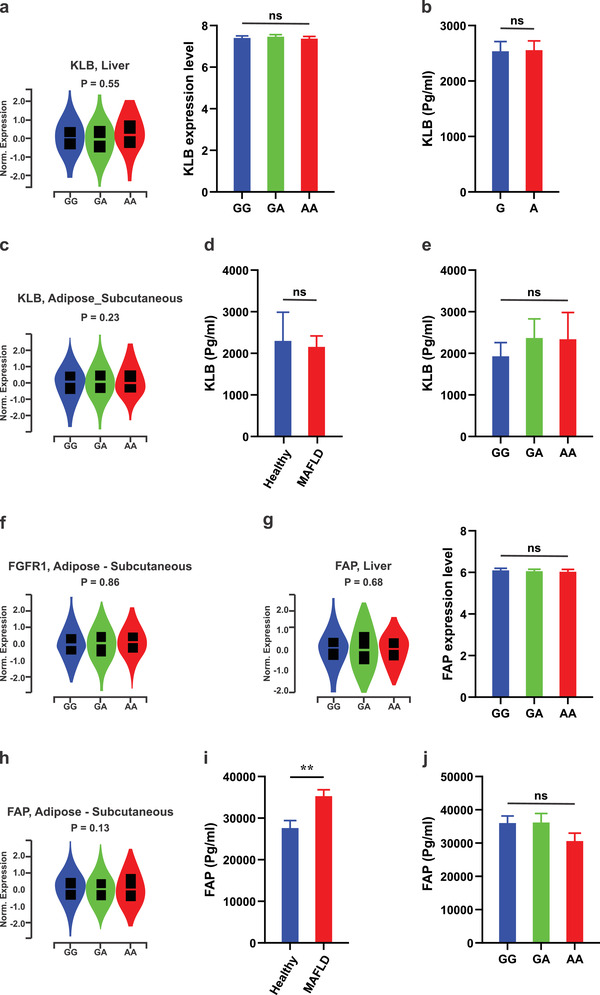
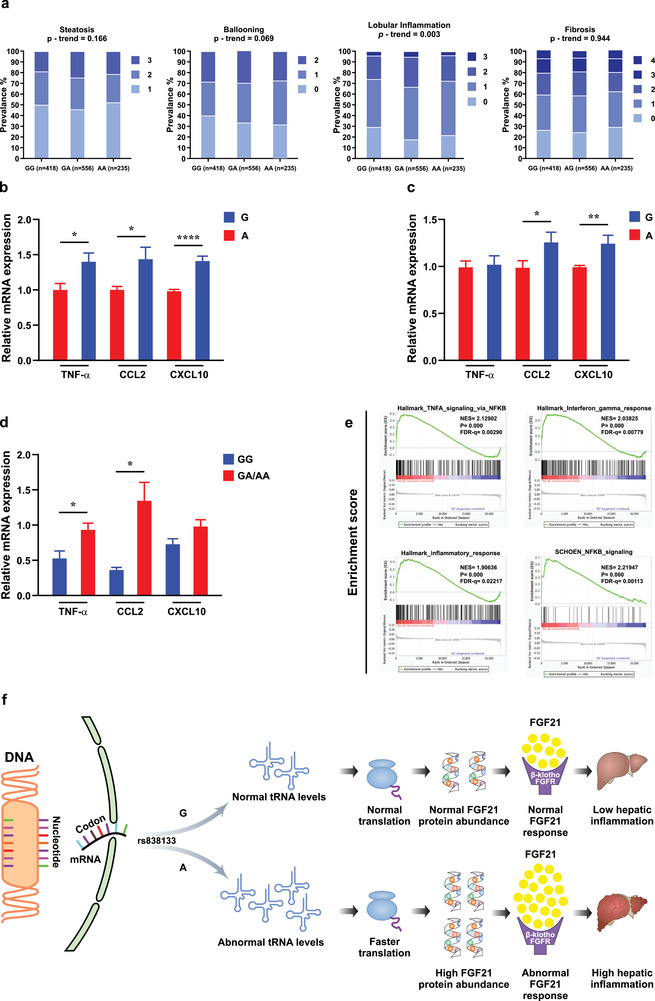
Fibroblast growth factor 21 (FGF21) is a liver-derived hormone with pleiotropic beneficial effects on metabolism. Paradoxically, FGF21 levels are elevated in metabolic diseases. Interventions that restore metabolic homeostasis reduce FGF21. Whether abnormalities in FGF21 secretion or resistance in peripheral tissues is the initiating factor in altering FGF21 levels and function in humans is unknown. A genetic approach is used to help resolve this paradox. The authors demonstrate that the primary event in dysmetabolic phenotypes is the elevation of FGF21 secretion. The latter is regulated by translational reprogramming in a genotype- and context-dependent manner. To relate the findings to tissues outcomes, the minor (A) allele of rs838133 is shown to be associated with increased hepatic inflammation in patients with metabolic associated fatty liver disease. The results here highlight a dominant role for translation of the FGF21 protein to explain variations in blood levels that is at least partially inherited. These results provide a framework for translational reprogramming of FGF21 to treat metabolic diseases.

Keywords: fibroblast growth factor 21; genetics; metabolic; metabolic associated fatty liver disease.


Conflict of interest statement

The authors declare no conflict of interest.

Figures

Figure 1
Figure 1
The rs838133 minor allele affects FGF21 protein levels. FGF21 serum levels are elevated in patients carrying the AA genotype compared to those carrying one or two copies of the (G) allele a) in the initial cohort (n = 200), b) in the validation cohort (n = 211), c) the total cohort (n = 411), and d) in the healthy cohort (n = 211). e) The changes in serum FGF21 levels between patients with MAFLD (n = 411) and healthy controls (n = 211) was significant in subjects carrying the (A) allele but not in those with two copies of the (G) allele. Representative liver expression pattern of FGF21 in control subjects carrying the rs838133 AA and GG genotypes. f) Original magnification: 200×. g) The intensity of FGF21 expression in control subjects carrying the rs838133 AA and GG genotypes quantified digitally using ImageJ (n = 3, per each group). Statistical differences between groups was assessed by one‐way ANOVA; multiple comparisons were by Bonferroni correction or by t‐test, as appropriate (*p < 0.05, ** p < 0.01). The data presented are mean ± SEM.
Figure 2
Figure 2
rs838133 minor (A) allele increases FGF21 protein expression via increasing translation efficiency and reducing protein degradation. Huh7 cells stably expressing either the A or G alleles of rs838133 of FGF21 were analyzed. a) Western blot analysis of FGF21 and GAPDH. b) Graph represents quantification of Western blots with fold change compared to the (G) allele. FGF21 protein level measured by ELISA in c) cell lysate and d) secreted FGF21 in medium. e) Illustration of the experimental workflow to study translational efficiency. f) qRT‐PCR of FGF21 mRNA normalized to GAPDH in the ribosomal fraction in the A and G alleles. g) ELISA analysis of FGF21 association with active ribosomes in the A and G alleles. Cells were transiently transfected with the G or A allele during the cycloheximide‐chase assay. h) Results of one‐phase decay after treatment with cycloheximide (CHX, 100 µg mL−1) for FGF21 in the A and G allele; half‐life determinations are shown from three independent transfections (A allele, ≈129.7 min, G allele, ≈31.48 min). i)Huh7 cells stably expressing the A and G alleles of rs838133 of FGF21 were analyzed for stability of FGF21 mRNA. Cells were treated with actinomycin D to arrest new transcription and is presented as mRNA remaining over time relative to that at 0 h set as 100%. Half‐life (50% mRNA remaining [dashed line]): A allele, 30.52 min; G allele, 27.46 min. Values of three independent replicates are represented by vertical bars and are mean ± SEM; *p < 0.05 using the student t‐test.
Figure 3
Figure 3
RPLP0 abundance determined effects of rs838133 on translation efficiency. a)Multivariate analysis of the tRNA expression patterns using t‐SNE. Three groups of tRNAs (C1, C2, and C3) are highlighted. b)Heatmap of quantification of change in abundance of transcription of 28 tRNA‐associated genes in Huh7 cells stably expressing the A and G alleles of rs838133 of FGF21 analyzed by TaqMan Array and in GEO: GSE32504 and GSE39036, respectively. This showed a unique upregulation in RPLP0 in A allele‐expressing cells c) that was confirmed by RT‐PCR, d) with no changes in other RPLP proteins (RPLP1 and RPLP2). e) The normalized fraction of RPLP0 transcripts associating with actively translating ribosomes was higher in the minor (A) allele compared to the major (G) allele. f) Hierarchical clustering of tRNAs based on their relative changes in abundance upon RPLP0 inhibition by siRNA. RPLP0 inhibition by siRNA decreases FGF21 protein level measured by ELISA g) in cell lysates and h) secreted in medium and i) in active ribosomes in the (A) allele cells restoring it to levels comparable to that in (G) cells. Values of three independent replicates are represented by vertical bars and are mean ± SEM; *p < 0.05 using the student t‐test or one‐way ANOVA; multiple comparisons were by Bonferroni correction, as appropriate.
Figure 4
Figure 4
The rs838133 minor allele does not affect FGF21 receptor and FAP levels. a) rs838133 is not associated with KLB gene expression in the liver based on the Genotype‐Tissue Expression (GTEx) data and the GEO dataset (GEO: GSE32504 and GSE39036). b) No difference was observed in steady‐state KLB mRNA expression levels between stably expressing cells of the two alleles of rs838133. c) This variant was not associated with KLB gene expression in adipose tissue from the GTEx database. Circulating KLB concentration was not significantly different between patients with d) MAFLD (n = 200) and healthy individuals (n = 44), or e) according to rs838133 genotype in patients with MAFLD. f) rs838133 is not associated with FGFR1 gene expression in adipose tissue from the GTEx database. rs838133 is not associated with FAP gene expression in the liver in g) both the GTEx database and the GEO dataset or in h) adipose tissue. i) Circulating FAP concentration was higher in patients with MAFLD (n = 200) compared to controls (n = 44). j) In patients with MAFLD, FAP serum levels were not associated with rs838133.
Figure 5
Figure 5
The rs838133 minor allele impacts the acquisition of a proinflammatory phenotype in hepatocytes. a) Histological features were evaluated in a large cohort of biopsy‐proven patients with MAFLD (n = 1209). GG, homozygotes for the G allele; GA, heterozygotes; AA, homozygotes for the A allele. Numbers per each genotype are presented under the figure. Genetic analyses were calculated by using an additive model; p‐values represent the significance for trend in the prevalence of more severe degrees of histologic damage among the genotypes. Huh7 cells stably expressing the A allele had lower levels of TNF‐α, CCL2, and CXCL10 in response to b) TLR4 (LPS, 500 ng) or c) palmitic acid and oleate (200 and 400 um, respectively) after 24 h challenge, compared to the G allele (n = 3). d) Comparison between hepatic expression of inflammatory markers between subjects carrying the (A) allele (n = 7) or (GG) homozygous genotype (n = 3) shows that the minor allele (A) carriers express higher proinflammatory markers (TNF‐α, CCL2, and CXCL10). e) Gene set enrichment analysis (GSEA) analysis for the NCBI Gene Expression Omnibus (GEO) database (GEO: GSE32504 and GSE39036) that contains transcriptomic and genotype profiles, respectively, of 149 liver samples of Caucasian origin subjects shows over‐representation of genes encoding inflammatory pathway in the (A) allele versus those with two copies of the (G) allele. f) Proposed model for the functional effects for the synonymous single nucleotide polymorphism rs838133 via mistranslation and alteration of protein abundance. mRNA expression was analyzed by real‐time PCR and normalized to GAPDH. Data are represented by vertical bars and are mean ± SEM; *p < 0.05 using the student t‐test. Abbreviations: TNFα, tumor necrosis factor alpha; C–X–C motif chemokine 10 (CXCL10) also known as interferon γ‐induced protein 10 kDa; Chemokine CCL2 (also known as monocyte chemoattractant protein‐1, MCP‐1).

Similar articles

Cited by

References

    1. Kliewer S. A., Mangelsdorf D. J., Cell Metab. 2019, 29, 246. - PMC - PubMed
    1. Zhang X., Yeung D. C., Karpisek M., Stejskal D., Zhou Z.‐G., Liu F., Wong R. L., Chow W.‐S., Tso A. W., Lam K. S., Diabetes 2008, 57, 1246. - PubMed
    1. Chavez A. O., Molina‐Carrion M., Abdul‐Ghani M. A., Folli F., DeFronzo R. A., Tripathy D., Diabetes Care 2009, 32, 1542. - PMC - PubMed
    1. Lehtonen J. M., Forsström S., Bottani E., Viscomi C., Baris O. R., Isoniemi H., Höckerstedt K., Österlund P., Hurme M., Jylhävä J., Neurology 2016, 87, 2290. - PMC - PubMed
    1. Shenoy V. K., Beaver K. M., Fisher F. M., Singhal G., Dushay J. R., Maratos‐Flier E., Flier S. N., PLoS One 2016, 11, e0164351. - PMC - PubMed

Publication types

Substances