. 2021 May 3;8(11):2004699.
doi: 10.1002/advs.202004699. eCollection 2021 Jun.

Hybrid Living Capsules Autonomously Produced by Engineered Bacteria

Affiliations

Hybrid Living Capsules Autonomously Produced by Engineered Bacteria

Daniel P Birnbaum et al. Adv Sci (Weinh). .

Abstract

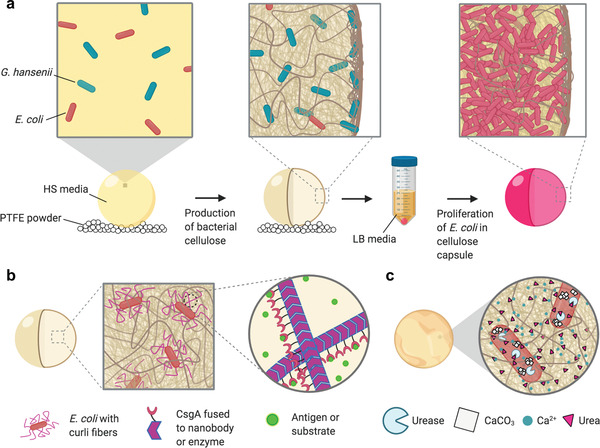
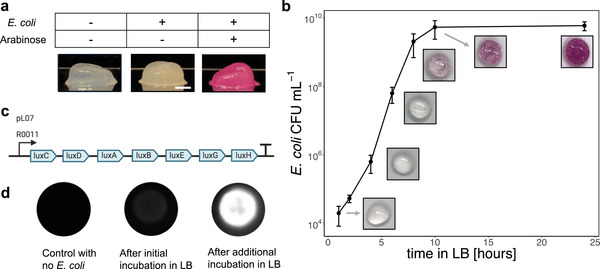
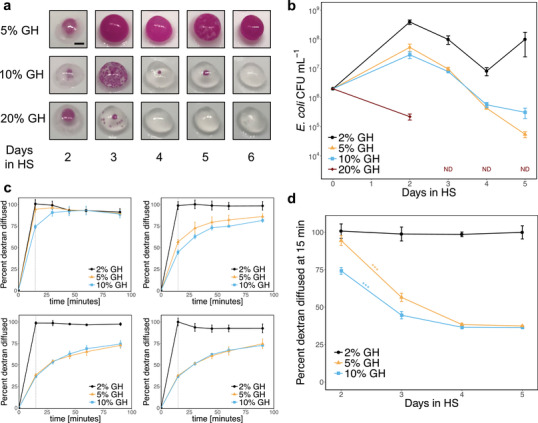
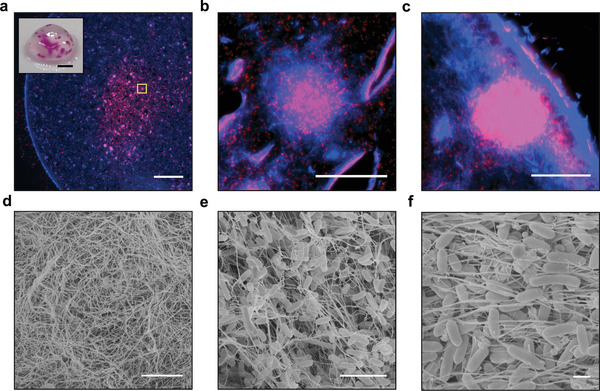
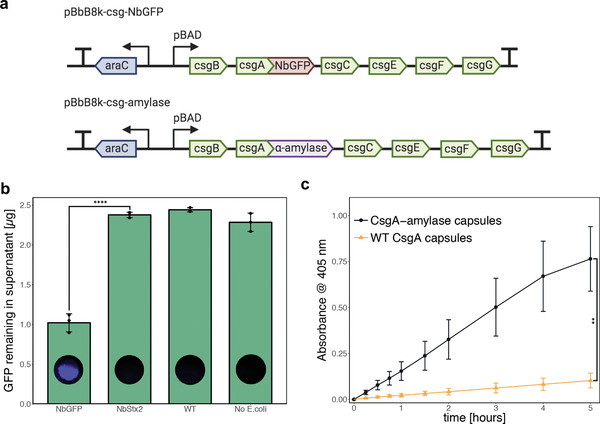
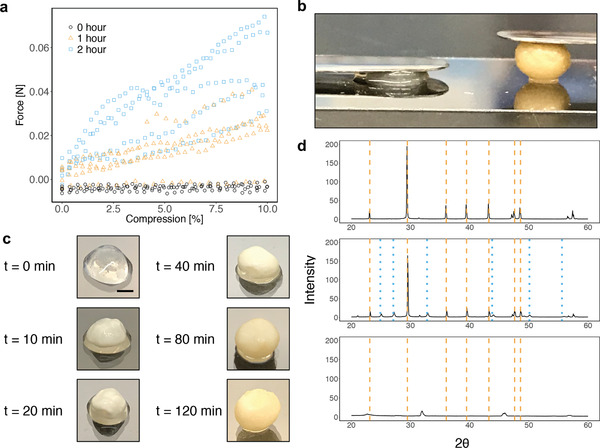
Bacterial cellulose (BC) has excellent material properties and can be produced sustainably through simple bacterial culture, but BC-producing bacteria lack the extensive genetic toolkits of model organisms such as Escherichia coli (E. coli). Here, a simple approach is reported for producing highly programmable BC materials through incorporation of engineered E. coli. The acetic acid bacterium Gluconacetobacter hansenii is cocultured with engineered E. coli in droplets of glucose-rich media to produce robust cellulose capsules, which are then colonized by the E. coli upon transfer to selective lysogeny broth media. It is shown that the encapsulated E. coli can produce engineered protein nanofibers within the cellulose matrix, yielding hybrid capsules capable of sequestering specific biomolecules from the environment and enzymatic catalysis. Furthermore, capsules are produced which can alter their own bulk physical properties through enzyme-induced biomineralization. This novel system uses a simple fabrication process, based on the autonomous activity of two bacteria, to significantly expand the functionality of BC-based living materials.

Keywords: bacterial cellulose; biomineralization; curli nanofibers; engineered living materials; synthetic biology.


Conflict of interest statement

The authors declare no conflict of interest.

Figures

Figure 1
Figure 1
Production of programmable hybrid living materials from bacterial coculture. a) Schematic showing coculture in HS media leading to production of bacterial cellulose, followed by transfer to LB media for selective proliferation of E. coli inside the BC capsule. b) Schematic showing functionalization of the capsule via production of engineered curli fibers by the encapsulated E. coli. c) Schematic showing biomineralization of the capsule through production of urease by the encapsulated E. coli leading to CaCO3 crystal growth in the presence of urea and Ca2+.
Figure 2
Figure 2
BC capsules containing a high concentration of programmable living E. coli. a) Images of BC capsules with and without engineered E. coli. The addition of arabinose during the LB incubation step induced RFP expression in the E. coli. Scale bar = 2 mm. b) Growth curve of encapsulated E. coli generated by degrading capsules after various incubation times in LB and plating on selective LB‐agar to quantify CFU. Data on E. coli cell density within the capsules is accompanied by images of the BC capsules containing RFP‐expressing E. coli. Values and error bars reflect the mean ± standard deviations (s.d.) of three biological replicates (n = 3). c) Plasmid pLO7 encodes constitutive expression of the luxCDABEGH operon. d) Capsules containing E. coli transformed with pLO7 were stored in PBS overnight following the initial incubation in LB. Some capsules were then incubated for an additional 2 h in fresh LB.
Figure 3
Figure 3
Effects of coculture parameters on E. coli survival and capsule permeability. GH refers to the relative volume of G. hansenii starter culture added to the HS coculture. a) Images of BC capsules containing RFP‐expressing E. coli. Scale bar = 2 mm. b) Survival of E. coli in capsules during the coculture in HS. After the incubation in HS, the capsules were degraded and plated on selective LB‐agar to quantify E. coli CFU. ND means that E. coli was not detected. The limit of detection for the assay was 103 CFU mL−1. Values and error bars reflect the mean ± s.d. of three biological replicates (n = 3). c) Diffusion of 500 kDa, FITC‐conjugated dextran out of the capsules. HS cocultures were supplemented with 0.5 mg mL−1 dextran and capsules were transferred to PBS after the HS incubation period. Permeability was assessed by measuring the FITC fluorescence of the surrounding solution over time. Top left: 2 d in HS. Top right: 3 d in HS. Bottom left: 4 d in HS. Bottom right: 5 d in HS. Values and error bars reflect the mean ± s.d. of three biological replicates (n = 3). Dotted lines indicate 15 min time point. d) Rate of dextran diffusion. The initial rate of dextran diffusion out of the capsules was estimated using the fluorescence of the supernatant after the capsules were incubated in PBS for 15 min. Values and error bars reflect the mean ± s.d. of three biological replicates (n = 3). For capsules inoculated with 5% or 10% G. hansenii, the amount of dextran which had diffused out after 15 min decreased significantly as HS incubation time was increased from 2 to 3 d (two‐sided Student t‐test for two means, P‐value = 0.00011 for 5% G. hansenii capsules, P‐value = 0.00010 for 10% G. hansenii capsules). *** indicates P‐value < 0.001.
Figure 4
Figure 4
Internal structure of BC capsules containing engineered E. coli. Panels (a)–(c) show 8 µm cross‐sections of a capsule prestained with cellulose stain Calcofluor White (CFW). CFW fluorescence is shown in blue and RFP fluorescence is shown in red. a) A large region of E. coli growth is visible in the core of the capsule. The outer wall of the capsule is visible as a bright blue band. Scale bar = 500 µm. Inset: A photograph of the capsule taken before staining with CFW; scale bar = 2 mm. b) Zoomed‐in view of the region in the yellow box in panel (a). Scale bar = 50 µm. c) View of an internal E. coli colony located against the outer wall of the capsule. Scale bar = 50 µm. Panels (d)–(f) show FESEM images of capsules. d) View of the outer wall of the capsule, showing a dense network of cellulose fibers. Scale bar = 5 µm. e) View of encapsulated E. coli enmeshed within the internal cellulose matrix. Scale bar = 5 µm. f) Another view of internal, encapsulated E. coli densely packed together. Scale bar = 1 µm.
Figure 5
Figure 5
Functional hybrid capsules containing engineered curli nanofibers. a) Plasmids encoding arabinose‐inducible expression of engineered curli fibers. b) Bar graph showing green fluorescent protein (GFP) levels in the supernatant after overnight incubation of capsules in 0.5 mL of purified GFP solution (4.6 µg mL−1 in PBS). Values and error bars reflect the mean ± s.d. of three biological replicates (n = 3). When the capsules contained curli fibers displaying a nanobody domain specific for GFP, there was a significant reduction in the GFP concentration (NbGFP vs NbStx2, two‐sided Student t‐test for two means, P‐value = 3.9 × 10⁻⁵). **** indicates P‐value < 0.0001. After the incubation in GFP solution, the capsules were washed and imaged for GFP fluorescence. c) Time course of α‐amylase activity in capsules, measured by incubation of the capsules in 0.5 mL of solution containing the chromogenic substrate 4‐nitrophenyl αd‐maltohexaoside (3 mg mL−1 in PBS), which produces a yellow solution upon cleavage by α‐amylase. Values and error bars reflect the mean ± s.d. of three biological replicates (n = 3). Capsules containing α‐amylase‐displaying curli fibers exhibited significantly more enzyme activity than capsules containing wild‐type curli fibers (comparison of values at 5 h time point, two‐sided Student t‐test for two means, P‐value = 0.0031). ** indicates P‐value < 0.01.
Figure 6
Figure 6
Biomineralization of capsules via urease expression in E. coli. a) Data from compression testing of capsules containing HB101 cells with plasmid pBR322‐Ure. The x‐axis shows the normalized distance between the compression plates where 0% represents the point of first contact between the capsule and top plate and 100% represents touching of the compression plates. Capsules were incubated in urea‐ and CaCl2‐containing media for 0, 1, or 2 h prior to testing. b) Image of capsules after an 8 h incubation in urea and CaCl2‐containing media. The left capsule contained HB101 cells with no plasmid and right capsule contained HB101 cells with plasmid pBR322‐Ure encoding the urease gene cluster from S. pasteurii. Each capsule has a 7 g stainless steel spatula resting on it. c) Images of HB101/pBR322‐Ure capsules incubated in urea and CaCl2‐containing media for various amounts of time. Scale bar = 2 mm. d) XRPD patterns. After the incubation in urea and CaCl2‐containing media, capsules were dried at room temperature and ground into a fine powder using a mortar and pestle prior to XRPD analysis. Top: precipitate from a culture of nonencapsulated HB101/pBR322‐Ure cells. Middle: Capsules containing HB101/pBR322‐Ure capsules. Bottom: Capsules containing HB101 with no plasmid. Dashed orange lines indicate peaks for calcite and dotted blue lines indicate peaks for vaterite.[ 53 , 54 ]

References

    1. Chen A. Y., Zhong C., Lu T. K., ACS Synth. Biol. 2015, 4, 8 - PMC - PubMed
    1. Nguyen P. Q., Courchesne N. D., Duraj‐Thatte A., Praveschotinunt P., Joshi N. S., Adv. Mater. 2018, 30, 1704847. - PMC - PubMed
    1. Gilbert C., Ellis T., ACS Synth. Biol. 2019, 8, 1. - PubMed
    1. Way J. C., Collins J. J., Keasling J. D., Silver P. A., Cell 2014, 157, 151. - PubMed
    1. Van Tittelboom K., De Belie N., De Muynck W., Verstraete W., Cem. Concr. Res. 2010, 40, 157.

Publication types

LinkOut - more resources