. 2021 Jun 16;9(17):4143-4158.
doi: 10.12998/wjcc.v9.i17.4143.

Why MUC16 mutations lead to a better prognosis: A study based on The Cancer Genome Atlas gastric cancer cohort

Affiliations

Why MUC16 mutations lead to a better prognosis: A study based on The Cancer Genome Atlas gastric cancer cohort

Yu-Jie Huang et al. World J Clin Cases. .

Abstract

Background: MUC16, encoding cancer antigen 125, is a frequently mutated gene in gastric cancer. In addition, MUC16 mutations seem to result in a better prognosis in gastric cancer. However, the mechanisms that lead to a better prognosis by MUC16 mutations have not yet been clarified.

Aim: To delve deeper into the underlying mechanisms that explain why MUC16 mutations signal a better prognosis in gastric cancer.

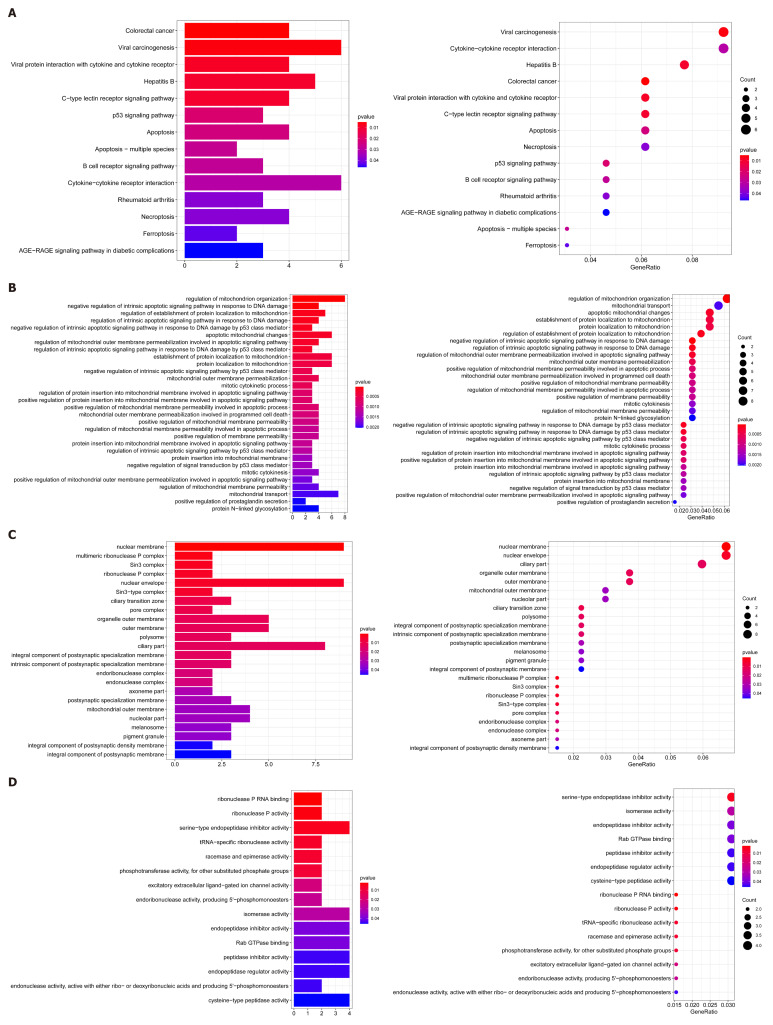
Methods: We used multi-omics data, including mRNA, simple nucleotide variation, copy number variation and methylation data from The Cancer Genome Atlas, to explore the relationship between MUC16 mutations and prognosis. Cox regression and random survival forest algorithms were applied to search for hub genes. Gene set enrichment analysis was used to elucidate the molecular mechanisms. Single-sample gene set enrichment analysis and "EpiDISH" were used to assess immune cells infiltration, and "ESTIMATE" for analysis of the tumor microenvironment.

Results: Our study found that compared to the wild-type group, the mutation group had a better prognosis. Additional analysis indicated that the MUC16 mutations appear to activate the DNA repair and p53 pathways to act as an anti-tumor agent. We also identified a key gene, NPY1R (neuropeptide Y receptor Y1), which was significantly more highly expressed in the MUC16 mutations group than in the MUC16 wild-type group. The high expression of NPY1R predicted a poorer prognosis, which was also confirmed in a separate Gene Expression Omnibus cohort. Further susceptibility analysis revealed that NPY1R might be a potential drug target for gastric cancer. Furthermore, in the analysis of the tumor microenvironment, we found that immune cells in the mutation group exhibited higher anti-tumor effects. In addition, the tumor mutation burden and cancer stem cells index were also higher in the mutation group than in the wild-type group.

Conclusion: We speculated that the MUC16 mutations might activate the p53 pathway and DNA repair pathway: alternatively, the tumor microenvironment may be involved.

Keywords: Cancer antigen 125; Gastric cancer; Gene Expression Omnibus; MUC16 mutation; Prognosis; The Cancer Genome Atlas.


Conflict of interest statement

Conflict-of-interest statement: None declared.

Figures

Figure 1
Figure 1
MUC16 mutations in relation to prognosis and tumor mutation burden. A: Waterfall plot showing the mutation information for each gene. Each color represents a type of mutation; B: Kaplan-Meier survival analysis was used to assess prognosis, with red representing the mutation group and blue representing the wild-type group; C: Boxplot showing the tumor mutation burden scores in the two groups. TMB: Tumor mutation burden.
Figure 2
Figure 2
MUC16 mutations and the tumor microenvironment. A-C: Violin plot showing tumor purity, immune score, and stromal score, respectively; D: Boxplot showing the difference in cancer stem cell index between the two groups; E: The infiltration of 28 immune cells in tumors was assessed using single-sample gene set enrichment analysis, red represents the mutation group and blue represents the wild-type group.
Figure 3
Figure 3
Differentially expressed genes and drug sensitivity. A: Volcano plot showing differentially expressed genes between the MUC16 mutation group and the MUC16 wild-type group, up-regulated genes are in red, down-regulated genes are in green, and black represents genes that are not differentially expressed; B: Error rate for the data as a function of the classification tree and out-of-bag importance values for the predictors; C: Genes of relative importance greater than 0.65; D: The plot showing the correlation between NPY1R expression and the sensitivity of gastric cancer cell lines to various drugs, with the three most negatively correlated drugs being WH-4-023, WZ-184, and Roscovitine. NPY1R: Neuropeptide Y receptor Y1.
Figure 4
Figure 4
Prognosis and gene set enrichment analysis. A and B: Kaplan-Meier survival analysis for The Cancer Genome Atlas (TCGA) and Gene Expression Omnibus (GEO) cohorts, respectively; C and D: Overall survival time distribution in the TCGA cohort and GEO cohort; E and F: Distribution of risk scores in TCGA and GEO cohorts; G and H: Gene set enrichment analysis in the TCGA and GEO cohorts, respectively. The plots on the left are the TCGA cohort and the plots on the right are the GEO cohort. NPY1R: Neuropeptide Y receptor Y1.
Figure 5
Figure 5
NPY1R and immune infiltration. A: The 6 immune cell types in each sample are shown in bar plots; B: The violin plot showing the differences in 6 immune cell types between the two groups; C: The correlation matrix demonstrated the correlations of 6 immune cell types; D: Heatmap revealing the distribution of 6 immune cell types in the two groups. NK: Natural killer; Mono: Monoclonal; Neutro: Neutrophil.
Figure 6
Figure 6
MUC16 mutations and copy number variations. A: The circle plot shows the location of differential copy number variations in the chromosome; B and C: The left boxplot shows the relationship between ING2 (inhibitor of growth gene 2) gain and deletion and the mRNA expression, the right boxplot shows the differential expression of ING2 in the MUC16 mutation and wild-type groups. ING2: Inhibitor of growth gene 2.
Figure 7
Figure 7
Gene set enrichment analysis. A: Kyoto Encyclopedia of Genes and Genomes enrichment results of the differential copy number variations; B-D: Gene Ontology enrichment results of the differential copy number variations.

References

    1. Zhang J, Piao HY, Wang Y, Meng XY, Yang D, Zhao Y, Zheng ZC. To Develop and Validate the Combination of RNA Methylation Regulators for the Prognosis of Patients with Gastric Cancer. Onco Targets Ther. 2020;13:10785–10795. - PMC - PubMed
    1. Chen X, Zhang D, Jiang F, Shen Y, Li X, Hu X, Wei P, Shen X. Prognostic Prediction Using a Stemness Index-Related Signature in a Cohort of Gastric Cancer. Front Mol Biosci. 2020;7:570702. - PMC - PubMed
    1. Chen W, Zheng R, Baade PD, Zhang S, Zeng H, Bray F, Jemal A, Yu XQ, He J. Cancer statistics in China, 2015. CA Cancer J Clin. 2016;66:115–132. - PubMed
    1. Van Cutsem E, Sagaert X, Topal B, Haustermans K, Prenen H. Gastric cancer. Lancet. 2016;388:2654–2664. - PubMed
    1. Li X, Pasche B, Zhang W, Chen K. Association of MUC16 Mutation With Tumor Mutation Load and Outcomes in Patients With Gastric Cancer. JAMA Oncol. 2018;4:1691–1698. - PMC - PubMed