Review
. 2021 May 6:7:100054.
doi: 10.1016/j.tcsw.2021.100054. eCollection 2021 Dec.

The role of pectin phase separation in plant cell wall assembly and growth

Affiliations
Review

The role of pectin phase separation in plant cell wall assembly and growth

Kalina T Haas et al. Cell Surf. .

Abstract

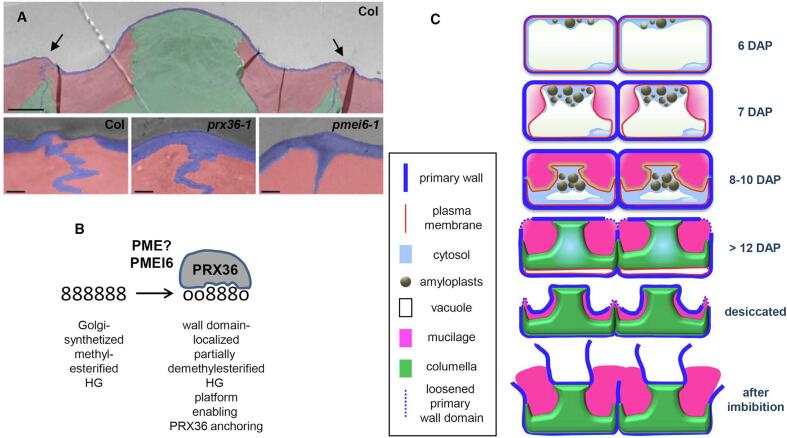
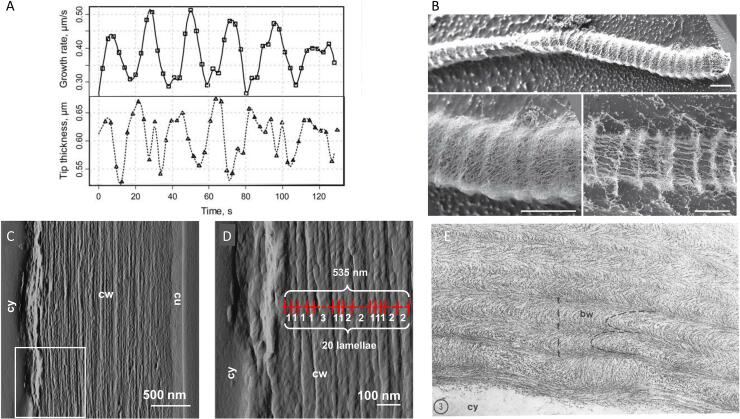
A rapidly increasing body of literature suggests that many biological processes are driven by phase separation within polymer mixtures. Liquid-liquid phase separation can lead to the formation of membrane-less organelles, which are thought to play a wide variety of roles in cell metabolism, gene regulation or signaling. One of the characteristics of these systems is that they are poised at phase transition boundaries, which makes them perfectly suited to elicit robust cellular responses to often very small changes in the cell's "environment". Recent observations suggest that, also in the semi-solid environment of plant cell walls, phase separation not only plays a role in wall patterning, hydration and stress relaxation during growth, but also may provide a driving force for cell wall expansion. In this context, pectins, the major polyanionic polysaccharides in the walls of growing cells, appear to play a critical role. Here, we will discuss (i) our current understanding of the structure-function relationship of pectins, (ii) in vivo evidence that pectin modification can drive critical phase transitions in the cell wall, (iii) how such phase transitions may drive cell wall expansion in addition to turgor pressure and (iv) the periodic cellular processes that may control phase transitions underlying cell wall assembly and expansion.

Keywords: Cell expansion; Pectin; Phase separation; Plant cell wall; Volume transition.


Conflict of interest statement

The authors declare that they have no known competing financial interests or personal relationships that could have appeared to influence the work reported in this paper.

Figures

Fig. 1
Fig. 1
Phase separation underlies pollen surface patterns. Top row: Numerical simulation of the development of pollen exine patterns. Simulated surface of a foam pattern that matches the SEM images of real pollen grains. The average wavelength of the simulations increases from left to right up to values of around 15 µm. The cross-sectional trajectory (bottom row) shows how phase separation of an initially homogenous primexine layer that is mechanically coupled to the plasma membrane leads to the formation of the patterned pollen surface (Radja et al., 2019). First 3 panels are drawings, last panel is a TEM image.
Fig. 2
Fig. 2
Pectin phase separation underlies surface patterning of Penium margaritaceum. (A) 3-D reconstruction of 0.2 µm CLSM sections of a premitotic cell, live-labeled with a monoclonal antibody against de-methylesterified HG (JIM5) and cultured for 1 h. The two equivalent-sized semicells (SC) are found on either side of the isthmus (arrow). The projections on the cell wall surface are clearly labeled on each semicell. An unlabeled band (i.e., the zone where new CW materials are secreted) is notable in the isthmus (arrow). Between the labeled cell wall and the unlabeled central band (arrowheads) are two ‘‘transition’’ zones where the outer projections have yet to form on the cell wall. Scale bar = 9 µm. (B) Premitotic cell labeled first with JIM5, recultured for 2 h, and then labeled with a monoclonal antibody against highly methylesterified HG (JIM7). A thin, JIM7-labeled band refered to as the homogalacturonan secretion band is found in the isthmus (arrowheads). This band is surrounded by two unlabeled zones (arrows) where new pectin was secreted and demethylesterified during the reculture stage. The typical JIM5 labeling is found on the cell walls at the polar zones of the two semicells (*). Scale bar, 15 µm. (C and D) Variable pressure scanning electron microscopy images of the isthmus zone of premitotic cells. (C) A cell in the early stages of cell expansion. The isthmus zone possesses a narrow band (arrow) devoid of the outer cell wall projections that are found on each semicell. (D) A cell in later stages of expansion. The band lacking the cell wall projections in the isthmus is still visible (arrow) together with flanking transition zones (*) that lead to the typical cell wall of the two semicells. Scale bar for (C), 3.5 µm; (D), 4 µm. (E,F) TEM images. (E) ‘‘mature’’ cell wall; highlights the three main layers: the inner fibrillar layer (IL), a more-electron-dense fibrillar median layer (ML), and an outer layer (OL), which forms outer cell wall surface projections. Scale bar, 250 nm. (F) isthmus region (large arrow) of a premitotic cell where HG secretion is occurring. In this isthmus zone, only the inner layer (IL) is found. As one moves toward both poles, the median layer (ML) and then the outer layer (OL) become apparent. Scale bar, 450 nm. ().
Fig. 3
Fig. 3
Common polysaccharides and homogalacturonan species in primary plant cell walls. (A) Most common cell wall polysaccharides and monosaccharides (Höfte and Voxeur, 2017). (B) Homogalacturonan (HG) is found as part of different block co-polymers. (I) APAP consisting of a arabinogalactan protein (AGP) an arabinogalactan (AP), connected to a xylan (xylan1) and a rhamnogalacturonan (RG)-I, which in turn is connected to a xylan (xylan2) and a HG, which in turn is connected to a RG-I; (II) as HG/RG-I copolymers, (III) HG/RG-II copolymers or (IV) as isolated HG chains. Adapted from (Atmodjo et al., 2013). (C) Higher-order organisation of HG chains. Pink and green zones represent methylesterified and demethylesterified domains, respectively and orange spheres Ca2+ ions. (I) Partially demethylesterified HG can form a Ca2+ crosslinked elastic network (Vincent et al., 2009), (II) HG with large (>9 residues) demethylesterified blocks form cooperative Ca2+ crosslinks (so-called eggboxes), (III) Highly methylesterified HG can form fibers crosslinked by hydrophobic interactions between methyl groups and hydrogen bonds involving rare free carboxylic acids (Walkinshaw and Arnott, 1981b). (For interpretation of the references to color in this figure legend, the reader is referred to the web version of this article.)
Fig. 4
Fig. 4
Pectin volume transition drives dicot pollen hydration (Fan et al., 2020). Pollen hydration/dehydration cycle of angiosperms with corresponding finite element analysis simulation images. The top sequence shows a dry pollen grain undergoing the pectin dependent water uptake process during germination. In situations where complete hydration is not possible, germination might be aborted, and the apertures close again as shown in the bottom sequence.
Fig. 5
Fig. 5
Pectin pattern-dependent targeting of cell wall-modifying enzyme to a cell wall domain. (A) False colored TEM view of a section through a mucilage-secreting cell of a dry Arabidopsis seed coat. Blue: primary wall; green: columella secondary wall; pink: mucilage; arrows: thin outer wall domain that yields during mucilage hydration. Upper image: lower magnification of a WT (Col). Lower images: higher magnification of WT (Col) and mutants for prx36-1 (peroxidase) and pmei6-1 (pectin methyl esterase inhibitor). The thin cell wall domain is absent in both mutants. Scale bars: 5 mm (wide view); 0.5 mm (zooms). (B) simplified model showing the molecular relationship between PMEI6 and PRX36. 8: methylesterified galacturonic acid; o: demethylated galacturonic acid. (C) Schematic view of mucilage secreting cell differentiation, dessication and rehydration. DAP: days after pollination. (). (For interpretation of the references to color in this figure legend, the reader is referred to the web version of this article.)
Fig. 6
Fig. 6
Homogalacturonan phase transition driving cell wall expansion. (A) lobe formation in an Arabidopsis pavement cell and the localisation of cellulose (blue), methylesterified (pink) and de-methylesterified (green) HG nanofibrils in the anticlinal (normal to the cell surface) cell walls of the lobes. (B,C) Super-resolution images (see also supplemental movies) of anticlinal walls doubly labeled with (B) antibodies against methylesterified (LM20, pink) and de-methylesterified (2F4, green) HG or (C) against partially methylesterified (JIM7, pink) and de-methylesterified (2F4, green) HG. 2F4 and LM20 reveal rows of epitopes oriented perpendicularly to the surface. In contrast JIM7 does not reveal oriented structures. In (B) and (C) white arrows indicate the center of the wall segments showed below as single color images. Scale bars = 500 nm. (D,E) Representation of the architecture of cellulose and HG filaments in anticlinal and periclinal (parallel to the surface) outer walls of pavement cells. (D) In anticlinal walls, methylesterified HG filaments (pink) are oriented perpendicular to the surface and parallel to cellulose microfibrils (blue). Partially de-methylesterified HG (recognized by JIM7) do not show a preferential orientation nor do the HGs in the periclinal wall. (E) According to the expanding beam model, lobe formation is initiated by the de-methylesterification of HG on the future convex side of the anticlinal wall, this triggers a phase transition in the HG filaments leading to the expansion of the anticlinal cell wall. The expansion is expected to create stresses in the periclinal wall (orange arrows), due to its extension at the concave side and compression on the convex side of the lobe, which might be relieved by local cell wall remodeling. Redrawn from (Haas et al., 2020b). (For interpretation of the references to color in this figure legend, the reader is referred to the web version of this article.)
Fig. 7
Fig. 7
Temporal and spatial periodicity in cell wall assembly and growth. (A) Growth rate and tip thickness oscillations in a lily pollen tube (adapted from (Mckenna et al., 2009)). (B) Scanning electron microscopy of tobacco pollen tubes fixed after EDTA extraction, showing periodic cell wall deposition patterns with a period of ~ 5 µm, which corresponds to the distance spanned during one growth rate period. Lower right panel was extracted for a longer time than the other two panels. Scale bars = 10 µm. (C,D) Periodic wall deposition patterns in onion epidermis cells. Cy: cytoplasm, cw: cell wall, cu: cuticle. (D) higher magnification of inset in (C) showing the dimensions of the wall layers. (E) Transmission electron microscopy on oblique sections through outer cell walls of dark-grown mung bean hypocotyl epidermis cells showing periodic helicoidal cell wall deposition patterns. Magnification x80000. cy: cytoplasm, bw: bow-shaped patterns. Adapted from (Derksen et al., 2011, McKenna et al., 2009, Reis et al., 1985, Zhang et al., 2016).

References

    1. Arend, M., Muninger, M., Fromm, J., 2008. Unique occurrence of pectin-like fibrillar cell wall deposits in xylem fibres of poplar. Plant Biol. https://doi.org/10.1111/j.1438-8677.2008.00082.x. - PubMed
    1. Atmodjo M.A., Hao Z., Mohnen D. Evolving views of pectin biosynthesis. Annu. Rev. Plant Biol. 2013;64(1):747–779. doi: 10.1146/annurev-arplant-042811-105534. - DOI - PubMed
    1. Bascom C.S., Jr., Hepler P.K., Bezanilla M. Interplay between Ions, the Cytoskeleton, and Cell Wall Properties during Tip Growth. Plant Physiol. 2018;176(1):28–40. doi: 10.1104/pp.17.01466. - DOI - PMC - PubMed
    1. Baskin, T.I., 2005. Anisotropic expansion of the plant cell wall. Annu. Rev. Cell Dev. Biol. 21, 203–222. https://doi.org/https://doi.org/10.1146/annurev.cellbio.20.082503.103053. - PubMed
    1. Bidhendi A.J., Altartouri B., Gosselin F.P., Geitmann A. Mechanical stress initiates and sustains the morphogenesis of wavy leaf epidermal cells. Cell Rep. 2019;28(5):1237–1250.e6. doi: 10.1016/j.celrep.2019.07.006. - DOI - PubMed

LinkOut - more resources