Review
. 2021 Oct;413(24):5927-5948.
doi: 10.1007/s00216-021-03425-1. Epub 2021 Jun 18.

Advanced tandem mass spectrometry in metabolomics and lipidomics-methods and applications

Affiliations
Review

Advanced tandem mass spectrometry in metabolomics and lipidomics-methods and applications

Sven Heiles. Anal Bioanal Chem. 2021 Oct.

Abstract

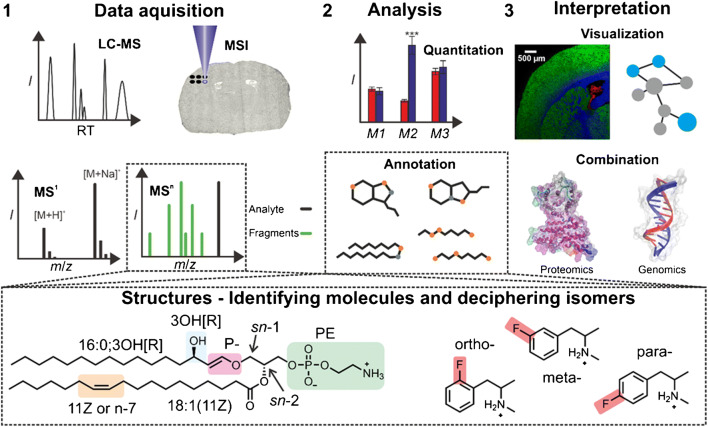
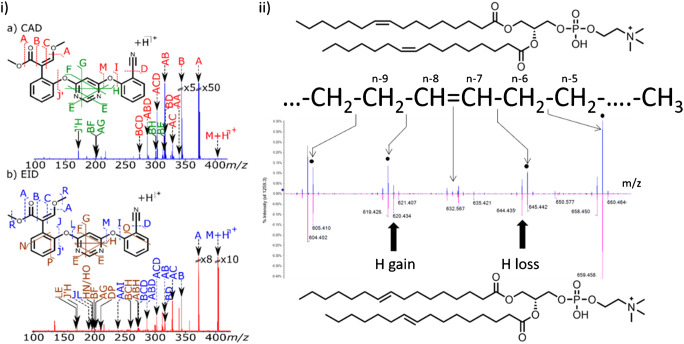
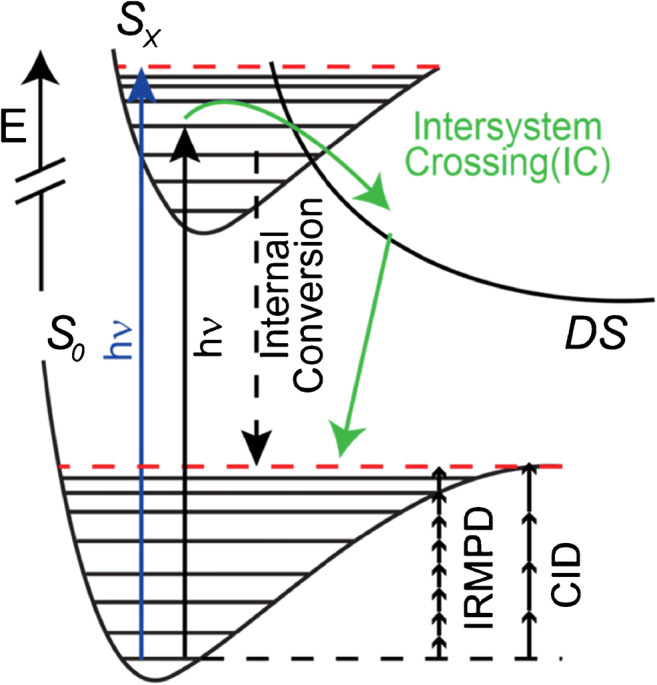
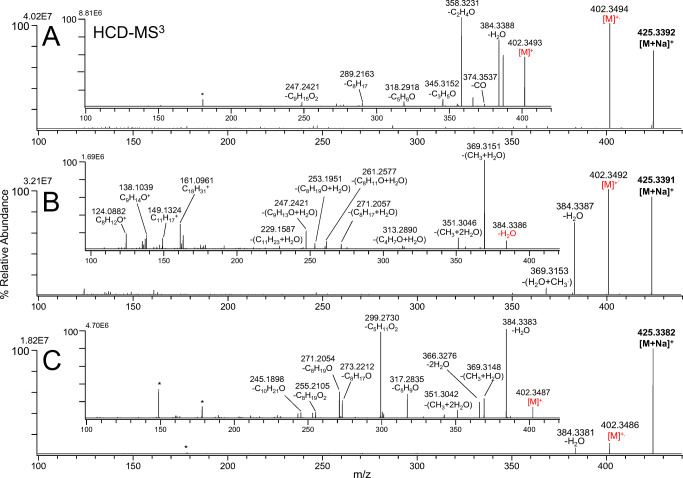
Metabolomics and lipidomics are new drivers of the omics era as molecular signatures and selected analytes allow phenotypic characterization and serve as biomarkers, respectively. The growing capabilities of untargeted and targeted workflows, which primarily rely on mass spectrometric platforms, enable extensive charting or identification of bioactive metabolites and lipids. Structural annotation of these compounds is key in order to link specific molecular entities to defined biochemical functions or phenotypes. Tandem mass spectrometry (MS), first and foremost collision-induced dissociation (CID), is the method of choice to unveil structural details of metabolites and lipids. But CID fragment ions are often not sufficient to fully characterize analytes. Therefore, recent years have seen a surge in alternative tandem MS methodologies that aim to offer full structural characterization of metabolites and lipids. In this article, principles, capabilities, drawbacks, and first applications of these "advanced tandem mass spectrometry" strategies will be critically reviewed. This includes tandem MS methods that are based on electrons, photons, and ion/molecule, as well as ion/ion reactions, combining tandem MS with concepts from optical spectroscopy and making use of derivatization strategies. In the final sections of this review, the first applications of these methodologies in combination with liquid chromatography or mass spectrometry imaging are highlighted and future perspectives for research in metabolomics and lipidomics are discussed.

Keywords: Biopolymers/lipids; HPLC; Lipidomics; Mass spectrometry imaging; Metabolomics; Tandem mass spectrometry.


Conflict of interest statement

The authors declare no competing interests.

Figures

Fig. 1
Fig. 1
An overview of MS-based metabolomic and lipidomic workflows. (1) Mass spectrometric data is collected after sample preparation. Typically, MS1 and MSn datasets are recorded. In case LC-MS or MSI is performed, every mass spectrum is associated with RTs and sampling positions, respectively. (2) Mass spectrometric intensities are used to quantitate fold changes and assign mass spectrometric features to specific compounds or compound groups. (3) In combination with additional data, e.g., from other omics disciplines (images created with VMD [10]) the data is visualized in order to interpret compound distributions or identify alterations of biochemical pathways. Dashed boxes: although MSn results and database searches yield a list of plausible annotations, some structural details are not resolved. Examples are the structures of PE-P 16:0;3OH[R]/18:1(11Z) and fluoromethamphetamine isomers that are not fully resolved based on CID-MSn results
Fig. 2
Fig. 2
(i) (a) CID-MS2 and (b) EID-MS2 of azoxystrobin. Some assigned cleavage sites and corresponding signals are labeled. Reprinted with permission from [42], copyright 2020 American Chemical Society. (ii) EID-MS2 of protonated (blue) PC 16:1(9Z)/16:1(9Z) and (purple) PC 16:1(9E)/16:1(9E). Adapted with permission from [43], copyright 2017 American Chemical Society
Scheme 1
Scheme 1
Jablonski diagram schematically showing ion activation and dissociation energetics by UV/IR photons or gas collisions
Fig. 3
Fig. 3
A, C MS3 and B MS4 of sodiated A 4β-OH cholesterol, B 7a-OH cholesterol, and C 25-OH cholesterol employing 213 nm UVPD followed by HCD allow to distinguish steroid isomers. Reprinted with permission from [68], copyright 2020 Elsevier B.V.
Fig. 4
Fig. 4
Selected mass spectrometric signals obtained by RDD of sodiated disaccharide isomers that allow isomer discrimination. Reprinted with permission from [87], copyright 2018 American Chemical Society
Fig. 5
Fig. 5
Ion/molecule reactions between BF3 and different glucuronides. Although O-glucuronides do not form ions with three neutral losses of HF, ion/molecule spectra of N- and acyl-glucuronides contain these diagnostic signals. The latter two glucuronides are distinguished by CID of ions with three HF losses. Reprinted with permission from [100], copyright 2019 American Chemical Society
Fig. 6
Fig. 6
Analysis of PE 36:2 from human plasma with ion/ion reactions. Deprotonated PE 36:2 reveals head group and FA composition upon a CID, b FA attached to [MgPhen3]2+ are formed after ion/ion reactions and beam-type CID. The resulting positive ions of c FA 18:2 and d FA 18:1 enable DB position assignment upon CID. Reprinted with permission from [106], copyright 2020 American Chemical Society
Scheme 2
Scheme 2
Derivatization strategies targeting lipid and metabolite DBs and enabling DB position assignment after tandem MS of product ions
Fig. 7
Fig. 7
Comparison of CID-MS3 of sodiated PC 16:0/18:1(9Z) (upper) before and (lower) after PB functionalization with 2-acetylpyridine. DB positions (red signals) and sn-isomers (blue signals) are only confidently identified after PB functionalization. Adapted with permission from [121], copyright 2020 the authors
Fig. 8
Fig. 8
IRMPD spectroscopy of three fluoroamphetamine isomers differing only in the position of the fluorine moiety. Spectroscopic features, especially those labeled with 3–8 are structurally diagnostic. Reprinted with permission from [134], copyright 2020 American Chemical Society
Fig. 9
Fig. 9
A Liquid chromatographic trace and associated BD RDD tandem mass spectra of isomeric functionalized FAs extracted from vernix caseosa. Due to extensive FA fragmentation, methyl-branching isomers are distinguished (green signals) on the chromatographic time scale. Reprinted with permission from [84], copyright 2019 American Chemical Society
Fig. 10
Fig. 10
(Left) Stained human adrenal gland revealing aldo-producing cell clusters in brown. (Middle) MALDI-MS3I of GirT-derivatized steroids with 120 μm step size. (Right) Zoom-in of microcopy and MSI results. Adapted with permission from [149], copyright 2019 American Chemical Society
Fig. 11
Fig. 11
Reactive MALDI-MS2I of protonated PB-derivatized PC 34:1 from mouse pancreas. (Left, middle) MS images of n-9 and n-7 with a pixel resolution of 10 μm. (Right) Immunofluerescence after MSI experiments revealing β-cells in red and cell nuclei in blue. Scale bars are 600 μm. Adapted with permission from [152], copyright 2020 American Chemical Society

References

    1. Han X. Lipidomics for studying metabolism. Nat Rev Endocrinol. 2016;12:668–679. - PubMed
    1. Rinschen MM, Ivanisevic J, Giera M, Siuzdak G. Identification of bioactive metabolites using activity metabolomics. Nat Rev Mol Cell Biol. 2019;20:353–367. - PMC - PubMed
    1. Sperber H, Mathieu J, Wang Y, Ferreccio A, Hesson J, Xu Z, Fischer KA, Devi A, Detraux D, Gu H, Battle SL, Showalter M, Valensisi C, Bielas JH, Ericson NG, Margaretha L, Robitaille AM, Margineantu D, Fiehn O, Hockenbery D, Blau CA, Raftery D, Margolin AA, Hawkins RD, Moon RT, Ware CB, Ruohola-Baker H. The metabolome regulates the epigenetic landscape during naive-to-primed human embryonic stem cell transition. Nat Cell Biol. 2015;17:1523–1535. - PMC - PubMed
    1. Nič M, Jirát J, Košata B, Jenkins A, McNaught A, editors. IUPAC compendium of chemical terminology. Research Triagle Park: IUPAC; 2009.
    1. Johnson CH, Ivanisevic J, Siuzdak G. Metabolomics: beyond biomarkers and towards mechanisms. Nat Rev Mol Cell Biol. 2016;17:451–459. - PMC - PubMed

LinkOut - more resources