

Mapping supply of and demand for ecosystem services to assess environmental justice in New York City
- PMID: 34142407
- PMCID: PMC8459239
- DOI: 10.1002/eap.2390
Mapping supply of and demand for ecosystem services to assess environmental justice in New York City
Abstract
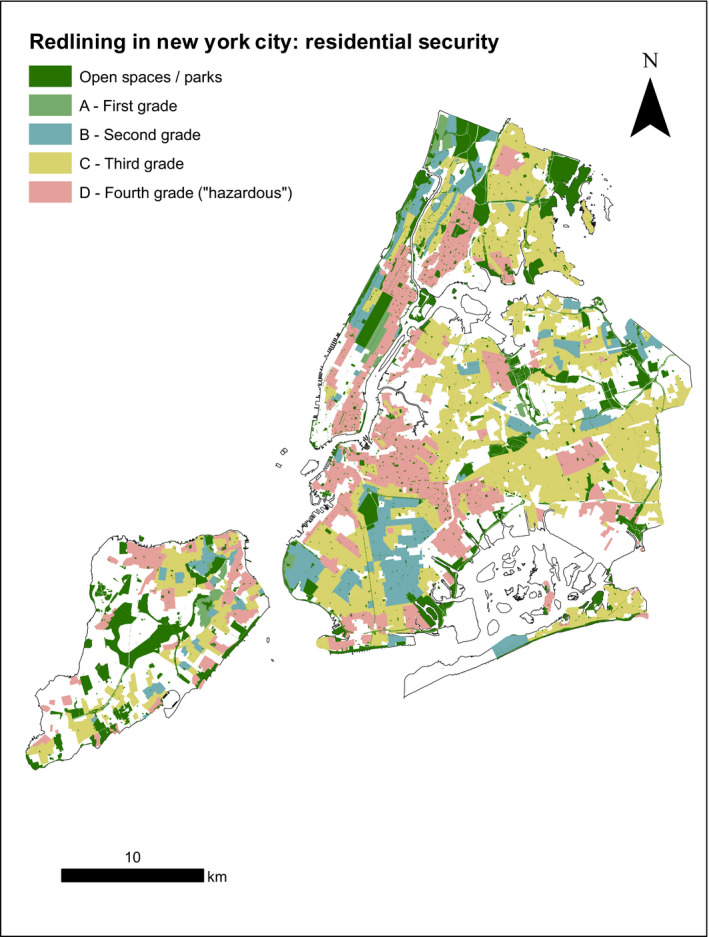
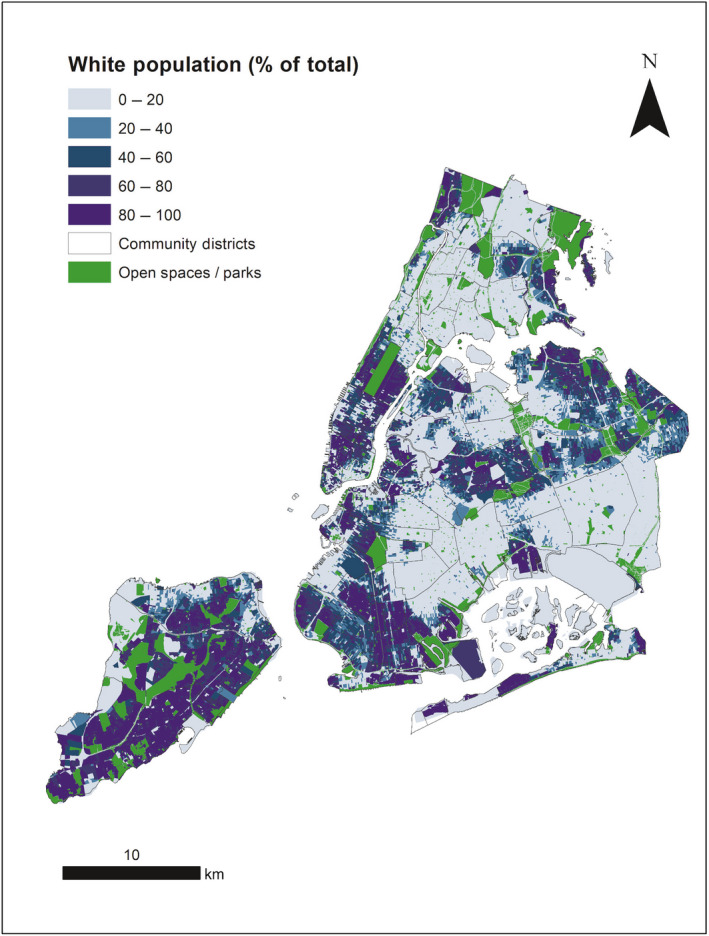
Livability, resilience, and justice in cities are challenged by climate change and the historical legacies that together create disproportionate impacts on human communities. Urban green infrastructure has emerged as an important tool for climate change adaptation and resilience given their capacity to provide ecosystem services such as local temperature regulation, stormwater mitigation, and air purification. However, realizing the benefits of ecosystem services for climate adaptation depend on where they are locally supplied. Few studies have examined the potential spatial mismatches in supply and demand of urban ecosystem services, and even fewer have examined supply-demand mismatches as a potential environmental justice issue, such as when supply-demand mismatches disproportionately overlap with certain socio-demographic groups. We spatially analyzed demand for ecosystem services relevant for climate change adaptation and combined results with recent analysis of the supply of ecosystem services in New York City (NYC). By quantifying the relative mismatch between supply and demand of ecosystem services across the city we were able to identify spatial hot- and coldspots of supply-demand mismatch. Hotspots are spatial clusters of census blocks with a higher mismatch and coldspots are clusters with lower mismatch values than their surrounding blocks. The distribution of mismatch hot- and coldspots was then compared to the spatial distribution of socio-demographic groups. Results reveal distributional environmental injustice of access to the climate-regulating benefits of ecosystem services provided by urban green infrastructure in NYC. Analyses show that areas with lower supply-demand mismatch tend to be populated by a larger proportion of white residents with higher median incomes, and areas with high mismatch values have lower incomes and a higher proportion of people of color. We suggest that urban policy and planning should ensure that investments in "nature-based" solutions such as through urban green infrastructure for climate change adaptation do not reinforce or exacerbate potentially existing environmental injustices.
Keywords: cities; climate change adaptation; regulating ecosystem services; resilience; spatial analysis; urban ecosystem services.
© 2021 The Authors. Ecological Applications published by Wiley Periodicals LLC on behalf of Ecological Society of America.
Figures


Similar articles
-
An improved method for assessing mismatches between supply and demand in urban regulating ecosystem services: A case study in Tabriz, Iran.PLoS One. 2019 Aug 15;14(8):e0220750. doi: 10.1371/journal.pone.0220750. eCollection 2019. PLoS One. 2019. PMID: 31415585 Free PMC article.
-
Under one canopy? Assessing the distributional environmental justice implications of street tree benefits in Barcelona.Environ Sci Policy. 2019 Dec;102:54-64. doi: 10.1016/j.envsci.2019.08.016. Environ Sci Policy. 2019. PMID: 31798338 Free PMC article.
-
Ecological management zone of Taiyuan City based on the supply and demand of ecosystem services.Ying Yong Sheng Tai Xue Bao. 2024 Jul 18;35(7):1925-1934. doi: 10.13287/j.1001-9332.202407.026. Ying Yong Sheng Tai Xue Bao. 2024. PMID: 39233422 English.
-
Urban ecosystem services for resilience planning and management in New York City.Ambio. 2014 May;43(4):502-15. doi: 10.1007/s13280-014-0509-8. Ambio. 2014. PMID: 24740621 Free PMC article. Review.
-
Exploring urban green packages as part of Nature-based Solutions for climate change adaptation measures in rapidly growing cities of the Global South.J Environ Manage. 2022 May 15;310:114786. doi: 10.1016/j.jenvman.2022.114786. Epub 2022 Feb 28. J Environ Manage. 2022. PMID: 35240569 Review.
Cited by
-
New York State Climate Impacts Assessment Chapter 04: Buildings.Ann N Y Acad Sci. 2024 Dec;1542(1):214-252. doi: 10.1111/nyas.15200. Epub 2024 Dec 9. Ann N Y Acad Sci. 2024. PMID: 39652388 Free PMC article.
-
Impervious cover change as an indicator of environmental equity.Remote Sens Appl. 2024 Aug;35:101247. doi: 10.1016/j.rsase.2024.101247. Remote Sens Appl. 2024. PMID: 39741903 Free PMC article.
-
New York State Climate Impacts Assessment Chapter 05: Ecosystems.Ann N Y Acad Sci. 2024 Dec;1542(1):253-340. doi: 10.1111/nyas.15203. Epub 2024 Dec 9. Ann N Y Acad Sci. 2024. PMID: 39652386 Free PMC article.
-
Realizing multispecies justice through a capability approach to promote nature-based solutions.NPJ Urban Sustain. 2025;5(1):31. doi: 10.1038/s42949-025-00205-z. Epub 2025 May 28. NPJ Urban Sustain. 2025. PMID: 40453562 Free PMC article.
-
From urban ecology to urban enquiry: How to build cumulative and context-sensitive understandings.Ambio. 2024 Jun;53(6):813-825. doi: 10.1007/s13280-023-01959-5. Epub 2024 Apr 20. Ambio. 2024. PMID: 38643344 Free PMC article.
References
-
- Amorim Maia, A. T., Calcagni F., Connolly J. J. T., Anguelovski I., and Langemeyer J.. 2020. Hidden drivers of social injustice: uncovering unequal cultural ecosystem services behind green gentrification. Environmental Science & Policy 112:254–263.
-
- Andersson, E., McPhearson T., Kremer P., Gomez‐Baggethun E., Haase D., Tuvendal M., and Wurster D.. 2015. Scale and context dependence of ecosystem service providing units. Ecosystem Services 12:157–164.
-
- Baró, F., Palomo I., Zulian G., Vizcaino P., Haase D., and Gómez‐Baggethun E.. 2016. Mapping ecosystem service capacity, flow and demand for landscape and urban planning: A case study in the Barcelona metropolitan region. Land Use Policy 57:405–417.
-
- Bauer, T. J.2020. Interaction of urban heat island effects and land‐sea breezes during a New York City heat event. Journal of Applied Meteorology and Climatology 59:477–495.
Publication types
MeSH terms
LinkOut - more resources
Full Text Sources
Medical
