

Inclusion of cGAMP within virus-like particle vaccines enhances their immunogenicity
- PMID: 34142428
- PMCID: PMC8339669
- DOI: 10.15252/embr.202152447
Inclusion of cGAMP within virus-like particle vaccines enhances their immunogenicity
Abstract
Cyclic GMP-AMP (cGAMP) is an immunostimulatory molecule produced by cGAS that activates STING. cGAMP is an adjuvant when administered alongside antigens. cGAMP is also incorporated into enveloped virus particles during budding. Here, we investigate whether inclusion of cGAMP within viral vaccine vectors enhances their immunogenicity. We immunise mice with virus-like particles (VLPs) containing HIV-1 Gag and the vesicular stomatitis virus envelope glycoprotein G (VSV-G). cGAMP loading of VLPs augments CD4 and CD8 T-cell responses. It also increases VLP- and VSV-G-specific antibody titres in a STING-dependent manner and enhances virus neutralisation, accompanied by increased numbers of T follicular helper cells. Vaccination with cGAMP-loaded VLPs containing haemagglutinin induces high titres of influenza A virus neutralising antibodies and confers protection upon virus challenge. This requires cGAMP inclusion within VLPs and is achieved at markedly reduced cGAMP doses. Similarly, cGAMP loading of VLPs containing the SARS-CoV-2 Spike protein enhances Spike-specific antibody titres. cGAMP-loaded VLPs are thus an attractive platform for vaccination.
Keywords: SARS-CoV-2; cGAMP; influenza A virus; type I interferon; viral vaccine vector.
© 2021 The Authors. Published under the terms of the CC BY 4.0 license.
Conflict of interest statement
The authors declare that they have no conflict of interest.
Figures
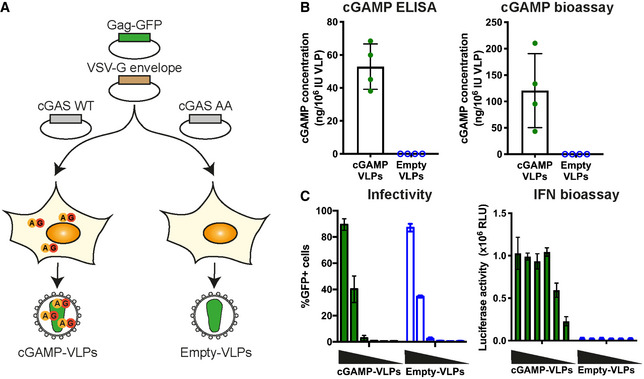
Schematic representation of cGAMP‐ and Empty‐VLP production. HEK293T cells were transfected with plasmids encoding HIV‐1 Gag‐GFP and VSV‐G envelope to enable VLP production. Overexpression of cGAS WT in the same cells generated cGAMP that was then incorporated into nascent VLPs (cGAMP‐VLPs). As control, Empty‐VLPs were produced in cells where a catalytically inactive cGAS (cGAS AA) was overexpressed.
cGAMP is incorporated into cGAMP‐VLPs. Small molecules were extracted from VLP preparations, and the cGAMP concentration was measured using a cGAMP ELISA and a cGAMP bioassay.
cGAMP‐VLPs induce an IFN‐I response in target cells. HEK293 cells were infected with decreasing amounts of cGAMP‐VLPs and Empty‐VLPs (1/5 serial dilutions starting at 2 µl of VLP stocks per well), and the infection was monitored 24 h later by quantifying GFP+ cells by flow cytometry. Supernatants from the same infected cells were then transferred to a reporter cell line expressing firefly luciferase under a promoter induced by IFN‐I (ISRE). Luciferase activity measured 24 h later indicated the presence of IFN‐I in the supernatants.
- A–C
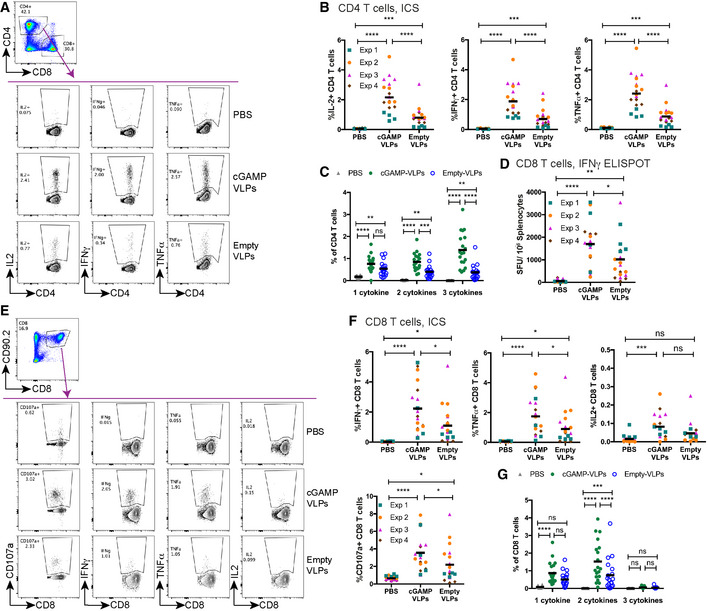
Immunisation with cGAMP‐VLPs enhances VLP‐specific CD4 T‐cell responses. BMMCs from C57BL/6 mice were pulsed overnight with cGAMP‐VLPs and used to stimulate cells from spleens of immunised mice. Cells were co‐cultured for 6 h prior to evaluation of CD4 T‐cell responses by ICS. CD4 T cells were gated as live, MHC‐II−, CD4+, CD8−. CD4 T cells expressing IL2, IFNγ or TNFα were analysed as shown in (A). The percentage of total CD4 T cells producing each cytokine is shown in (B), and the percentage of CD4 T cells co‐producing 1, 2 or 3 cytokines is shown in (C).
- D–G
Immunisation with cGAMP‐VLPs facilitates induction of HIV‐1 Gag‐specific polyfunctional CD8 T‐cell responses. Cells from spleens of immunised mice were stimulated with the HIV‐SQV peptide. IFNγ‐producing cells were enumerated by ELISPOT 24 h after stimulation with peptide (D). Alternatively, cells were analysed by ICS 6 h after stimulation with peptide. CD8 T cells were gated as live, CD90.2+, CD8+. CD8 T cells expressing CD107a, IFNγ, TNFα or IL2 were analysed as shown in (E). Panel F shows the percentage of total CD8 T cells upregulating CD107a and/or producing each cytokine, and panel G shows the percentage of CD8 T cells co‐producing 1, 2 or 3 cytokines.
- A, B
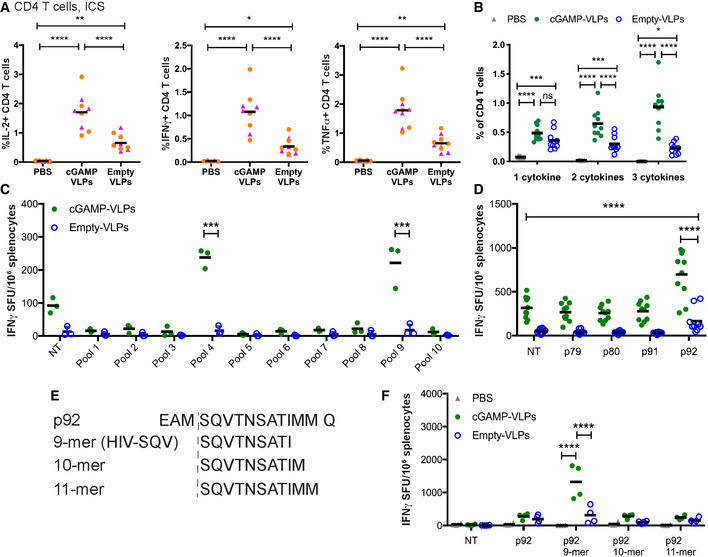
BMMCs from C57BL/6 mice were pulsed overnight with Empty‐VLPs and used to stimulate cells from spleens of immunised mice. Cells were co‐cultured for 6 h prior to evaluation of CD4 T‐cell responses by ICS. CD4 T cells were gated as shown in Fig 2A. The percentage of total CD4 T cells producing each cytokine is shown in (A), and the percentage of CD4 T cells co‐producing 1, 2 or 3 cytokines is shown in (B).
- C
Using a panel of 100 15‐mer peptides spanning the HIV‐1 Gag protein, we designed ten pools of 25 peptides so that each peptide was present in two pools and with minimal overlap between the pools. Cells from the spleens of immunised mice were stimulated for 24 h with these peptide pools and responses were read out by IFNγ ELISPOT assay. NT: not treated
- D
The peptides that were common between pools 4 and 9 (p79, p80, p91, p92) were tested individually.
- E
Using NetMHC, we identified a 9‐mer, a 10‐mer and an 11‐mer in p92 as predicted strong binders to H2‐Db.
- F
Splenocytes from immunised mice were stimulated with the four versions of p92 shown in (E).

- A
Weight loss was monitored over the course of infection and is shown as a percentage of weight prior to infection.
- B, C
Five days after infection, virus titres in the ovaries were quantified by plaque assay. A representative example of the plaque assay is shown in (B), and pooled data from three independent experiments including a total of 12–17 mice per group are shown in (C).
- A, B
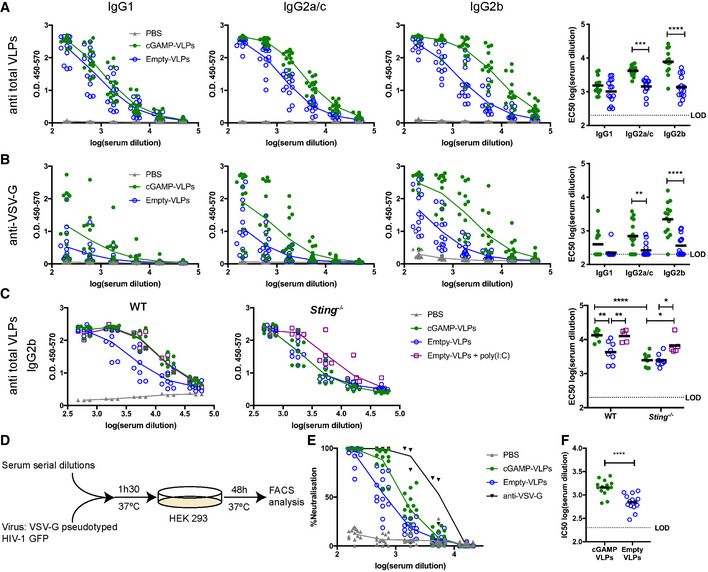
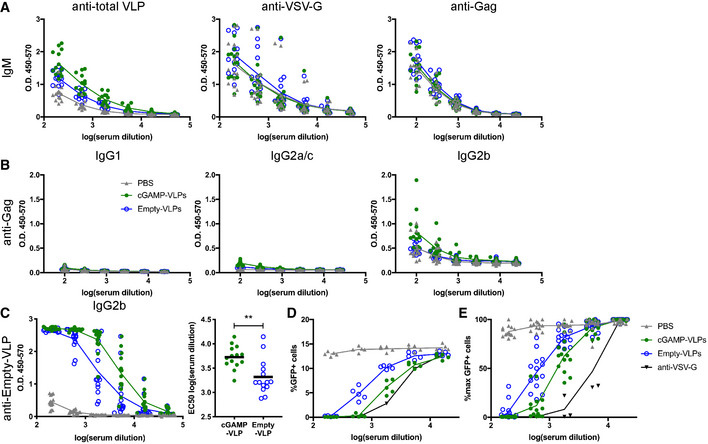
cGAMP loading enhances IgG responses specific to VLP proteins, including VSV‐G. ELISA plates were coated with lysate from cGAMP‐VLPs (A) or recombinant VSV‐G protein (B). Antibodies of different isotypes specific for these proteins were measured in sera from immunised mice by ELISA. The optical density at increasing serum dilutions is shown in the first three graphs from the left, and the EC50 is on the right.
- C
Enhanced antibody production following immunisation with cGAMP‐VLPs relies on STING signalling. WT or Sting −/− mice were immunised with PBS, cGAMP‐VLPs, Empty‐VLPs or Empty‐VLPs + poly(I:C). IgG2b antibodies recognising VLP proteins were assessed by ELISA. The optical density at increasing serum dilutions is shown in the first two graphs from the left, and the EC50 is on the right.
- D–F
Immunisation with cGAMP‐VLPs enhances production of neutralising antibodies. Serial dilutions of serum samples from individual mice were incubated with VSV‐G pseudotyped HIV‐1‐GFP for 90 min at 37°C before infection of HEK293 cells. As a control, serial dilutions of the anti‐VSV‐G neutralising antibody 8G5F11 were tested in parallel. After 2 days, infection was measured by quantifying GFP+ cells by flow cytometry (D). Neutralising capacities of serum samples from individual animals were calculated as a percentage of neutralisation (calculated relative to the maximum infection in each experiment) (E) and as the half‐maximal inhibitory concentration (IC50) (F).
- A
IgM responses. ELISA plates were coated with lysate from cGAMP‐VLPs, recombinant VSV‐G protein or recombinant HIV‐1 Gag protein. IgM antibodies specific for these proteins were measured in sera from immunised mice. The optical density at increasing serum dilutions is shown.
- B
Gag‐specific antibody responses. ELISA plates were coated with recombinant HIV‐1 Gag protein. Antibodies of different isotypes specific for this protein were measured in sera from immunised mice by ELISA. The optical density at increasing serum dilutions is shown.
- C
cGAMP‐VLPs enhance production of anti‐Empty‐VLP antibodies. ELISA plates were coated with lysates from Empty‐VLPs. IgG2b antibodies specific for these lysates were measured in sera from immunised mice. The optical density at increasing serum dilutions is shown on the left, and the EC50 is on the right.
- D, E
cGAMP‐VLPs enhance production of anti‐VSV‐G neutralising antibodies. Serial dilutions of individual sera were incubated with VSV‐G pseudotyped HIV‐1‐GFP for 90 min at 37°C before infection of HEK293 cells. As a control, dilutions of the anti‐VSV‐G neutralising antibody 8G5F11 were tested in parallel. After 2 days, infection was measured by quantifying GFP+ cells by flow cytometry. Data from a representative experiment are shown in (D). In (E), pooled data from three independent experiments including a total of 14 mice per condition are shown. For each experiment, the infection rate was normalised by setting the highest observed proportion of GFP+ cells to 100%.
- A–C
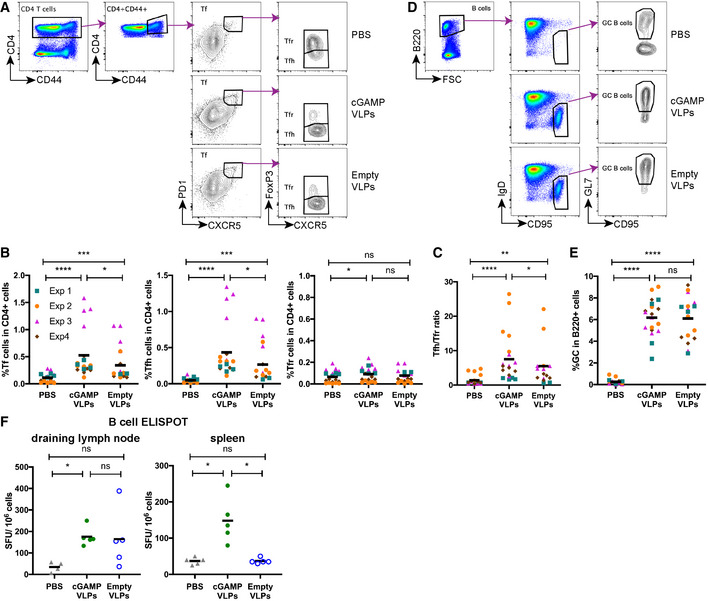
Immunisation with cGAMP‐VLPs enhances accumulation of Tfh cells in the draining lymph node. T follicular (Tf) cells were identified by flow cytometry as CD4+CD44+CXCR5hiPD1hi cells and were further subdivided into Tfr cells (FoxP3+) and Tfh cells (FoxP3−). The gating strategy is shown in (A), and the percentages of Tf, Tfh and Tfr cells within CD4+ cells are shown in (B). The ratio of Tfh/Tfr is shown in (C).
- D, E
Immunisation with VLPs induces germinal centre formation. Germinal centre B cells were identified by flow cytometry as B220+IgD−CD95+GL7+ cells. The gating strategy is shown in (D), and the percentage of germinal centre B cells amongst B220+ cells is shown in (E).
- F
Immunisation with cGAMP‐VLPs increases production of antibody‐secreting cells. Cells from draining lymph nodes and spleens were seeded in ELISPOT plates coated with cGAMP‐VLP lysates. After overnight incubation, cells producing VLP‐specific IgG antibodies were identified using an anti‐IgG Fc antibody.
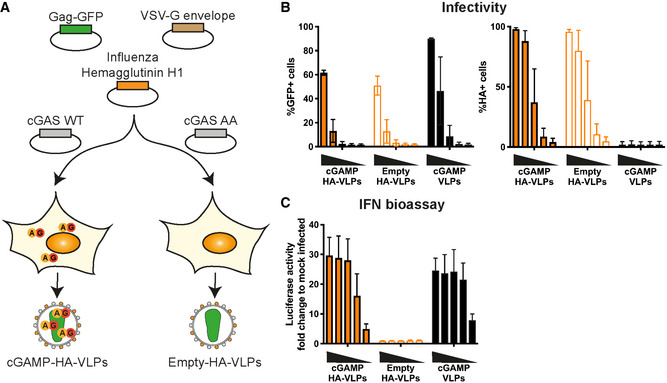
Schematic representation of cGAMP‐HA‐VLP and Empty‐HA‐VLP production. HEK293T cells were transfected with plasmids encoding HIV‐1 Gag‐GFP, VSV‐G envelope and IAV HA. cGAMP‐HA‐VLPs were collected from cells co‐expressing cGAS WT and Empty‐HA‐VLPs from cells co‐expressing catalytically inactive cGAS AA.
IAV HA is present in HA‐VLPs. HEK293 cells were infected with decreasing amounts of cGAMP‐HA‐VLPs and Empty‐HA‐VLPs (1/5 serial dilutions starting at 2 µl of VLP stocks per well). Infection was monitored 24 h later by quantifying GFP+ and HA+ cells by flow cytometry. cGAMP‐VLPs were used for comparison.
cGAMP‐HA‐VLPs induce a similar IFN‐I response in infected cells compared with cGAMP‐VLPs. Supernatants from infected cells shown in (B) were tested for the presence of IFN‐I as shown in Fig 1C.

- A, B
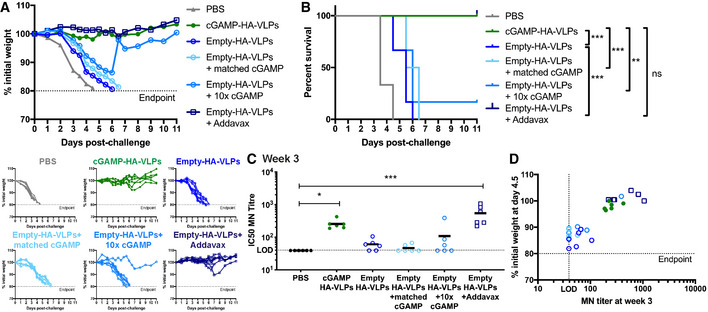
VLPs pseudotyped with IAV HA induce neutralising antibodies. Two (A) or three (B) weeks after immunisation with the indicated doses of VLPs, sera were collected, heat‐inactivated, and titres of antibodies capable of neutralising an IAV expressing a matched HA protein were determined by microneutralisation (MN) assay. The dotted line shows the limit of detection (LOD).
- C, D
Low doses of cGAMP‐HA‐VLPs confer protection following IAV challenge. One month after immunisation with the indicated doses of VLPs, animals were infected with 104 TCID50 of IAV PR8 virus. Weight loss was monitored over the following 11 days and is shown as a percentage of starting weight (C, upper graph shows mean and lower graphs show individual mice for each condition). Animals approaching the humane end‐point of 20% weight loss were culled and survival to end‐point curves are shown in (D).
- A, B
cGAMP‐HA‐VLPs and Empty‐HA‐VLPs + AddaVax protect against IAV challenge. One month after immunisation, animals were infected with 104 TCID50 of IAV PR8 virus. Weight loss was monitored over the following 11 days and is shown as a percentage of starting weight (A, upper graph shows mean and lower graphs show individual mice for each condition). Animals approaching the humane end‐point of 20% weight loss were culled and survival to end‐point curves are shown in (B).
- C, D
cGAMP‐HA‐VLPs and Empty‐HA‐VLPs + AddaVax induce neutralising antibody responses that accompany protection. Three weeks after immunisation with 5 × 10⁴ IU of the indicated HA‐VLPs, sera were collected and heat‐inactivated. Titres of antibodies capable of neutralising an IAV expressing a matched HA protein were determined by microneutralisation (MN) assay (C). The dotted line shows the limit of detection (LOD). Correlation between the MN titres at week 3 and the weight loss at day 4.5 post‐challenge is shown in (D).
- A
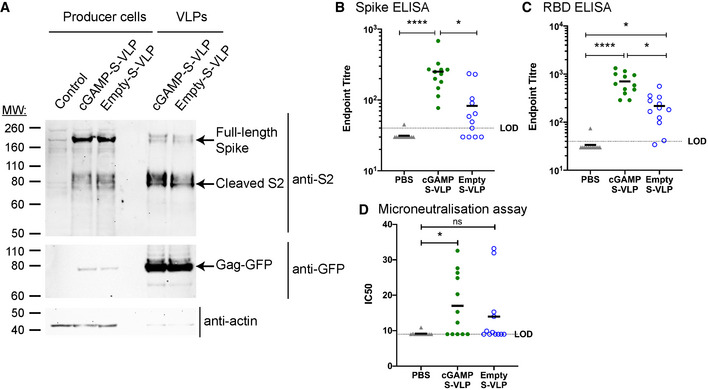
cGAMP‐S‐VLPs and Empty‐S‐VLPs incorporate SARS‐CoV‐2 S. Lysates from VLP producer cells and VLP preparations were analysed by Western blot for the presence of the S2 subunit of SARS‐CoV‐2 S, Gag‐GFP and actin using the indicated antibodies.
- B, C
Immunisation with cGAMP‐S‐VLPs augments anti‐Spike and anti‐RBD antibody titres. Mice were immunised via the intra‐muscular route with 5 × 10⁵ IU of cGAMP‐S‐VLPs, Empty‐S‐VLPs or PBS as a control. Three weeks after immunisation, sera were collected, heat‐inactivated, and titres of antibodies capable of binding to SARS‐CoV‐2 S (B) or its RBD (C) were determined by ELISA. The antibody response was expressed as end‐point titre defined as the reciprocal of the highest serum dilution that gives a positive signal (blank+10SD). The dotted line shows the limit of detection (LOD).
- D
Immunisation with cGAMP‐S‐VLPs induces neutralising antibodies. Using serum samples from (B), antibody titres capable of neutralising SARS‐CoV‐2 were determined by microneutralisation (MN) assay. Calculated IC50 doses from multiple serum dilutions are shown. The dotted line shows the LOD.
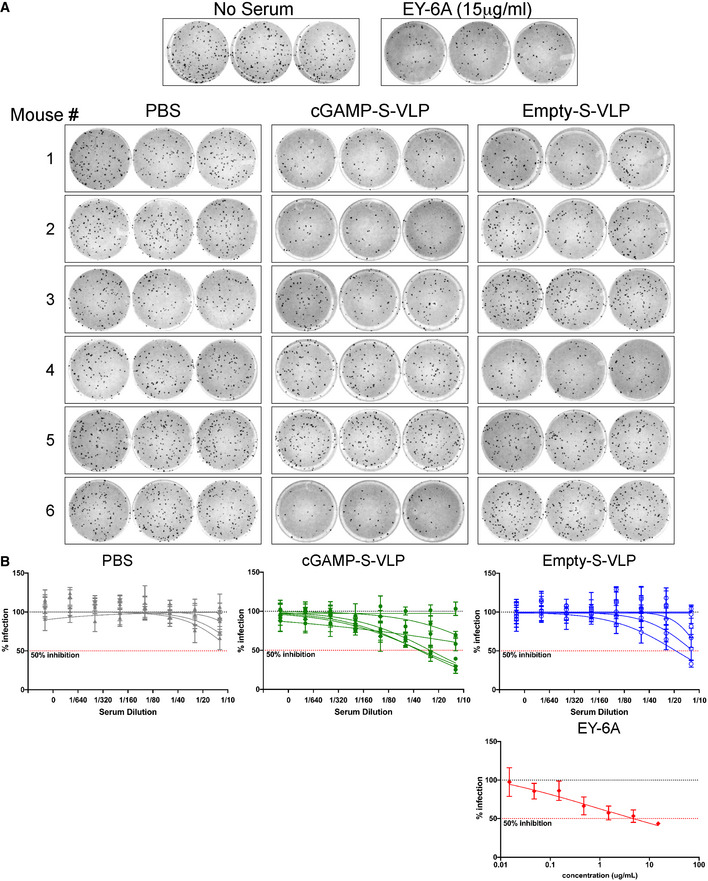
- A, B
Using serum samples from Fig 7B, antibody titres capable of neutralising SARS‐CoV‐2 were determined by microneutralisation (MN) assay. No serum treatment and the neutralising antibody EY6A served as negative and positive controls, respectively, and technical triplicates were performed. Panel (A) shows the raw data using a 1:10 dilution of serum samples. (B) shows the percentage of infected foci relative to the negative control for serial serum or EY6A dilutions. Each line represents one animal, and data points are mean with SD of three technical replicates. Dotted lines show 100 and 50% infection. Data are from one of two experiments each including six animals per group.
References
Publication types
MeSH terms
Substances
Grants and funding
LinkOut - more resources
Full Text Sources
Medical
Molecular Biology Databases
Research Materials
Miscellaneous
