. 2021 Jul 16;478(13):2601-2617.
doi: 10.1042/BCJ20210160.

The structures of E. coli NfsA bound to the antibiotic nitrofurantoin; to 1,4-benzoquinone and to FMN

Affiliations

The structures of E. coli NfsA bound to the antibiotic nitrofurantoin; to 1,4-benzoquinone and to FMN

Martin A Day et al. Biochem J. .

Abstract

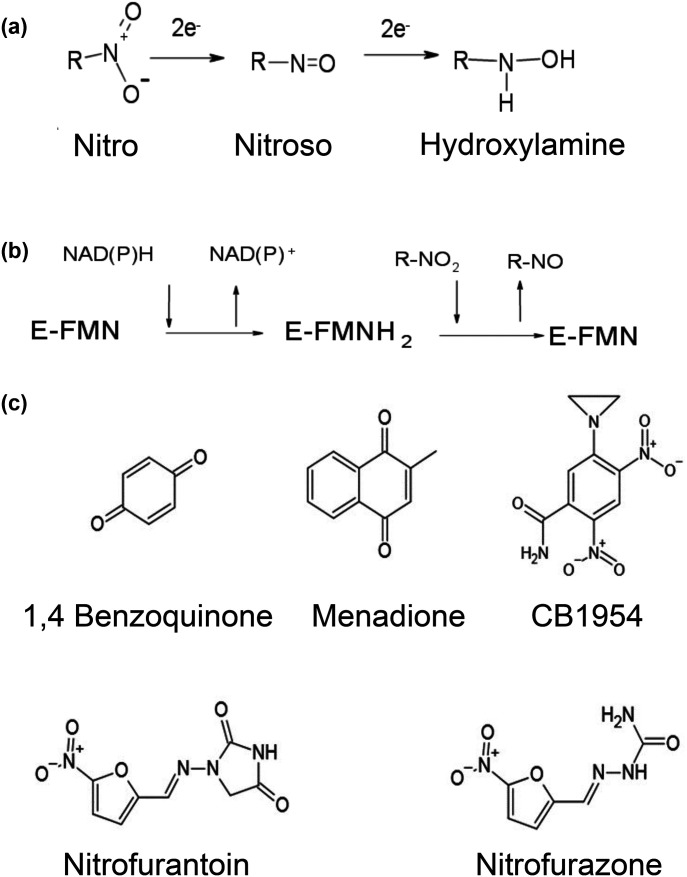
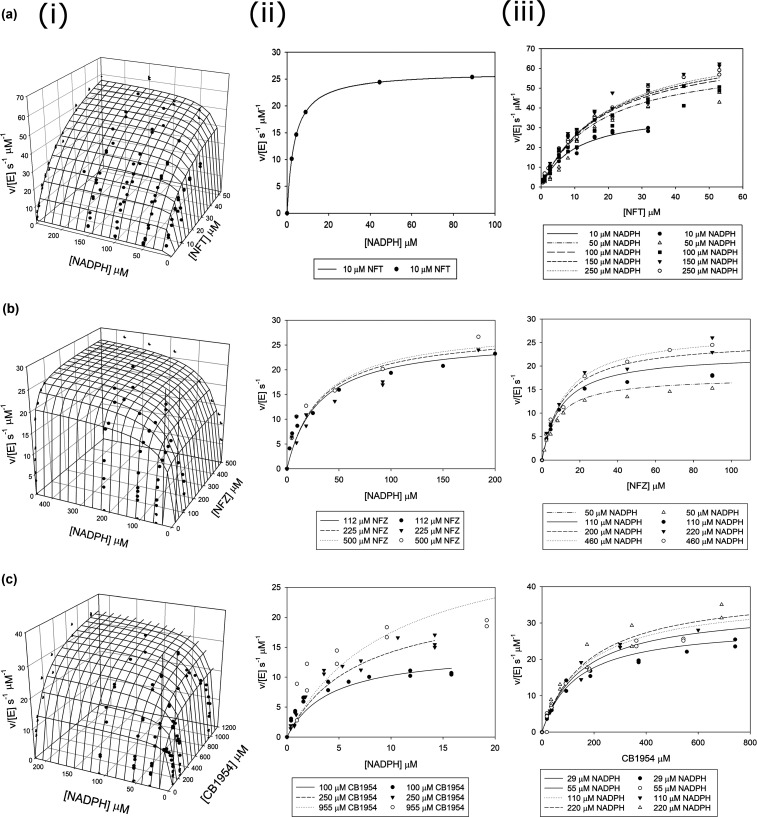
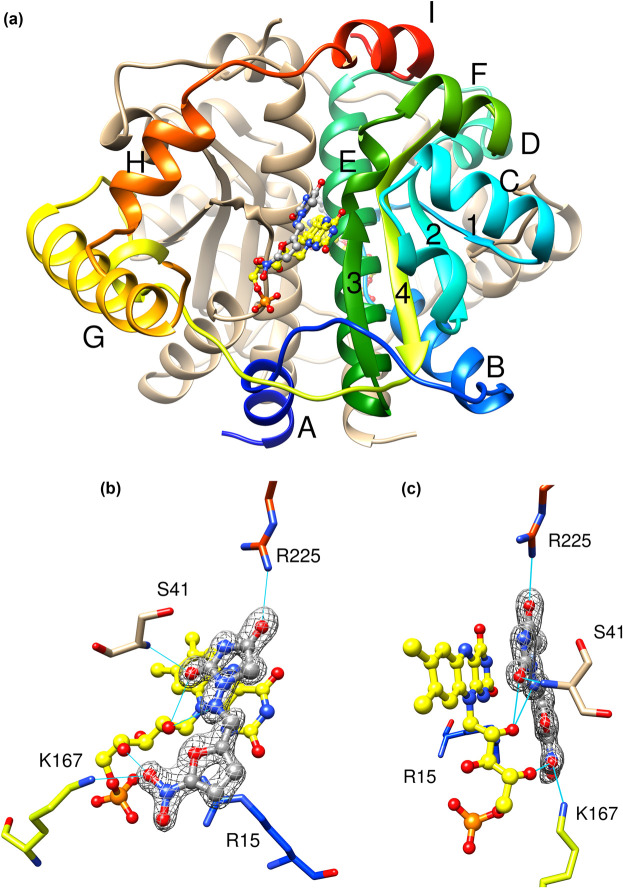
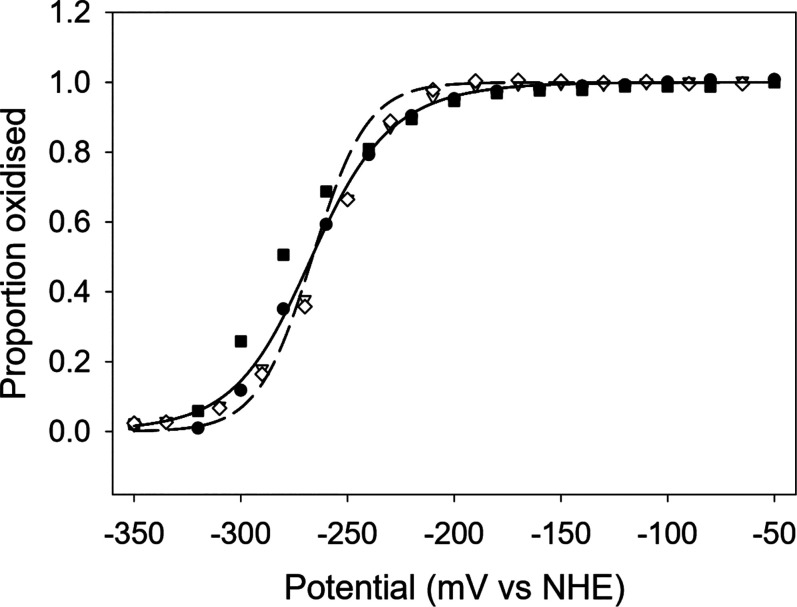
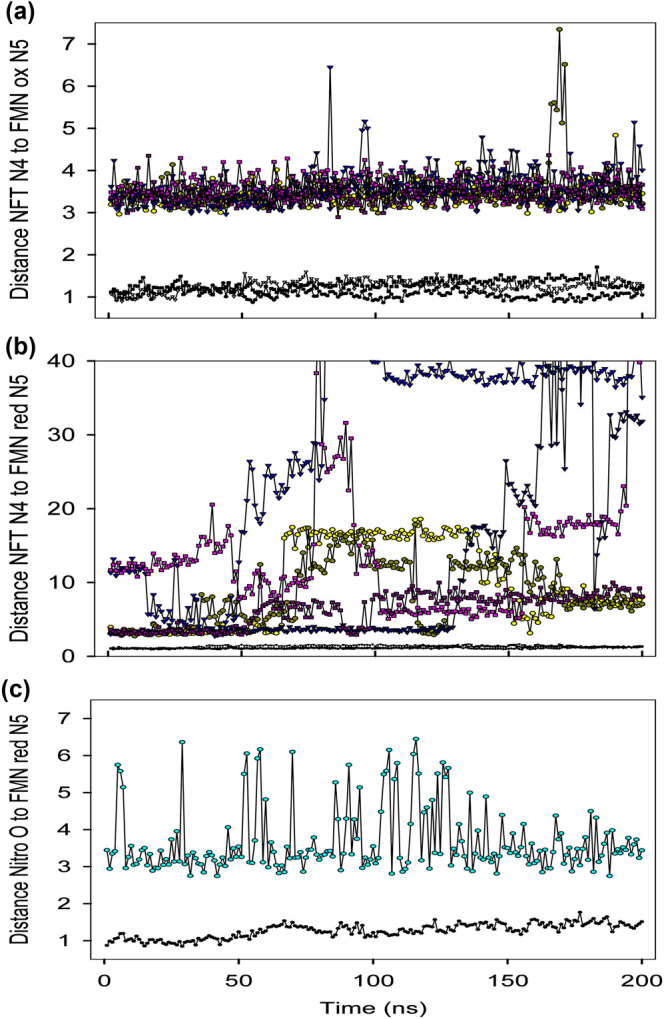
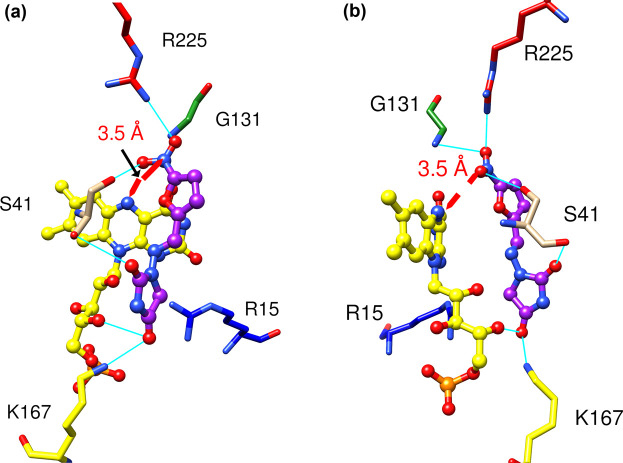
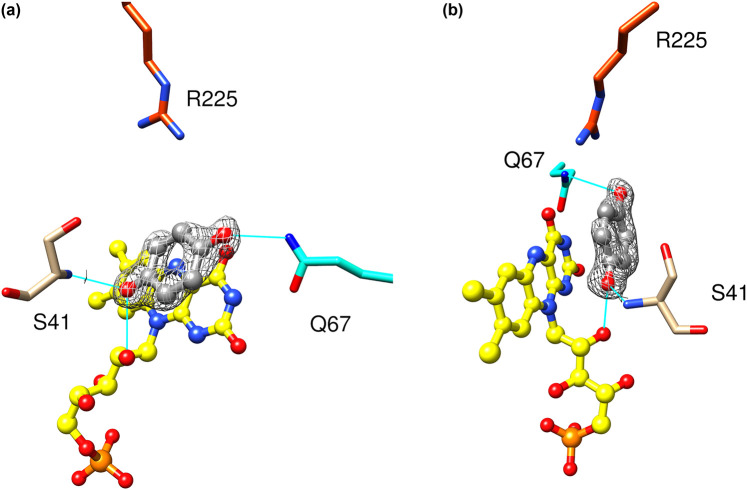
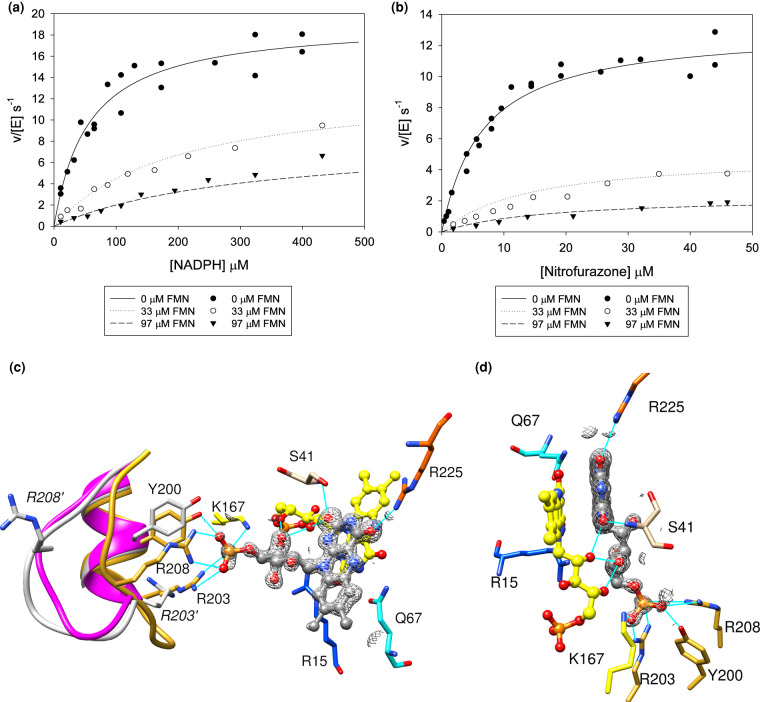
NfsA is a dimeric flavoprotein that catalyses the reduction in nitroaromatics and quinones by NADPH. This reduction is required for the activity of nitrofuran antibiotics. The crystal structure of free Escherichia coli NfsA and several homologues have been determined previously, but there is no structure of the enzyme with ligands. We present here crystal structures of oxidised E. coli NfsA in the presence of several ligands, including the antibiotic nitrofurantoin. Nitrofurantoin binds with the furan ring, rather than the nitro group that is reduced, near the N5 of the FMN. Molecular dynamics simulations show that this orientation is only favourable in the oxidised enzyme, while potentiometry suggests that little semiquinone is formed in the free protein. This suggests that the reduction occurs by direct hydride transfer from FMNH- to nitrofurantoin bound in the reverse orientation to that in the crystal structure. We present a model of nitrofurantoin bound to reduced NfsA in a viable hydride transfer orientation. The substrate 1,4-benzoquinone and the product hydroquinone are positioned close to the FMN N5 in the respective crystal structures with NfsA, suitable for reaction, but are mobile within the active site. The structure with a second FMN, bound as a ligand, shows that a mobile loop in the free protein forms a phosphate-binding pocket. NfsA is specific for NADPH and a similar conformational change, forming a phosphate-binding pocket, is likely to also occur with the natural cofactor.

Keywords: antibiotic; flavoprotein; nitroreductase; oxidation–reduction.


Conflict of interest statement

The authors declare that there are no competing interests associated with the manuscript.

Figures

Figure 1.
Figure 1.. Reaction and substrates of nitroreductases.
(a) Reduction of nitro groups by two-electron steps to nitroso and then to hydroxylamine derivatives. (b) Substituted enzyme (ping-pong) mechanism of nitroreductases. In the first step, the FMN cofactor of the enzyme is reduced to FMNH2. In the second step the enzyme reduces the substrate. (c) Structures of substrates of NfsA studied. Top: 1,4-Benzoquinone; Menadione, CB1954; Bottom: Nitrofurantoin, nitrofurazone.
Figure 2.
Figure 2.. Steady-state kinetics of NfsA with nitroaromatic substrates.
Steady-state kinetics of the reduction of (a) Nitrofurantoin, (b) Nitrofurazone, and (c) CB1945 by NADPH, catalysed by NfsA. Initial rates of reaction at different concentrations of NADPH and substrate were monitored. (i) The global, 3D fits of all the data; dots show the experimental rates and the mesh shows the fit to equation (1). (ii) Reactions done at different initial concentrations of NADPH at a series of constant substrate concentrations, the dots show the experimental points and the lines show the fits of the global rate constants. (iii) as (ii) but reactions were done at various concentrations of nitroaromatic substrate at different constant concentrations of NADPH. The reactions were measured in a 10 mM Tris pH 7.0 buffer and 4.5% DMSO, at 25°C; those with nitrofurantoin also contained 50 mM NaCl. (a) For nitrofurantoin, the lines are the simulations of equation (1) for kcat 81 s−1, Km nitrofurantoin 20.6 µM, and Km NADPH 10.9 µM. (b) For nitrofurazone, the lines are the simulations for kcat 29.6 s−1, Km nitrofurazone 13.0 µM, and Km NADPH 34.0 µM. (c) For CB1945 the lines are the simulations for kcat 42.0 s−1, Km CB1954 190 µM, and Km NADPH 12.0 µM. The standard deviations and P statistics for the fits are given in Table 1.
Figure 3.
Figure 3.. Crystal Structure of NfsA with nitrofurantoin.
(a) Ribbon diagram of NfsA dimer, in the presence of nitrofurantoin. One subunit is in tan and the other is in rainbow colours blue to red from N- to C-terminus. The helices of the coloured subunit are labelled A-I, and the strands are numbered 1–4. The FMN cofactor is shown as ball and stick, with C atoms in yellow, N blue, oxygen red, and phosphorus orange. Nitrofurantoin is in ball and stick representation with C atoms in grey, and heteroatoms coloured as for FMN. (b,c) Two views of the nitrofurantoin binding site of NfsA. The FMN cofactor and nitrofurantoin are shown in ball and stick, coloured as in (a). The side chains that interact with nitrofurantoin are shown as sticks, labelled, with carbons atoms coloured as in the rainbow depiction of the backbone in (a), and heteroatoms coloured in CPK colours, as in (a). Cyan lines show the hydrogen bonding to the ligand. The mesh shows the electron density within a radius of 2 Å from the nitrofurantoin (level 0.44 e) at 1 σ.
Figure 4.
Figure 4.. Potential titration of NfsA.
Symbols show two redox titrations, on two aliquots of the same enzyme preparation. Titrations were performed with 80 μM NfsA in 50 mM phosphate buffer, pH 7.5, 500 mM KCl, 10% glycerol, in the absence of redox mediators. Black symbols, oxidation cycles — square experiment 1, circle experiment 2. White symbols — reduction cycles, triangles, experiment 1, diamonds experiment 2. Dashed line — fit of data to a concerted two-electron transfer, with midpoint potential −264 mV; solid line — fit of data to two single-electron steps with potentials −272 mV and −268 mV, respectively.
Figure 5.
Figure 5.. MD simulations of Nitrofurantoin bound to NfsA.
(a) Plot of the distance between the nitrofurantoin N4 amide and FMN N5 in oxidised NfsA. Three separate molecular dynamics simulations of nitrofurantoin in NfsA were run based on the crystal structure of the dimeric complex, with nitrofurantoin in both active sites. The RMSD of the protein backbone from the initial structure is shown with black markers, circles for run 1, triangles for run 2, and squares for run 3. The distances of the N4 amide group of nitrofurantoin to the FMN N5 in each run are shown in yellow/dark yellow (for site 1 and site 2, respectively) for run 1, in blue/dark blue for run 2, and in pink/dark pink for run 3. All distances are in Ångstrom. (b) Centre- as in figure a, but now with NfsA reduced. (c) Distance of the nitro oxygen of nitrofurantoin to the FMN N5 in a simulation with reduced dimeric NfsA and nitrofurantoin bound in the opposite orientation to that in the crystal structure, in a single site, as in (a,b), with the nitro oxygen close to the FMN N5. The RMSD of the protein backbone from the initial structure is shown with black circles, the distance of the nitro oxygen to FMNH2 N5 is shown in cyan.
Figure 6.
Figure 6.. Model of nitrofurantoin bound to reduced NfsA.
(a,b) Two views of nitrofurantoin modelled bound to reduced NfsA. The FMNH- cofactor is shown in ball and stick, coloured as in Figure 3. Nitrofurantoin is shown in ball and stick representation with the carbon atoms in purple and the heteroatoms coloured as for FMN. The side chains that interact with the nitrofurantoin are shown as sticks, labelled, with carbons atoms coloured as the ribbon in Figure 3a, and heteroatoms coloured as in Figure 3a. Cyan lines show the hydrogen bonding to the ligand. The red arrow shows the distance between the N5 atom of FMN and one nitro oxygen atom of the ligand, appropriate for direct hydride transfer.
Figure 7.
Figure 7.. Structure of NfsA with bound hydroquinone.
(a,b) Two views of hydroquinone bound to NfsA. The FMN cofactor is shown in ball and stick, coloured as in Figure 3. Hydroquinone is shown in ball and stick representation with the carbon atoms in grey and the oxygen atoms in red. The side chains that interact with the ligand are shown as sticks, labelled, with carbons atoms coloured as the ribbon Figure 3a, and heteroatoms coloured as in Figure 3a. Cyan lines show the hydrogen bonding to the ligand. The mesh shows the electron density within a radius of 2 Å from the hydroquinone (level 0.72 e) at 1.5 σ.
Figure 8.
Figure 8.. Kinetics and structure of NfsA with FM.
(a,b) Steady-state kinetics of NfsA with nitrofurazone in the presence or absence of FMN. (a), reactions done with 99 µM nitrofurazone, varying NADPH. (b), reactions done with 97 µM NADPH, varying nitrofurazone. All reactions were done in a 10 mM Tris pH 7.0 buffer containing 50 mM NaCl and 4.5% DMSO, at 25°C. The symbols show the measured rates and the lines show the simulated Michaelis Menten curves for mixed inhibition, with Km NADPH 62 µM, Km nitrofurazone 11 µM, kcat 21.4 s−1, Ki NADPH 8 µM, and Ki nitrofurazone 7 µM. The standard errors in the fitting parameters and the P statistics for the data are given in Supplementary Table S3. (c) The structure of a second FMN bound to NfsA. The FMN ligand is shown in ball and stick representation with the carbon atoms in grey and the heteroatoms coloured as in Figure 3a. The FMN cofactor is coloured as in Figure 3a. The backbone of residues 198–210 and carbon atoms of selected side chains of that region are coloured in gold for the FMN-bound structure, grey for the nitrofurantoin-bound structure and purple for the structure in the absence of ligand from 1F5V [27]. Side chains of residues R203 and R208 from the nitrofurantoin-bound structure are labelled in italics and given a prime symbol. All other side chains, in normal font, are from the FNM-bound structure and are coloured as in Figure 3a, with the heteroatoms of the side chains coloured blue for nitrogen and red for oxygen. The mesh shows the electron density within 2 Å of the FMN ligand at 0.7 sigma, (0.092 e). Cyan lines show the hydrogen bonds between the protein, the FMN cofactor, and the FMN ligand. (d) A second view of the structure shown in (c), with the same colouring.

Comment in

Similar articles

Cited by

References

    1. Guay, D.R. (2001) An update on the role of nitrofurans in the management of urinary tract infections. Drugs 61, 353–364 10.2165/00003495-200161030-00004 - DOI - PubMed
    1. Mccalla, D.R., Olive, P., Tu, Y. and Fan, M.L. (1975) Nitrofurazone-reducing enzymes in E coli and their role in drug activation in vivo. Can. J. Microbiol. 21, 1484–1491 10.1139/m75-220 - DOI - PubMed
    1. McOsker, C.C. and Fitzpatrick, P.M. (1994) Nitrofurantoin: mechanism of action and implications for resistance development in common uropathogens. J. Antimicrob. Chemother. 33 Suppl A, 23–30 10.1093/jac/33.suppl_A.23 - DOI - PubMed
    1. Whiteway, J., Koziarz, P., Veall, J., Sandhu, N., Kumar, P., Hoecher, B.et al. (1998) Oxygen-insensitive nitroreductases: analysis of the roles of nfsA and nfsB in development of resistance to 5-nitrofuran derivatives in Escherichia coli. J. Bacteriol. 180, 5529–5539 10.1128/JB.180.21.5529-5539.1998 - DOI - PMC - PubMed
    1. Mccalla, D.R., Kaiser, C. and Green, M.H.L. (1978) Genetics of nitrofurazone resistance in Escherichia coli. J. Bacteriol. 133, 10–16 10.1128/jb.133.1.10-16.1978 - DOI - PMC - PubMed

Publication types

MeSH terms

LinkOut - more resources