. 2021 Jun 15;148(12):dev198275.
doi: 10.1242/dev.198275. Epub 2021 Jun 18.

Axial elongation of caudalized human organoids mimics aspects of neural tube development

Affiliations

Axial elongation of caudalized human organoids mimics aspects of neural tube development

Ashley R G Libby et al. Development. .

Abstract

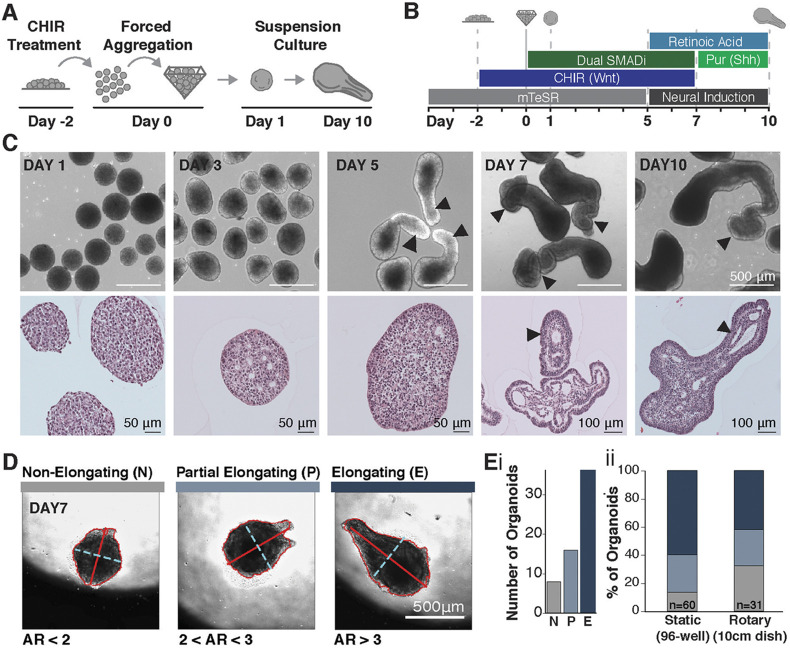
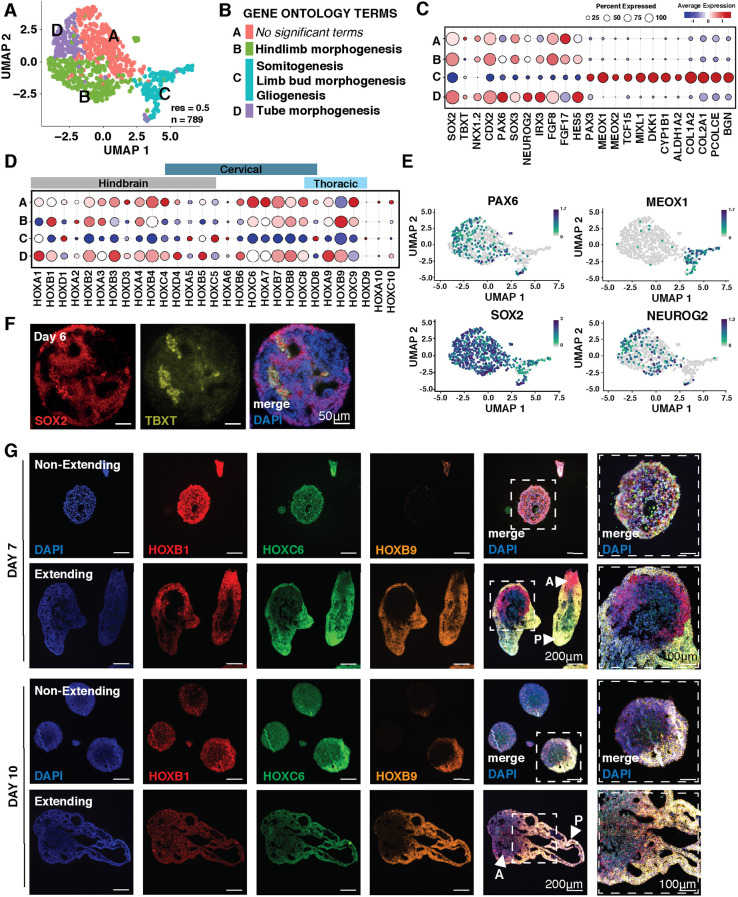
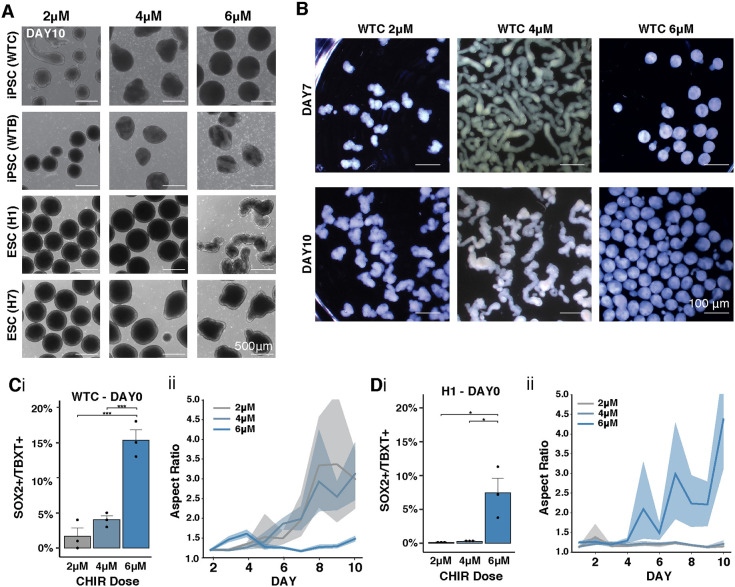
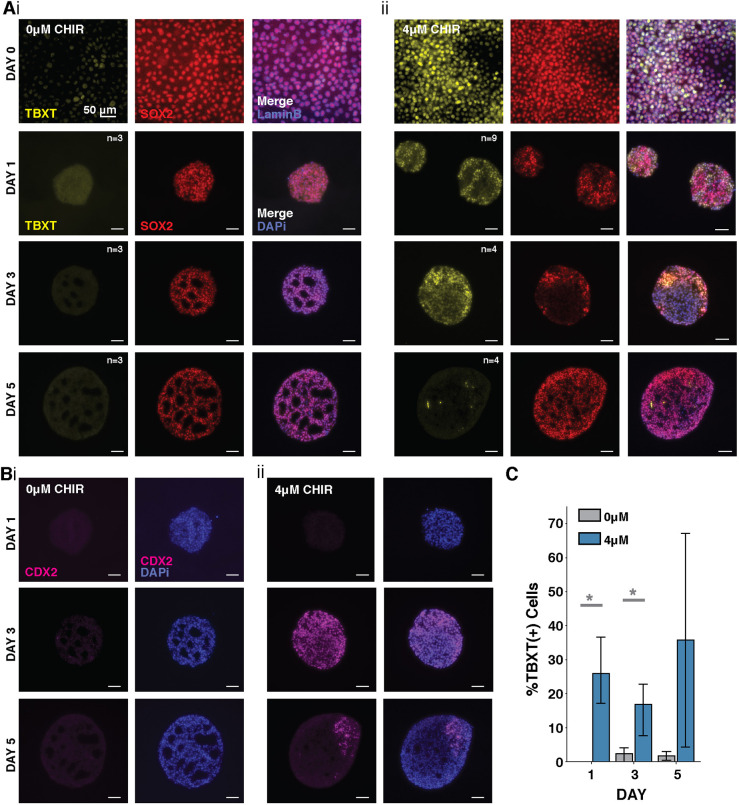
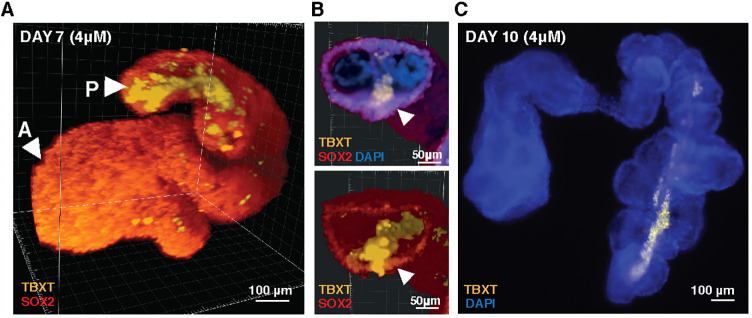
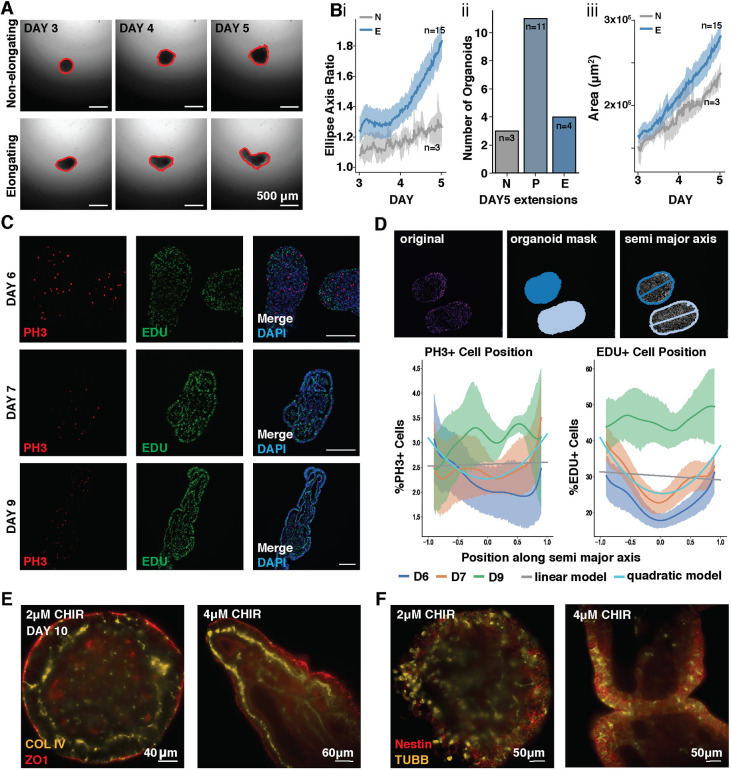
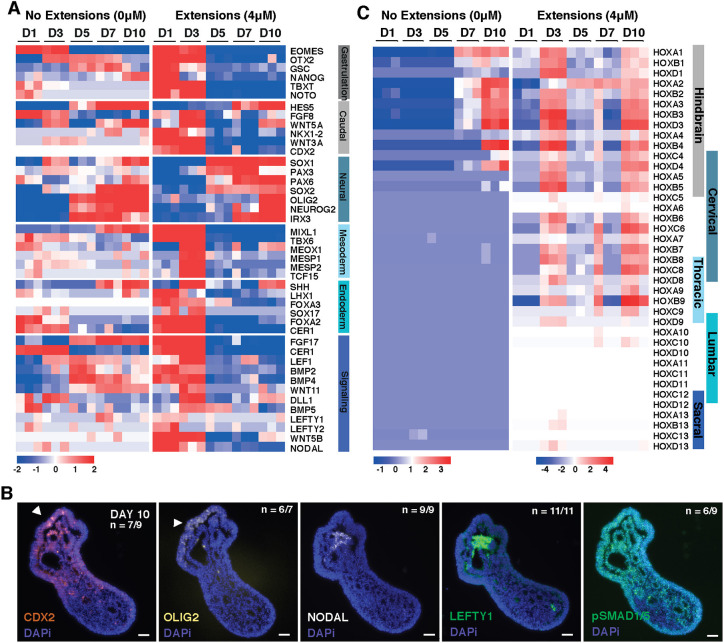
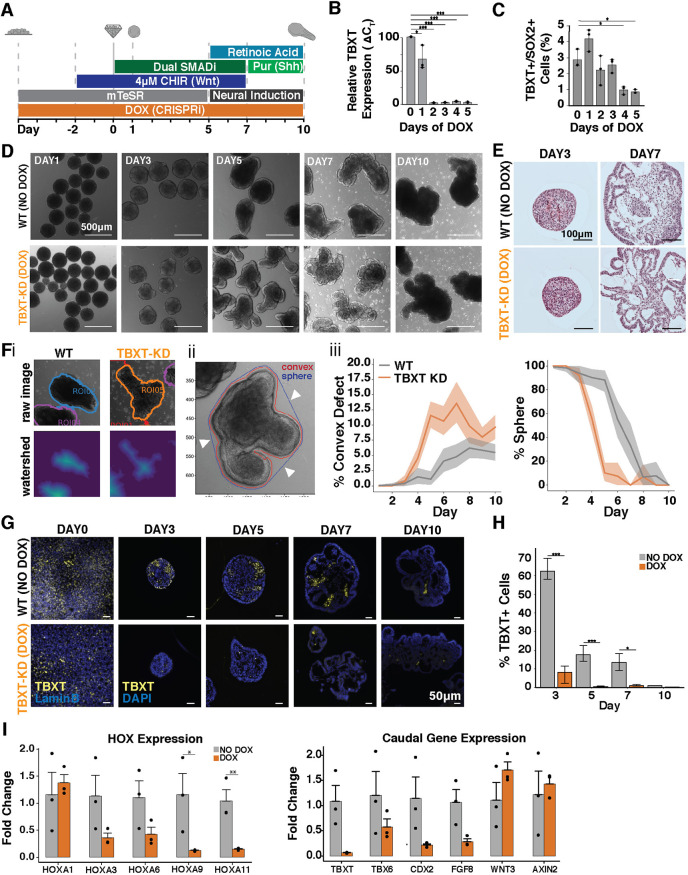
Axial elongation of the neural tube is crucial during mammalian embryogenesis for anterior-posterior body axis establishment and subsequent spinal cord development, but these processes cannot be interrogated directly in humans as they occur post-implantation. Here, we report an organoid model of neural tube extension derived from human pluripotent stem cell (hPSC) aggregates that have been caudalized with Wnt agonism, enabling them to recapitulate aspects of the morphological and temporal gene expression patterns of neural tube development. Elongating organoids consist largely of neuroepithelial compartments and contain TBXT+SOX2+ neuro-mesodermal progenitors in addition to PAX6+NES+ neural progenitors. A critical threshold of Wnt agonism stimulated singular axial extensions while maintaining multiple cell lineages, such that organoids displayed regionalized anterior-to-posterior HOX gene expression with hindbrain (HOXB1) regions spatially distinct from brachial (HOXC6) and thoracic (HOXB9) regions. CRISPR interference-mediated silencing of TBXT, a Wnt pathway target, increased neuroepithelial compartmentalization, abrogated HOX expression and disrupted uniaxial elongation. Together, these results demonstrate the potent capacity of caudalized hPSC organoids to undergo axial elongation in a manner that can be used to dissect the cellular organization and patterning decisions that dictate early human nervous system development.

Keywords: Neural tube development; Organoid models; Stem cell biology.


Conflict of interest statement

Competing interests The authors declare no competing or financial interests.

Figures

Fig. 1.
Fig. 1.
CHIR treatment of neural PSC aggregates results in axial extension. (A,B) Schematic of experimental set-up and differentiation protocol using 2 μM CHIR. (C) Bright-field and histological images of elongating organoids (arrowheads indicate elongated structures). (D) Images from time-course of extension, displaying organoids that do not elongate (N), partially elongate (P) or fully elongate (E) with respective axis ratios (ARs) of AR<2, 2<AR<3 and AR>3 (minor axis dotted cyan line, major axis solid red line). (E,i) Elongation types detected during time lapse imaging (n=60 organoids). (E,ii) Quantification of elongating types across static (n=60 organoids) and rotary (n=31 organoids) cultures.
Fig. 2.
Fig. 2.
Gene expression within elongating organoids. (A) UMAP of n=789 cells from elongating organoids exposed to CHIR (2 μM) at day 10 of differentiation from single-cell RNA-seq. (B) Significant (P<0.05) gene ontology classifications derived from the most differentially upregulated genes in elongating organoids from single-cell RNAseq. Gene ontology terms are assigned to identified clusters. (C) Dot plot displaying genes associated with neural and mesodermal lineages across clusters. (D) Dot-plot displaying HOX gene expression across clusters. (E) UMAPs showing cells expressing PAX6, MEOX1, SOX2 and NEUROG2. Color scale indicates a normalized increase in log2 fold change from min expression to max expression of the respective gene. (F) Immunofluorescence images of organoid paraffin sections stained for SOX2 and TBXT. (G) RNA-scope of sectioned elongating and non-elongating organoids cultured at low density and with 2 μM CHIR with probes for HOX genes marking different regions of the spine at day 7 and day 10 of differentiation [arrowheads mark anterior (A) and posterior (P) ends of organoids]. Scale bars: 200 μm; 100 μm (right-most column).
Fig. 3.
Fig. 3.
Wnt mediates organoid extension across human stem cell lines. (A) Bright-field images of organoids derived from iPSC and ESC lines at day 7 of differentiation with increased CHIR doses. (B) Stereoscope images of WTC-derived organoids at day 7 or day 10 of differentiation given 2 μM, 4 μM or 6 μM CHIR treatment. (C,D) (i) Quantification of SOX2+TBXT+ cells by flow cytometry in day 0 WTC hiPSCs organoids (C) or H1 ESC organoids (D) as a function of CHIR doses. (ii) Quantification of the length of extensions in WTC (C) and H1 (D) organoids measured as aspect ratio (i.e. major to minor). Solid line indicates mean; shading represents 95% confidence bounds. Student's t-test;*P<0.05 and ***P<0.0005.
Fig. 4.
Fig. 4.
Emergence of TBXT, SOX2 and CDX2 over time in 4 μM CHIR organoids. (A) Fluorescence images of histological sections of cultures exposed to (i) 0 μM CHIR and (ii) 4 μM CHIR before and after aggregation showing increases in TBXT+SOX2+ cells with CHIR treatment. (B) Fluorescence images of histological sections of cultures exposed to (i) 0 and (ii) 4 μM CHIR showing CDX2 emergence and localization over time. (C) Quantification of TBXT loss in fluorescence images (n>3 per day, *P=0.04; data are mean±s.e.m.).
Fig. 5.
Fig. 5.
TBXT streak in CHIR-treated elongating organoids. (A) 3D reconstruction based on light sheet fluorescence imaging of a day 7 4 μM elongating organoid showing a streak of TBXT traveling down its length. (B) Cross-section through the 3D reconstruction shown in A displaying a TBXT+ streak and TBXT+SOX2+ cells adjacent to the streak (arrowheads). (C) Fluorescence image of a representative day 10 organoid with a TBXT streak [all aggregates shown cultured in high CHIR condition (4 μM)].
Fig. 6.
Fig. 6.
Organoids contain proliferative neuroepithelium. (A) Frames from video time-course tracking the diversity of 4 μM CHIR-treated organoid extensions in static cultures. Red outline defines area measured. (Bi) Quantification of ellipse axis ratios from day 3 to day 5 in 4 μM CHIR organoids labeled as non-elongating (N; grey) or elongating (E; blue). (Bii) Quantification of non-elongating (N), partially elongating (P) and elongating organoids (E) with axis ratios (ARs) of AR<2, 2<AR<3 and AR>3, respectively. (iii) Quantification of the surface area of non-elongating (NE; gray) or elongating (E; blue) organoids treated 4 μM CHIR. Solid lines represent the mean ratio (dark color) with 95% confidence interval (light colored shading); n=18 organoids. (C) Immunofluorescence images of EdU incorporation and phospho-histone 3 (pH3) localization in 4 μM CHIR organoids taken from paraffin sections. (D) Top: segmentation of organoid sections showing pH3 staining (left), segmentation of nuclei by DAPI staining (middle) and a total least squares elliptical fit of the segmentation contour with the major axis superimposed (right). Bottom: line plots for pH3 or EdU expression along the normalized semi-major axis of 4 μM CHIR organoids at day 6, 7 and 9. Linear and quadratic least squares fits of pH3 and EdU expression along the normalized semi-major axis for all days; n>4 independent organoid sections at each timepoint. (E,F) Optical sections from light-sheet microscopy of low CHIR (2 μM) and high CHIR (4 μM) organoids stained for COL IV and ZO1 or Nestin and βIII-Tubulin (TUBB3).
Fig. 7.
Fig. 7.
CHIR-treated organoids transition through multiple developmental stages. (A) Heat map of gene expression in 0 μM or 4 μM CHIR organoids over time displaying genes associated with gastrulation, caudal epiblast, neuroepithelium, mesoderm, endoderm and major signaling pathways, as determined by bulk RNAseq where the heat map displays the relative expression of a gene compared with the mean expression of all genes across all days. (B) Heat map of HOX gene relative expression compared with the mean expression across days in 0 μM or 4 μM CHIR organoids from bulk RNAseq. Scale bars: 50 μm. (C) Immunofluorescence images at day 10 of differentiation from paraffin sections in 4 μM CHIR organoids examining axis and developmental patterning markers (arrowheads indicate elongating region).
Fig. 8.
Fig. 8.
TBXT knockdown leads to increased epithelial folding. (A) Schematic of differentiation protocol timeline with TBXT knockdown (KD) induction via doxycycline (DOX). (B) Quantification of TBXT-KD efficiency by qPCR showing reduction in mRNA expression levels on day 0 of differentiation (day 5 of DOX treatment). (C) Quantification by flow cytometry of TBXT+SOX2+ cells with DOX treatment over time. (D) Bright-field images of the differentiation of TBXT-KD hiPSC line with and without DOX treatment (wild type; WT) over time. (E) Histological sections of organoids with and without DOX treatment at day 3 and 7 of differentiation. (F,i) Example images of organoid segmentation; (ii) example image of convex indentations on organoids (arrowheads indicate convex defects); (iii) quantification of the percent of organoids with convex defects and quantification of the loss of sphere morphology in organoids over time (n>14 organoids at each timepoint). (G) TBXT immunofluorescence staining of fixed cells (day 0) or organoid paraffin sections (days 3-10) with and without DOX treatment. (H) Quantification of the immunofluorescence signal indicating loss of TBXT (Student's t-test;*P<0.05 and ***P<0.0005). (I) qPCR quantification of HOX genes and genes related to axial pattern specification from day 10 organoids with and without DOX treatment (Student's t-test; *P<0.05 and **P<0.005).

Similar articles

Cited by

References

    1. Amin, S., Neijts, R., Simmini, S., Van Rooijen, C., Tan, S. C., Kester, L., Van Oudenaarden, A., Creyghton, M. P. and Deschamps, J. (2016). Cdx and T Brachyury Co-activate growth signaling in the embryonic axial progenitor niche. Cell Rep. 17, 3165-3177. 10.1016/j.celrep.2016.11.069 - DOI - PubMed
    1. Amoroso, M. W., Croft, G. F., Williams, D. J., O'keeffe, S., Carrasco, M. A., Davis, A. R., Roybon, L., Oakley, D. H., Maniatis, T., Henderson, C. E.et al. (2013). Accelerated high-yield generation of limb-innervating motor neurons from human stem cells. J. Neurosci. 33, 574-586. 10.1523/JNEUROSCI.0906-12.2013 - DOI - PMC - PubMed
    1. Azim, E., Jiang, J., Alstermark, B. and Jessell, T. M. (2014). Skilled reaching relies on a V2a propriospinal internal copy circuit. Nature 508, 357-363. 10.1038/nature13021 - DOI - PMC - PubMed
    1. Beccari, L., Moris, N., Girgin, M., Turner, D. A., Baillie-Johnson, P., Cossy, A.-C., Lutolf, M. P., Duboule, D. and Arias, A. M. (2018). Multi-axial self-organization properties of mouse embryonic stem cells into gastruloids. Nature 562, 272-276. 10.1038/s41586-018-0578-0 - DOI - PubMed
    1. Beck, F., Erler, T., Russell, A. and James, R. (1995). Expression of Cdx-2 in the mouse embryo and placenta: possible role in patterning of the extra-embryonic membranes. Dev. Dyn. 204, 219-227. 10.1002/aja.1002040302 - DOI - PubMed

Publication types